SlideShare a Scribd company logo
1 of 72
GETTING STARTED WITH MERGENT
ACCESSING MERGENT
1 Go to the Library Homepage(access through Course
Homepage or Student Portal)
2 Click “Find Articles & More”
3 Select “Databases by Subject”
4 Select “Business & Economics”
5 Select “Mergent”
RESEARCHING MERGENT
1 Enter the company name or ticker symbol
2 Select your company from the search results
3 Locate important information
}
}
Contact
information
Key
Figures
}
Company
information
in tabs
4 Select reports and download
5 Citation Format
Author. (year). Title of Document. Retrieved from name of
database.
Examples:
Mergent. (2016). Acadia Healthcare Annual Report. Retrieved
from Mergent Online database.
Mergent. (2017). Acadia Healthcare Company Details.
Retrieved from Mergent Online database.
Mergent. (2017). Acadia Healthcare Company Financials.
Retrieved from Mergent Online database.
LIBRARY
ASHFORD UNIVERSITY
October 2017
BUSINESS INSIGHTS: GLOBAL
Accessing Business Insights: Global
Watch a short video to
learn more about what this
resource has to offer,
including:
Go to the Library Homepage
(access through Course Homepage or Student Portal)
Click “Find Articles & More”
Select “Databases by Subject”
Select “Business & Economics”
Select “Business Insights: Global (Gale)”
1
2
3
4
5
https://www.youtube.com/watch?v=aXAKj6lQICg
Researching Business Insights: Global
1 Enter the company name or ticker symbol
2 Select your company from the search results
3 Locate important information
}Contact information
} CompanyInformation
Key
Figures}
4 Limit to Full Text
5 View Full Text
6
Share, save, print, download, or cite*
*always double-check database citations. For citation
information, go to writingcenter.ashford.edu
LIBRARY
ASHFORD UNIVERSITY
November 2017
http://writingcenter.ashford.edu/
External Environmental
Analysis
Learning Objectives
By the time you have completed this chapter, you should be able
to do the following:
• Conduct an industry and competitive analysis
and understand why it is important.
• Conduct a market analysis and understand
why it is important.
• Scan the general environment for any
changes or trends that might favor or
adversely affect the company.
4
Belinda Images / SuperStock
CHAPTER 4Section 4.1 Industry and Competitive Analysis
Chapter Outline
4.1 Industry and Competitive Analysis
4.2 Market Analysis
4.3 Environmental-Trend Analysis
An analysis of the external environment covers
the industry or segment in which the
company
competes, its competitors, markets, and other relevant
environmental trends and changes. The
purpose is to understand how the company’s
relevant environment is changing and might
change
in the future—in this sense, “relevant” means
anything the company might affect or could
be
affected by. Without such an understanding, doing
strategic planning becomes much more difficult.
4.1 Industry and Competitive Analysis
An industry analysis is the study of a firm’s
industry and the forces that might be causing
it to
change. It involves using a number of
standard but indispensable tools, including
Porter’s five-
forces model, industry attractiveness (part of the
GE Matrix), driving forces, critical-success factor
analysis, and strategic groups, all discussed in this
chapter. Because the ways in which an
industry
changes can dramatically affect the decisions a
company makes, an industry analysis has become
a key element in strategic planning.
The word industry in “industry analysis” can mean a
segment of a larger industry or the
industry
itself. If a company manufactures disk drives
for personal computers, for example, it could
say that
it competes in the disk-drive industry for purposes of
doing a strategic analysis, even though that
is really a segment of the computer industry.
What we are really analyzing is the arena
in which
the company competes.
One thing to keep in mind when
conducting an industry analysis is
to writedown what is true for the
industry, not for the company under
analysis. Sometimes industry data
are easy to obtain because they are
regularly published or because trade
groups or consulting firms keep tabs
on industry statistics. However,
many industries are not tracked by
any group, or they consist largely of
privately held firms. This makes get-
ting industry data and completing
an industry analysis difficult.
To minimize errors when using
inadequate data or relying on one
person’s estimates, it is advisable
to assemble a group of people to
share perspectives and use shared estimates in
the analysis. If the group is fairly
knowledgeable
about the industry, the perceptions gathered about
the industry will be more useful and make
Ryan McVay/Photodisc/Thinkstock
Assembling a group of knowledgeable people can be very help-
ful when performing an industry analysis.
CHAPTER 4Section 4.1 Industry and Competitive Analysis
the understanding more complete. Group members who
have differing estimates and opinions
will be forced to explain their views and, in
the process, either convince others they are
correct
or be persuaded to change their own views or
estimates. In this way, a shared perspective
leads
to greater understanding.
Doing an Industry Analysis
The purpose of doing an industry analysis is to
answer the following kinds of questions:
• What are the dominant economic characteristics of
the industry?
• In what ways is the industry changing, and why?
• Do buyers and/or suppliers have greater
bargaining power?
• How steep are entry barriers?
• Is the industry concentrated or fragmented?
• What must one do well in order to succeed
in this industry?
• How appealing is the industry?
Dominant Economic Characteristics of an Industry
Economic characteristics can vary by industry but
generally are applicable throughout business
and include the following:
• Industry size—total dollar sales of all firms in
the industry.
• Industry growth rate—percentage increase or
decrease over the previous year.
• Scope of competitive rivalry—local, regional,
national, international.
• Number of competitors—if known.
• Stage in the industry’s lifecycle:
• emerging—must be a brand-new industry
with total industry sales less than 5%.
• growth—total industry sales growing at over 5%
per year.
• shakeout—a transitional period between growth
and maturity where some competi-
tors fail, others are acquired, and the total number of
competitors shrinks.
• mature—total industry sales of between 0–5%
• declining—the growth rate must be negative for
several years in a row.
• The customers or buyers—Who are they? Where
are they? How many are there?
• Degree of vertical integration—How many
companies in the industry are vertically inte-
grated forward? How many are vertically integrated
backward? How many are vertically
integrated in both directions?
• Rate of technological innovation—How dependent is
the industry on technological inno-
vation? How much innovation is taking place?
• Product characteristics—Are the products commodity-
like or differentiated? This deter-
mines to a large extent the bargaining power
the industry has with respect to buyers. Are
the products high- or low-tech?
• Economies of scale—for example in purchasing,
production, shipping, distribution, or
advertising.
• Capacity utilization—Is capacity utilization in the
industry high or low? How sensitive are
variations in capacity utilization to profits? In
commodity-like industries, profits are very
sensitive to capacity utilization.
• Industry profitability—If profitability in the
industry is not high, what are some causes?
Commodity-like industries are low-profit, while
those with differentiated companies com-
mand higher profits.
CHAPTER 4Section 4.1 Industry and Competitive Analysis
Forces Driving Industry Change
To understand how an industry is changing, identify
the driving forces causing those changes. The
following are examples of driving forces:
• Changes in the industry growth rate
• Changes in who buys the product and how
customers use it
• Product or marketing innovations
• Changes in technology
• Exit or entry of major firms
• Circulation of technical knowledge
• Increasing global scope of the industry
• Changes in cost and efficiency, for example, in
process innovations
• Emerging buyer preferences for differentiation
• Changes in governmental or economic policy
• Deregulation or increasing regulation of an
industry
• Changes in societal attitudes, concerns, and
lifestyles
• Reductions or increases in uncertainty and
business risk
• Likelihood that this and one or more other
industries will merge or converge
It is one thing to ascertain that an industry has
been and is changing, but quite another to gauge
the
way it will change in the future. That is,
however, the challenge managers must face. If one
can come
to understand how an industry is changing and
what is causing it to change, the chances
are good that
future changes can be predicted and possibly
anticipated. In many industries today, rapidly
advancing
technology is changing everything about the
industry—the product itself, how it is made,
how it is
distributed, and how it is used. The examples
provided of driving forces may provide a
starting point
for an examination of a particular industry and
how it may be changing. Of course, it is
important to
keep in mind that every industry is unique and
may have driving forces other than those listed
here.
Bargaining Power
What exactly is bargaining power? In simple
terms, it comes down to who dictates
the terms such
as price, delivery, quality, and the like in a
negotiation. Consider the example of someone
trying to
sell a used car. There is a certain “Blue
Book” price for a car of a certain model,
age, mileage, condi-
tion, and options. If the make and model is in
high demand, the car at issue has low mileage,
and
is in good condition, then the price will be higher. It
is possible that several potential buyers may
actually bid up the price. The seller in that
situation may demand full payment in cash and
other
conditions and will probably get them. In this
case, the seller has bargaining power and
will end up
making a favorable deal. On the other hand, if
the seller is desperate to sell the car, or it
is not in
very good condition, perhaps needing major repairs,
and the seller has to incur costs to advertise
extensively, he may have to accept the first offer
that comes along, even at some fraction of
his
asking price. In this case, the buyer would
have all the bargaining power and the seller
none.
Sometimes both buyers and suppliers have bargaining
power. In that situation it is likely that
the
industry in question has low profitability, the product
is viewed as a commodity, rivalry among
competitors is fierce, and innovation is
relatively low. On the other hand, if companies
in the
industry have more bargaining power than both buyers
and suppliers, the chances are that it is
profitable, the products and competitors are
differentiated and have strong brands, competition
is controlled as it is in monopolistic competition,
and innovation may be fairly rapid.
For another example of bargaining power,
consider the unfortunate predicament of a
California
tool manufacturer. About 90% of the company’s
production was going to one customer. Profit
margin was understandably low. One day the customer
demanded a price reduction of 10% and
CHAPTER 4Section 4.1 Industry and Competitive Analysis
delivery in small quantities at frequent intervals,
thus forcing the tool manufacturer to carryeven
more inventory and increase its costs. If the
company had not been so dependent on this one
cus-
tomer, it might have refused to supply it
but it could not. Instead, it got squeezed.
It’s not difficult
to tell who had the bargaining power here.
This example is true and, while unfortunate,
illustrates how shortsighted companies can be.
The
customer in this case did not appear to care that it
might driveone of its principal suppliers out of
business. Walmart is another example of a
company that, because of its size and influence
with
its customers, retains the bargaining power
when negotiating with its suppliers. It, too,
appears to
run many of its suppliers into the ground in its
drivefor ever-lower costs.
In contrast, Toyota and other companies practice
Kaizen, a system in which independent
suppliers
sign long-term agreements with the manufacturer,
practically collocate with the manufacturer,
earn fair profits, and are given help and training to
supply products and parts at the desired level
of quality and delivery.
If a company has many suppliers all competing
for the contract to supply it, the company
has bar-
gaining power. If it has to purchase a
component, however, and only one company can
supply it,
that supplier will have bargaining power. One
strategy that suppliers have for retaining bargaining
power is to raise the switching costs of the buyer,
that is, make it so expensive for a buyer
to switch
to a competing supplier that it will not do
so. Consider a supplier that provides its
customer’s pro-
curement staff with computer terminals that are tied in
with its own system, enabling the customer
to order at any time, track the status of
delivery of any order, and so on. The service
could be so
convenient, and the purchasing company’s people
so well trained and comfortable in using
the
ordering system, that it might not change
suppliers even if a lower-cost competitor
came along.
Porter’s Five-Forces Model
In 1980, Michael E. Porter of the Harvard
Business School developed what is probably the
most
influential tool for assessing the structure and
competitive threats of an industry. Porter
proposed a
framework that in a given industry, five forces
determine the degree of competitiveness in
that indus-
try. Competitiveness, in turn establishes the
attractiveness or profitability of the industry.
This model
can be used by organizations considering a wide
range of strategic plans, including entry into
the
industry and beyond. The five forces described by
Porter are
• Rivalry among existing competitors
• Bargaining power of buyers
• Bargaining power of suppliers
• Threat of new entrants
• Threat of substitutes
Figure 4.1 depicts Porter’s five-forces model in
diagrammatic form. The five main boxes in
the shape
of a crossconstitute the actual model. The four
“analysis” boxes in each corner add meaning to
the
model and enhance the industry analysis.
In the model, the terms buyers and suppliers
are self-evident; these are the customers of the
industry and
the firms that supply the raw materials, respectively.
Rivals are all of the companies presently
competing
in the industry. New entrants are firms not
currently engaged in the industry but which
could potentially
compete in the future. For example, British
supermarket chain Tesco PLC entered the
U.S. grocery indus-
try in 2007 under the brand Fresh and Easy,
with an aggressive growth plan, concentrating
primarily on
the Southwest states. Although Tesco did not open
Fresh and Easy locations in all U.S. markets, or
even in
all Southwestern communities, existing grocers were
wise to be aware of the Fresh and Easy
threat.
(continued)
CHAPTER 4Section 4.1 Industry and Competitive Analysis
Substitutes are products in other industries that have
the potential to draw customers awayand
are, in effect, also competitors. The concept of
substitutes is sometimes hard to grasp;
accordingly,
the following example may help. The founder of a
for-profit theater company in a moderately
sized
California town believed he had no competition as
there was no other theater company in the town.
Yet when his season tickets went on sale in
the fall, they did not sell out. In fact, far from
selling out,
many tickets remained unsold all season long.
He remained puzzled by this until someone asked
him
what a person in the town could do with $20 on
a Friday or Saturday night. Well, he
replied, that per-
son could go to the movies, out to dinner,
watch TV, go for a walk, go to a
ballgame, go shopping, or
visit with friends, among many other options. It
turned out that “going to the theater” ranked
quite
low on this list, accounting for the dearth of
ticket sales. This impressed on the theater
owner that his
real competition came from substitutes.
To perform an industry analysis for a particular
company using Porter’s model, one would
begin by
listing the company name as well as those of
its principal competitors in the Rivals box.
Next, writea
description of the buyers and suppliers of the
industry (not the company under study) in
the respec-
tive boxes. Be careful not to list distributors or
retail channels as buyers, even though they
may
purchase the products for resale. Porter intended
that buyers for companies that make frames
for
glasses be listed as people, not optometrists.
The names of any firms that could
possibly enter the
industry are entered in the New Entrants box. If no
potential new entrants can be identified, the
box
should be marked “unknown.” Finally any
substitutes to what the industry produces are
written in
the box so labeled.
Once the five boxes have been filled in on the
model, then writea brief assessment of the
intensity
of rivalry (low, medium, or high, and why),
bargaining power of buyers and suppliers
(low, medium,
or high, and why), entry barriers (low, medium, or
high, and what they are), and threat of substitutes
(low, medium, or high, and why) in each of the
corner analysis boxes.
Porter’s model provides a clear, straightforward
way to assess the nature of competition in
any indus-
try. Users should take care not to be misled by
the seemingly simplistic nature of this tool.
Strategic
thinkers must be thorough and wide-ranging in their
thinking when analyzing each element within
the context of their business, industry, and
environment. As the theatre owner’s case
illustrates,
shortsighted or narrow thinking may lead to an
inaccurate assessment of the elements and poten-
tially negative implications for profit, public
relations, employee morale, and more.
Threat of
Entrant
Power of
Buyer
Power of
Supplier
Competitive
Rivalry
Threat of
Substitutes
Figure 4.1: Porter’s Five-Forces Model
Source: Adapted from Alexander Osterwalder and Yves Pigneur,
Business Model Generation: A Handbook
for Visionaries, Game Changers, p. 99.Copyright © 2010 John
Wiley & Sons. Reprinted with permission.
llepera
Typewritten Text
llepera
Typewritten Text
llepera
Typewritten Text
llepera
Typewritten Text
CHAPTER 4Section 4.1 Industry and Competitive Analysis
Barriers to Entry
High entry barriers keep potential entrants out of an
industry. This is a good thing for a company
that is already in the industry, but a bad thing
for a company trying to enter the industry.
Barriers
to entry could take any of several forms. An
industry that requires a significant capital
invest-
ment to enter has a high barrier to entry,
particularly to smaller firms. Another type of
barrier
is the need for expertise in a certain technology
or manufacturing process, a core competence,
or proprietary technology, which could cost a
lot or take a long time to develop. Electronics
and
biotechnology industries have this barrier. An established
brand name and customer loyalty, both
of which take time to develop, may also provide a
deterrent to would-be entrants. When an
industry includes competitors with significant market
share and market power or competitors
with low costs that realize significant economies of
scale, prospective entrants would probably
view this as a barrier.
What if the potential entrant is a much
larger corporation with more than adequate
financial
resources and possibly also a strong brand identity
in a related market? The results of this
assess-
ment might turn out quite differently. The issue is to
try to imagine (a) who the likely potential
entrant might be; (b) why it might want to
enter this industry now; and (c) make as best an
assess-
ment as you can. What is perceived by one firm to
be a high barrier to entry may not present a
deterrent to another.
Also, in some industries it may be easy to enter
the industry but difficult to compete effectively
on a national or global scale once having
entered. For example, in the donut industry,
anyone can
open a single donut shop that serves local
customers (“easy to enter”). Yet such an entrant
would
unlikely compete with the large national chains like
Dunkin Donuts, Winchell’s, and Krispy Kreme,
and so would not present a threat at all
(“hard to compete with”).
Industry Concentration
A concentrated industry is one in
which a few firms in the industry
account for a large portion of total
industry sales. Examples are com-
mercial aircraft manufacturing,
in which only two firms compete
(Boeing and Airbus), or the busi-
ness of auditing public companies in
the United States, in which 96% of
the work is shared among the “Big
Four” certified public accounting
(CPA) firms. Even six to eight firms,
accounting for upwards of 40% of
an industry’s sales, would qualify to
be called concentrated.
A fragmented industry is one in
which no one firm has more than a
fraction of a percent in market share.
Examples are beauty salons and the
Inga Ivanova/iStock/Thinkstock
Beauty salons are an example of a fragmented industry.
CHAPTER 4Section 4.1 Industry and Competitive Analysis
auditing of privately held businesses. Bookstores
and fast-food restaurants used to be fragmented
industries, but now are fairly concentrated due to
franchising and the emergence of dominant
chains.
For a company in a fragmented industry, it is
difficult to increase market share unless
you clone or
standardize the business and duplicate or franchise it
(Porter, 1982). This is what some fast-food
companies did and what enabled them to become
global giants such as McDonald’s, KFC,
Burger
King, and so on.
Critical Success Factors
When a potential company is assessing an
industry, it often needs to identify the
industry’s critical
success factors (CSFs). Think of them as constituting
the rules of the industry. Just as every sport
has its own set of unique rules, there is no
way that one can “play” in an industry, let
alone domi-
nate it, without knowing and playing by those
rules. CSFs attach to an industry, not to
a company,
and every industry has a different set. Ideally, a
firm should be able to identify six to eight
CSFs.
One way is to come up with a much larger
number first and then edit them down to those
that are
really essential to succeeding in its particular
industry.
The value of identifying the industry’s critical
success factors becomes evident when they
are used
to compare a company with its key competitors. A
CSF analysis allows a company to compare
itself
against its principal competitors using CSFs as
the dimensions to do so (Table 4.1).
After choosing six appropriate CSFs for the
industry, the example company was rated along
the
dimensions of the listed CSFs on a scale of
0–10, 10 being highest. The same was done
for each
competitor in the table.
Table 4.1: Critical-success-factor analysis
Critical-Success Factor Company Competitor A Competitor B
Competitor C Competitor D
Strength of brand 10 8 9 8 10
Distribution channels 6 10 9 8 7
New-product
development
8 5 10 7 8
Financial strength 9 6 10 8 9
Customer service 8 7 8 9 5
Low costs 5 6 5 6 9
Totals 46 39 51 46 48
In the example shown, the company under
analysis rated a total of 46 out of a
possible 60. Com-
paring the scores gives a rough idea of
how the company “stacks up” against its
competitors, as
well as how each of the key competitors stacks up
against the others. To the extent that your
ratings of a company and those of its
competitors are accurate or realistic, the
analysis provides
useful information regarding whether or not the
company has competitive advantages or vulner-
abilities and which competitors are most dangerous.
CHAPTER 4Section 4.1 Industry and Competitive Analysis
Looking across the rows, the table reveals where
there may be a competitive advantage or com-
petitive vulnerability. In this example, the company’s
strong brand may constitute a competitive
advantage. Competitor A may have one in its
extensive distribution system, and Competitor B
one
in its ability to generate new products rapidly.
Any rating of 5 in the table would signify
a competi-
tive vulnerability, something that should be addressed in
that company’s short-term plans (like the
company’s and Competitor B’s costs).
Looking down the columns, the analysis identifies
which competitors are more dangerous than
others. In the table, judging from the totals at
the bottom, the company lies in the middle of
the
pack, with Competitors B and D to be more
feared than the other two competitors. Competitive
analysis includes how the company might react to
attacks, especially from strong competitors
(Coyne & Horn, 2009).
Industry Attractiveness
Can one measure industry “attractiveness,” and is it
important? The answers to these questions
are yes and yes, but the measurement is highly
subjective and the result is more useful in
some
situations than others. Industry attractiveness is based
on of a number of attributes or charac-
teristics. To discover them, imagine what an ideal
industry would look like. It would have,
for
example, a huge market (potential customer base), be
growing rapidly, be hugely profitable, have
few competitors, be unregulated, have high entry
barriers, and require no need for technological
expertise that the company could not handle. This
would yield the following initial list of factors
for an industry-attractiveness analysis:
• Size of the potential market
• Industry growth rate
• Intensity of competition
• Degree of regulation
• Entry barriers
• Degree of technological innovation
These factors, of course, constitute an
incomplete list; they may be changed or amplified.
Notice also that the factors are stated in a
neutral way: “size of the potential market,” not
“large market.”
To perform an industry-attractiveness analysis, first
assign a weight to each of these factors as
a
percentage according to their perceived importance.
Next rate each factor from the point of view
of the company doing the analysis on a scale of
0–1.0. Finally, multiply the weight by the
rating for
each factor. Be careful in two instances: (a) If
degree of competition is high, the rating
should be
low because it makes the industry less attractive,
and (b) if degree of regulation is low, the
rating
should be high as it makes the industry more
attractive. Remember that the rating should be
high
for any factor that makes the industry more
attractive, and low if the opposite. Add up the
prod-
ucts to yield a percentage figure.
Table 4.2 below shows an industry-attractive
matrix, which is a weighted technique based on
a num-
ber of factors to determine how attractive an
industry is. The industry-attractiveness (I.A.) index of
75.6 shows this to be an attractive industry,
attractive enough to stay in it and invest in
improving
the company’s position. When such an analysis
yields a result of less than 50%, then the
company
might well ask the fateful question, “Should we
continue to be in this industry, or should
we exit?”
CHAPTER 4Section 4.1 Industry and Competitive Analysis
Strategic-Group Map
In industries that contain disparate competitors, a
strategic-group map is a useful technique to
cluster and identify strategically similar
competitors. Competitors can show differences—and
similarities—to each other on various factors (Porter,
1982). Those that are similar to each other
belong to the same strategic group; the more distant
one strategic group is from another reflects
the extent to which they are dissimilar and hence
not direct competitors.
An industry often consists of a small number of
distinct
strategic groups. A strategic-group map is a two-
dimen-
sional representation of an industry’s strategic groups.
To create one, choose two strategic dimensions
that are
not correlated with each other, as are price and qual-
ity, and that have the capacity to separate the
com-
petitors in the industry. For example, if all
companies
in the industry have broad product lines,
choosing this
dimension as one of the axes will not work—all the
com-
petitors would be bunched up at one end. On
the other
hand, positioning might be a useful
dimension to use if
there are some companies at the high end, some at
the
midlevel, and some at the low end of the industry.
Other
than the two guidelines given previously, there is no
rule
for choosing strategic dimensions that would serve
as
axes for the strategic-group map. The dimensions cho-
sen as axes for a strategic-group map should embody
strategic variables, not performance. Try several
and
see which two separate the competitors or rivals
into
clusters on the map. When you have several
clusters
that make sense and can articulate the strategy of
each
cluster, you have a useful strategic-group map.
Naturally,
using the technique presupposes a good working
knowl-
edge of competitors in a particular industry.
Figures 4.2 and 4.3 show examples of strategic-group
maps. Figure 4.2 is a simple strategic-
group
map that represents the pharmaceutical industry.
Figure 4.3 shows a slightly more complex
Daniel Acker/Bloomberg via Getty Images
Budweiser is in the same strategic group as
Miller Brewing company, but in a different
group than microbrewers.
Table 4.2: Industry-attractiveness matrix
Factor Weight Rating Product
Industry growth rate 24 0.8 19.2
Profitability 20 0.7 14.0
Size of potential market 18 1.0 18.0
Intensity of competition 16 0.3 4.8
Entry barriers 12 0.8 9.6
Degree of regulation 10 1.0 10.0
Totals 100 I.A. Index 75.6
CHAPTER 4Section 4.1 Industry and Competitive Analysis
strategic-group map of selected retail chains. The
figures display different strategic dimensions in
use and underscore the fact that companies in
the same strategic group compete more intensely
with each other, while competition between distant
groups is virtually nonexistent.
Low
High
P
ri
ce
s
C
h
a
rg
e
d
R&D Spending High
Generic Group
Teva
Mylan Labs
Watson Pharma
Greenstone
Proprietary
Group
Valeant Pharm.
Merck
Pfizer
Lilly
Figure 4.2: Simple strategic-group map of the
pharmaceutical industry
Few
Locations
High
Geographic Coverage Many
Locations
Low High
P
ri
ce
/Q
u
a
lit
y
Neiman-
Marcus,
Saks Fifth
Ave
Macy’s,
Nordstrom,
Dillard’s
Ralph
Lauren
Gucci, Chanel, ect.
Gap
TJ
Max
Walmart,
Kmart
Target
Figure 4.3: Strategic-group map of selected retail chains
Source: Adapted from Arthur A. Thompson, Jr., John E.
Gamble, and A. J Strickland III,
Strategy: Core Concepts, Analytical Tools, Readings, p. 68.
Copyright © 2004 Irwin McGraw-Hill.
Reprinted with permission.
Source: Charles W. L. Hill and Gareth R. Jones, Strategic
Management: An Integrated
Approach, 10th ed., p. 96. Copyright © 2013 Cengage Learning.
Reprinted by permission.
CHAPTER 4Section 4.1 Industry and Competitive Analysis
What can be learned from a strategic-group map?
First, the companies in a particular
strategic
group are strategically similar and constitute the
group’s key competitors. Those in a nearby
group
form the next tier of competitors. In all likelihood,
companies in a distant strategic group
are not
really competitors although they are in the same
industry. For example, in the U.S. beer industry,
Anheuser Busch competes with Miller Brewing in
the same strategic group, but not with the many
microbrewers and some of the imported high-end beers,
which are in distant strategic groups. In
another example, this time in the hospitality
industry, Days Inn (low end) does not compete with
Ritz Carlton (high end) because they are strategically
dissimilar and in different strategic groups;
their markets are quite different.
Secondly, the implications of Porter’s five-forces
model are different for different strategic groups.
Entry barriers vary among the groups, as do
bargaining power with suppliers and customers,
the
threat of substitutes, and the intensity of intra-
group rivalry. Thus, it could be more
desirable to
be in one strategic group than another (there
could be more opportunities and fewer threats)
(Hill
& Jones, 2001). For example, in retailing, a
recession would adversely affect high-end
department
stores but actually increase demand for discounters
and mass merchandisers. Because of such
differences, it may be worthwhile for a
company to move consciously from one
strategic group to
another. The ease of doing so depends on the
size of mobility barriers between the groups
(fac-
tors that inhibit both entry into and exit from a group).
For example, in Figure 4.2, Greenstone is
a generic pharmaceutical company that competes with
others in its strategic group; it would
find
it very difficult to move into the proprietary
strategic group with companies like Valeant
Pharma-
ceutical and Merck. This is because Greenstone
lacks the necessary R&D skills and resources that
would take time and a great deal of capital to
acquire.
Thirdly, one could discover some unserved demand in
an area of a strategic-group map not occu-
pied by any strategic group. In creating a
strategic-group map of the automobile industry,
using
pricing and safety as the two strategic dimensions,
a group of business students found that no
company was offering a low-priced, high-safety
automobile. Such a car might appeal to
parents
with teenagers and possibly olderdrivers (Harrison, 2003).
Finally, it is possible for a company to belong
to more
than one strategic group. In the hospitality indus-
try, Hilton Hotels and Marriott compete in both
the
high end and affordable ends, through the lower-rate
Hampton Inns and Courtyards by Marriott respec-
tively. In this illustration, each company, rather
than
surmount mobility barriers by moving to another
stra-
tegic group, has penetrated another strategic group
through internal diversification and acquisition.
Competitive Analysis
Strategy began as a military concept. Before
going into
battle, and during the battle itself, generals
would try
to find out everything they could about the
enemy:
their strength in numbers, their weaponry, supplies,
communications capability, precise locations, intents,
and strategies. To go into a battle with no
information
Zefa/SuperStock
Knowing as much about your competitors
as possible is imperative.
CHAPTER 4Section 4.1 Industry and Competitive Analysis
about the enemy would be to put an army at
considerable risk and its chances of success at
vir-
tually zero. It is only with good intelligence about
the enemy—their movements, resources, and
strategies—that a general or leader can plan
strategy and deploy resources to win the battle
or
achieve a military objective.
The same imperative exists in business today. In
virtually every business, companies must be
aware of and know how to deal with their
competitors. The first step is to ask, “How
much do I
know about my competitors?” One should know—
or try to obtain—at least the following informa-
tion about one’s competitors:
• Market share—Many industries have publications
that track these data, but companies
will occasionally have to determine a competitor’s
market, or industry, share on their own.
• Geographic scope—Are your competitors local,
regional, national, or international/global
competitors?
• Diversification—Are your competitors
conglomerates with a portfolio of businesses in
unrelated industries, companies with many related
businesses, companies with many
strategic alliances, or companies in only one
business?
• Vertical integration—The degree to which
competitors are vertically integrated, especially
backwards along the supply chain, may give
them cost and competitive advantages that
can be difficult to overcome.
• Competitive advantage—Do your competitors possess
a competitive advantage? What is
it? How large is it? How have they sustained it?
• Core competence—What are the core competences
that underlie your competitors’
strategies?
• Strategic intent—How are your competitors trying
to position themselves in the industry?
Are they aggressively trying to overtake rivals on
their way to market dominance, or are
they more concerned with defending their ranking and
maintaining market share?
• Strategy—What strategies are your competitors
following? In most cases, they can be
inferred from other information known about the
companies and what they are actually
doing. Have the strategies been working, or are they
about to be changed? Are mergers
among key competitors likely? Are any of them
looking to be acquired? If in a high-tech
industry, what is their investment in R&D as a
percent of sales?
• Resources and capabilities—How strong financially
and technologically are each of your
competitors? How flexible are they to adapting to
the changing environment? How well
managed? How fast do they bring new products to
market? Do they have innovative cul-
tures and a record of innovation? Which one
just got a new CEO?
Trying to get this kind of information about
key competitors also reveals how much or
how little a
company knows about them.
Discussion Questions
1. What additional information might an
industry analysis give that simply monitoring a
company’s
competitors does not? After all, isn’t the industry
just an aggregate of all competitors?
2. Porter’s five-forces model is a useful
tool to analyze the competitive forces and
structural char-
acteristics of an industry. But isn’t this at best a
snapshot at a point in time? How could
one get a
more dynamic perspective?
(continued)
CHAPTER 4Section 4.2 Market Analysis
4.2 Market Analysis
We now turn to an examination of a company’s
customers, which could be companies in
another
industry, like the auto industry, or individual consumers.
A market analysis is an umbrella term
covering the collection and analysis of data and
information about a company’s customers,
which
could be companies in another industry or
individuals (consumers). While it is
relatively straight-
forward to get information about a customer
industry, getting useful information about
consum-
ers is more difficult. The demographic or
socioeconomic groups of some consumers make
them
harder to analyze and understand. It is
important to keep in mind the target market
and degree of
market penetration, changing customer needs, and
distribution channels and pricing, as discussed
in the following sections.
Target Market and Market
Penetration
First consider the target market.
For example, if banks buy your
product, your market is banks. But
are you targeting all banks world-
wide (which is the overall market),
only the large banks, only neigh-
borhood banks, only banks with
over $2.0 billion in deposits or over
500 branches, or middle-market
banks nationally? Very few com-
panies can target the entire popu-
lation of their markets although
© Fancy Collection / SuperStock
Getting specific information about your customers can be more
difficult than learning about the industry.
3. Suppose a company has very little bargaining
power with suppliers; in fact, its industry also is
plagued with weakbargaining power. What are
some ways of gaining more bargaining power?
4. What might be a method for identifying
an industry’s driving forces other than simply
brainstorming?
5. Can a company be more profitable in a
concentrated industry (not one of the industry
leaders) or
a fragmented one? Give your reasons either way.
6. The industry-attractiveness matrix is a highly
subjective exercise. So what are the benefits of
doing one despite the subjectivity?
7. A strategic-group map groups together strategically
similar companies in an industry on a
two-
dimensional space. Yet, movement from one strategic
group to another could experience mobil-
ity or entry barriers, different competitors, and
significant investment. Does that make each
stra-
tegic group an industry segment? Explain.
8. Once an industry’s dominant economic
characteristics and driving forces have been
identified
and Porter’s five-forces analysis has been performed,
how can the rules of the game for this
industry and the critical success factors be
discerned? Explain the steps this would take.
9. A critical-success-factor analysis can be very
useful to a company in analyzing how it
stacks up to its
competitors. How might you tell if the numbers
used in that analysis are realistic? Is there another
kind of analysis you could do that would also
yield good comparative data with your competitors?
CHAPTER 4Section 4.2 Market Analysis
there are exceptions such as Coca-Cola, Microsoft,
and so forth. So a company needs to
define its
target market—what is it, how large is it, and
how fast is it growing? It also must decide
who is the
served market, or that portion of the target market
that is either currently served by the
company
or its current focus.
Another factor to establish is the degree of
market penetration. How far have all the companies
in the industry penetrated the market? In other
words, what proportion of the target market
has
bought a product/service from your industry? If the
answer is 60%, the market is said to be
60%
penetrated, leaving 40% that is unserved or
underserved among them. When a market
is 100%
penetrated, it is considered saturated.
The degree of penetration is, however, more
complex than the illustration discussed here. For
example, not all of the target market may
purchase a product from the industry for various
rea-
sons—they cannot afford to, don’t need to,
and the like. So the target market is often
reduced to
what is called a served market made up of
viable customers who could buy the product or
service.
Also, though rare, it is possible for markets to
be more than 100% penetrated, as when
house-
holds own more than one TV or car.
Changing Customer Needs
What are customers’ current needs? From what is
known of a company’s customers and
industry,
can their needs be inferred? And can the degree to
which such needs are currently satisfied be
assessed? When we speak of “needs,” we mean
benefits or what we now term value propositions.
Companies that are constantly listening to their
customers will know their needs and how they
are
changing (Ulwick & Bettencourt, 2008).
What will the customer need in the future? This is
a chicken-and-egg situation. New products
and services often affect customers and satisfy needs
they never knew they had, and sometimes
unsatisfied needs are the spark that causes
new products and services to be introduced.
Try to
address the question How are customers’ needs
changing? To the extent that this proves diffi-
cult to answer, it indicates whether the company is
in touch with its customers or doesn’t know
enough about them.
Distribution Channels and Pricing
The next stage of the market analysis is a
consideration of the company’s distribution
channels.
This means learning how the industry’s products reach
the market. One must find out whether the
industry typically supplies products to wholesalers,
distributors or retail outlets. In some
industries
it is standard practice to employ salespersons to
make direct sales calls while in others
catalogs
and direct mail are the norm. The extent to
which the Internet is used as a distribution
channel is
increasingly important. Note any differences
between the distribution channels the company
uses
and those used by the industry in general.
Another way of looking at this is to ask
how customers
buy the products. What is the decision process
they go through before they decide to buy?
An analysis of the distribution channels would
not be complete without determining the size of
channel markups. That is, for each stage in the
distribution channel, what price is paid by the
whole-
saler, what price by the distributor, what price by
the retailer, and what price by the final customer?
If volume discounts are expected and offered at
each stage, the quantities at which these become
CHAPTER 4Section 4.2 Market Analysis
applicable and the amount of the discount are key
data points. While a company’s profits
depend
on the price it receives for the product, its
competitiveness depends on what the customer
will pay.
One also needs to establish the degree to which
customers are price-sensitive in the target mar-
ket. Price sensitivity is critical with respect to
how prices are set and changed and, indeed,
which
distribution channels are used. The following
example of the law firm illustrates the importance
of knowing how price-sensitive customers are (see Case
Study: PriceSensitivity and a Law Firm).
Any current trends in customer behavior are vital to
an understanding of how the target market
may be changing. Are customers buying differently?
Are they becoming more demanding? Any
other aspect of industry customers not covered
elsewhere should be covered here. For example,
increasingly, customers of brick-and-mortar bookstores
like Barnes & Noble are actually buying
their books on Amazon.com.
To the extent that a company does business in
several markets such as different countries, this
type of detailed market analysis should be
completed for each of those markets. Companies
that
target business customers (B2B) would do well to
analyze the value chain of their major
customers
in order to discover which part of it is
unserved and take advantage of the opportunity to
move in
to fill that need (Crain & Abraham, 2008).
Case Study
Price Sensitivity and a Law Firm
A patent-law firm once held a retreat to go
through a strategic-planning process. During
the process,
the partners in attendance maintained that it
was the best firm of its kind in the large
metropolitan
region it served. A review of its finances
revealed that its billings (i.e., sales) were flat, a
situation
that prompted the retreat in the first place. During
the competitive-analysis phase, the firm
acknowl-
edged that it had about five principal competitors,
all of which charged higher hourly rates
than it did.
Reluctantly, the partners finally admitted that hourly
rates generally correlated with reputation; the
higher the fee charged, the better the firm was
perceived to be. Worse, it turned out that
several of
the firm’s partners were offering discounted rates to
clients for fear that they would not even get
their
business. They expressed the fear that if they raised
their rates, the firm would suffer a drastic
decline
in business. They felt hamstrung. The answer, of
course, was that they were either serving the
wrong
kinds of clients, or they were not as good as
they claimed to be. The latter conclusion
was perhaps
closer to the truth given their discounting
behavior. Certainly, the market was not nearly as
price-sen-
sitive as they thought it was, as evidenced by
the fees its competitors were charging—and getting.
Discussion Questions
1. Why is defining your target market so
difficult? If you agree, suggest how it can be
made easier
and yield accurate results at the same time.
2. Is distinguishing between “market,” “target
market,” and “served market” useful? In what
ways?
3. How might you discover that your target
market would welcome opportunities to co-
create value
with your company?
CHAPTER 4Section 4.3 Environmental-Trend Analysis
4.3 Environmental-Trend Analysis
The almost dizzying pace of change going on in
technology and business requires companies to
plan differently than they have in the past. In order
to keep pace with the rapidly changing environ-
ment, companies should divide the environment
into categories or manageable pieces and, in
each
category, try to articulate (a) what is changing and in
which direction, and (b) with what impact on
the company. If the change has no relevance for
the company or for what it might do in
the future,
then it deserves to be ignored. If
a trend cannot be clearly defined
in terms of direction (for example,
something getting larger or smaller,
increasing or decreasing), then
it should be omitted. Saying, for
example, that the “economy is in a
recession” is not useful as a trend.
Environmental scanning is a com-
mon name given to identifying and
analyzing trends that are external to
the business (Fahey & Narayanan,
1986). People who engage in it have
found that it is easy to get caught up
in what they are discovering. Before
they know it, they are collecting
information for its own sake. Most
companies cannot afford that luxury. Again,
the search should be confined to trends
that are relevant
to the company, specifically any trend that affects
the company or that may affect it in the
future.
The currency of the collected data in environmental
scanning is a valuable resource. Typically, one
can find information on trends using historical
data. However, the milieu in which strategic
planning
takes place, or the period during which the
consequences of present decisions play out, is
the future.
Wavebreakmedia Ltd/Thinkstock
Analyzing environmental trends involves looking at what is
changing and its potential impact on the company.
4. What surveys would you take of your
customers that would help guide what products to
produce
and how to persuade them to buy?
5. If you were designing a customer-relationship-
management (CRM) system, what elements would
you include and why?
6. Why is it that customers of highly
differentiated companies are not that price-
sensitive?
7. Customers buy products because, for the most
part, the products satisfy their needs. (The excep-
tions are impulse buys.) Are “needs” and the
“benefits” they receive from using the product
the
same thing?
8. List the benefits you might experience from
buying each of the following:
A movie ticket
A logo t-shirt
A novel
A car
An iPod
A vacation cruise
Flowers for your spouse or date
CHAPTER 4Section 4.3 Environmental-Trend Analysis
A trend noticed during the 2004–2009 time frame,
for example, may have limited value or even
none
at all in the 2012–2017 time frame. However, if
the trend can be extrapolated or extended in a
justifi-
able manner to the future time frame in
question, then it becomes valuable. Nevertheless,
firms must
be cautious, because some trends are discontinuous,
meaning that behavior in the future is
different
from behavior in the past. While simple
extrapolations can be performed by almost anyone,
more
complex forecasting, such as technological forecasting,
must be done by an expert and may require
consulting assistance. For such projects, the
organization must have the requisite time and
resources.
The tradeoff between spending resources to do
something properly and taking educated guesses
when such resources are unavailable is something
that the company will have to consider carefully.
In many cases, rather than doing the
forecasting internally, a firm can find
estimated or projected
data on trends to fit its future time frame.
For example, demographic data taken from census
data
contain projections for at least 30 years into
the future. Whenever using such projections, it
is
important to know how reliable the source is
and, preferably, how the projections were
derived.
The more critical such data are to the company, the
more care the company should exercise to
ensure that reliable data and analyses are being
used. Economic forecasts, for example, are par-
ticularly difficult to verify as to quality;
economists can be wrong even for short-term
forecasts.
Finally, the environmental scan should cover a
geographic scope that matches the arena in
which the
company competes. For example, a distribution
company operating and competing only in New
Eng-
land should pay more attention to what is happening in
the New England economy rather than what
may be happening nationally. Figure 4.4, for
instance, shows the strategic group for the
wholesale
lumber industry. A large multinational company would
have to extend its scan into every country in
which it does business (buying, manufacturing, or
selling) as well as include exchange rates
between
those countries and how events or trends in
one of the countries might affect any of
the others. The
international environment is far more complex than
dealing with just one country. For example, man-
agers in each country are typically asked to
complete an environmental analysis in their own
country
along with other analyses and projections required
for strategic planning.
Wide
Product ScopeNarrow Wide
G
e
o
g
ra
p
h
ic
S
co
p
e
Regional
full-line
National
full-line
wholesalers
Regional
specialty
Local
specialty
Figure 4.4: Strategic group map of the wholesale
lumber industry
Source: Reprinted by permission from the Case Research
Journal, Copyright © 1992
by the North American Case Research Association and the
author.
CHAPTER 4Section 4.3 Environmental-Trend Analysis
When conducting an environmental-trend analysis,
there are seven common categories that the
company should consider: economic, regulatory/legislative,
political, demographic, sociocultural,
attitude/lifestyle, and technological. No one category is
more important than another per se,
though certain categories can be more relevant to a
particular company and so demand more of
its attention.
Economic Trends
Of the seven categories of trends, we are flooded
with opinions and doom-and-gloom prognosti-
cations about the economy the most. The news
media thrive on stories about how stocks
are being
buffeted by economic forecasts and events such as
bank bailouts or even bailouts of countries like
Greece recently. Unless one has a direct
financial stake, a lot of such news is just
“noise.” Economic
data look very different and can provide a more solid
feel as to how a country’s economy is faring
and how its currency is faring with respect to
the world’s major currencies, and hence
begin to
assess their effect on a company and its future.
Economists monitor a number of principal
indica-
tors to identify trends:
• “Structural shift” is a term that describes a
trend from an industrial economy to a service
economy, or from a predominantly manufacturing to a
knowledge-based economy.
• Structural variables are factors such as energy
costs rising faster than raw material costs,
or general or minimum wage rates changing.
• Inflation and unemployment rates have historically
tended to have an inverse relation-
ship; as one goes up, the other typically goes down,
and vice versa. Both are affected by
fiscal policy controlled by the government and
monetary policy controlled by the Federal
Reserve Board, which also controls interest rates.
• Interest rates are the most watched economic
indicator. These reflect the cost of loans,
mortgages, and credit, as well as how much
savings and certificates of deposit (CDs)
can earn.
• The consumer price index (CPI) is a relative
indicator of how far and how fast prices have
risen compared to a base year.
• Housing starts are a leading indicator of
whether the economy might turn down or
up.
• Balance of trade is the net difference in value
between a country’s exports and imports. A
positive figure reflects a trade surplus while a
negative figure indicates a trade deficit. The
United States has for decades run an annual
trade deficit.
• Exchange rates reflect the value of one
country’s currency against another. A declining
value of the U.S. dollar, for example, means
that U.S. exports will be more competitive in
world markets and imports more expensive, while
a rising value of the dollar means
that
imports will become cheaper and U.S. goods in
world markets more expensive.
• Personal disposable income is often associated
with income data (demographic) and very
useful when combined with demographic data such as
geographic data, age, and ethnicity.
Regulatory/Legislative Trends
Regulations differ from laws in that they are made
and enforced by city, state, and federal regula-
tory agencies whereas legislation refers to laws
enacted by state assemblies and Congress. For
both
laws and regulations, indications of impending
changes can be discerned by closeobservation of
the political process at the appropriate level of
government. Also, rules are made according to
well-
defined processes that include opportunities for
rebuttals by industry or interested parties.
CHAPTER 4Section 4.3 Environmental-Trend Analysis
• The volume of regulations enacted each year
keeps increasing as reflected in the number
of pages in the Federal Register devoted to
them.
• It behooves a company to monitor potential
changes to regulations governing the indus-
try in which it competes. Some industries,
such as railroads and airlines, are so heavily
regulated that they are called “regulated industries.”
• Many regulations cut across all industries.
Examples of these include tax regulations,
workplace safety, insider trading, bargaining in
good faith in labornegotiations, anticom-
petitive practices, and price-fixing. All industries
encounter some form of regulation, even
those not considered “regulated.”
• Deregulation of an industry can have an
enormous impact. Examples of deregulated
industries are telecommunications and electric power.
Other industries such as airlines,
banking, and transportation have seen a degree of
deregulation.
• The merging of industries can have enormous
implications for companies in each. An
example of this trend has been the convergence of
the banking, insurance, and brokerage
industries into what is now called financial services.
• The standards set by regulation in an industry
may change. In the automobile industry, for
example, this can be seen in the standards for crash
resistance, fuel economy, and exhaust
emissions. Other industries are affected by
environmental standards for allowable con-
centrations of contaminants or impurities in air
and water. Labeling requirements on all
packaged and processed foods is another such
example.
• Trade regulations at the international level
may impose tariffs or set quotas to limit
imports into a country or make imported goods
more costly. Regulations may also prohibit
the importation of certain agricultural products or
require the quarantining of animals to
prevent diseases or invasive species from entering
the country.
• All the preceding regulatory trends affecting an
industry may occur at both state and fed-
eral levels as well as in many foreign
countries.
Political Trends
Politics is not just for politicians. Politics is
about power and the powerless and actions
and activi-
ties people take to redress perceived inequities.
The “Occupy” movement that spread from Wall
St. to Main Street in many cities across
the country is a stunning example of this.
Such trends
could have a significant effect on some
companies and their perceived public reputation.
• The relative influence and power of interest
groups in every sphere of economic and
social activity in the United States is a
matter of growing debate. From professional
orga-
nizations such as the American Medical Association, to
industry groups like the National
Association of Manufacturers and demographic
collectives exemplified by the American
Association of Retired Persons (AARP), interest
groups are more organized and more influ-
ential than ever before. The term lobbyist is in
some circles used as a pejorative giving
some indication of the controversial nature of this
trend.
• Fighting against or demanding enforcement of
regulations or laws is a trend observed in
the nation’s courtrooms.
• The United States has always been a highly
litigious society and that trend is only increasing.
Demographic Trends
This category is important only to companies that
market directly to consumers. Because many
companies’ products are targeted specifically at
demographic groups, monitoring trends in
this
CHAPTER 4Section 4.3 Environmental-Trend Analysis
category is imperative. Demographic trends are by
definition concerned with groups identifiable by
specific common characteristics such as age, gender,
income, national heritage, and many others.
• A country’s population growth (or decline) is
a demographic trend with implications for
most industries.
• The growth rate of a particular age group
such as the 25–39 or over-65 age group,
gives
clues as to whether the population of a country
is aging or getting younger, or has a
“demographic bulge” moving through it.
• The geographic distribution of population
reveals migration patterns affecting local markets.
• Significant trends concerning gender,
particularly gender differences, or in
conjunction
with one or more other demographic characteristics such as
age, ethnicity, education,
income levels, and others have critical strategic
implications in a wide range of industries.
• Changes in ethnic mix reveal the extent to
which regions or cities are growing more
diverse
or becoming dominated by one ethnicity.
• Data on income levels show patterns of
wealth distribution and indicate relative
purchas-
ing power, especially in combination with geographic
data concerning average individual
income and household income.
• Literacy rates reflect the extent to which a
population has received basiceducation and
can read its own language.
Attitude/Lifestyle Trends
This category of trends also concerns only companies
targeting consumers. These shed light on
how people live—their patterns of living—making
the trends highly interrelated with one another
as well as with demographic information. These
are also an outward manifestation of people’s
attitudes and values.
• Household formation includes the family
structure one chooses to establish such as mar-
ried-couple families, one-parent families with either
female or male head of household,
couples with no children, and gay or lesbian
couples. Also of interest is the average num-
ber of persons per household.
• Trends in the type of work and who is
working are important to consumer-oriented indus-
tries.For example, the rise of women in the
workforce, especially in professional and
technical jobs, and the increase of two-income
households have had a tremendous effect
on spending patterns and the types of products
brought to market. Similarly the tendency
of more elderly people delaying retirement and
continuing to work is a growing trend.
• Trends in the type and level of education
achieved are significant, particularly when
the
data are combined with ethnicity, race, and sex demographic
variables.
• Companies producing for consumers need to be
aware of changes in the consumption pat-
terns of goods and services, especially homes, durable
goods, furnishings, automobiles,
clothes, beverages, and personal services and shifts
in patterns within each category.
• Consumer choices with respect to leisure
activities are constantly changing. This includes
all types of sports and physical-fitness
activities, cultural events, movie attendance,
travel,
and home-centered activities such as watching network
and cable television and videos,
reading, gardening—anything people choose to do
in their free time.
Sociocultural Trends
This category focuses on broader changes in society
and the extant culture and becomes impor-
tant only if societal or cultural changes might
affect the business. For example, producing a
movie
CHAPTER 4Section 4.3 Environmental-Trend Analysis
that may not be suitable for young people and
therefore is rated NC-17, could in turn
translate to
lower revenues at the box office.
• Changes in social regulations—such as increases in
consumer and environmental protec-
tion, changes in Supreme Court rulings, trend of
the courts deciding issues that the politi-
cal process cannot.
• Changing social expectations are constantly in
flux. Businesses need to be aware of and
prepared to respond to evolving consumer values
across a wide range of issues. Examples
include changing attitudes toward work, rising
consumer demands, greater acceptance of
sex and violence in popular culture, a growing
emphasis on personal health and physical
fitness, and increasing activism among women and
minority groups.
• Changes in economic values have come to
the fore recently, most evident in the genesis of
the Tea Party and Occupy movements. Many
people have expressed increasing concern with
how economic benefits are distributed in society
and how people are taxed. It can be argued
that there is less acceptance of economic growth
today as an unqualified benefit to society.
• Changes in political priorities affect entire
industries and even regions of the country. For
example, choices made between defense versus
nondefense appropriations will be of tre-
mendous concern to any business that supplies the
military or is located in regions where
aerospace contractors or military bases are located.
Technological Trends
This category covers the entire swath of
technology, from new energy sources,
communication
technologies, health care modalities and cures,
food, agriculture, product and process innova-
tions, and so on. Clearly, high-tech or technology-
based companies must be current on technolog-
ical developments in their fields and how those
advances affect people, businesses, and society.
In rapidly changing fields, it is possible to
detect early signs of new technologies by going
to pro-
fessional-society meetings and listening to
presentations on new processes and techniques,
which
often precede their introduction by several years.
• The pace of change of basicscience or
research is manifest in the number and nature
of
new patents applied for and issued.
• The number and location of new companies
formed to exploit new technologies and
products based on new technologies are indicators of
technology trends.
• Changes in the average percentage of sales
spent on research and development (R&D) in
a particular high-technology industry and for
particular competitors, if publicly held are
critical trends for companies to monitor.
• Trends in technology diffusion describe
changes in the time required for a new
technology
to become accepted in general use.
• Innovation lag indicates the period between
when the scientific solution to a technologi-
cal need is first recognized and the emergence of
the first viable product using the solu-
tion technology and its successor.
A careful analysis of all relevant environmental
trends will provide a company with an
indication
of strategic opportunities, that is, trends that might
have a strong positive impact on the
company,
and looming threats or trends that might have a
strong negative impact on the company. Envi-
ronmental scanning should not be limited only to
the period immediately preceding a strategic-
planning session. Ideally, environmental scanning should
be an ongoing, year-round activity done
CHAPTER 4Summary
by many people throughout the organization. If
done year-round, it would be unlikely that
the
company would be blindsided by any changes in
its environment—and it would also be one of
the
first to notice opportunities as they arise. This
last point is worth emphasizing, because the
earlier
an opportunity is noticed, the more lead time the
company would have to exploit it.
Clearly, trends that have an immediate impact
within the planning horizon—whether the impact
is positive or negative—should receive the greatest
attention. Trends that require a longer time to
affect the company beyond the planning horizon
are correspondingly less important but should
nevertheless be monitored. Trends that have
no impact on the company should be ignored.
Summary
This chapter explored the importance of and tools to
help in analyzing a company’s external envi-
ronment—its industry, competitors, markets, and general
environment.
Several useful tools for doing an industry and
competitive analysis were presented and discussed,
including Porter’s five-forces model, industry-
attractiveness matrix, strategic-group maps, and
critical-success-factor analysis. In addition, identifying
the industry’s dominant economic charac-
teristics and driving forces add to one’s
knowledge about the industry and how it
might be chang-
ing—critical knowledge when deciding what
strategy to pursue.
Discussion Questions
1. Which environmental categories most need scanning if
your company:
Produces cell phones?
Is a mass merchandiser?
Produces steel tubing?
Supplies lumber for the construction industry?
Is a four-year university?
Publishes books?
Sells nutritional supplements online?
2. List some sources of information for each
category of environmental scanning.
3. We know why environmental scanning is
considered part of strategic planning, but why is
it part
of strategic thinking?
4. Economic and demographic data are often
quantitative, which makes it easier to
identify trends
and their impact on the company. But attitude and
lifestyle and sociocultural trends are “soft,”
subjective, and elusive. How can one understand
better what’s going on in these areas?
5. Scanning the technological environment is
difficult for anyone but scientists or engineers in
the field. Realizing what’s happening today in
this environment is too late, because develop-
ing technology takes years. How can one find out
now what might be developing several years
from now?
6. Assessing threats is a critical part of an
external analysis that should precede, or be a
part of, the
strategic-planning process. But the world is not
“convenient” in this respect. Forces that may
adversely affect the company are constantly changing.
How can a company monitor these so that
it is never caught unawares?
7. What happens when threats are
underestimated? Whose fault is it? Discuss.
CHAPTER 4Summary
An industry sells its products or services to
customers, so a key part of the external
analysis
is finding out all one can about a company’s
customers (market). Included in a market analy-
sis is distinguishing between a market, target
market, and served market (which could be
a
niche), determining the size of it and whether it
is growing (not to be confused with industry
growth rate), how far the market is penetrated,
what customers’ needs are and whether these
are changing, the distribution channels used,
whether the market is price-sensitive, and any
relevant trends, for example, in buying habits.
The chapter then provides a discussion and
pointers to scan the general environment for
any
changes or trends that might favor
(opportunities) or adversely affect (threats) the
company. The
general environment includes seven categories,
not all of which are relevant to any one
company:
economic, regulatory/legislative, political/legal,
demographic, attitude/lifestyle, sociocultural,
and technological.
Key Terms
bargaining power An ability to dictate the
terms—price, delivery, quality, and the like—in
a trading negotiation.
concentrated industry One in which a few
firms in the industry account for a large por-
tion of total industry sales (opposite of frag-
mented industry).
critical success factors (CSFs) What a company
must do well in order to succeed in the indus-
try; however, they attach to an industry, not a
company (think of them as constituting “rules
of the industry”).
distribution channel How a product finally
reaches the customer (can include directly via
salespeople, wholesalers, distributors, retail-
ers, mail order, and the Internet).
driving forces Trends responsible for how an
industry is changing.
entry barriers Factors that could, if sufficiently
high (like capital required, distribution chan-
nels, brand reputation, technological know-
how, etc.), prevent a company from entering
an industry.
fragmented industry One in which no one firm
has more than a fraction of a percent in mar-
ket share (opposite of concentrated industry).
industry attractiveness matrix A weighted
technique based on a number of factors to
determine how attractive an industry is.
industry attractiveness (I.A.) index The final
result achieved from using the industry-
attractiveness matrix, usually expressed as a
percentage.
market analysis An umbrella term covering the
collection and analysis of data and information
about a company’s customers, which could
be
companies in another industry or individuals
(consumers).
market penetration The proportion of a mar-
ket that has bought a product/service from
the industry (can vary from 0 for a brand new
market to 100% and beyond, as when people
own more than one car or TV).
Porter’s five-forces model An analytical tool
developed by and named after Michael E.
Porter to assess the five sources of competi-
tive threat extant in an industry and causes of
industry profitability.
price sensitivity How sensitive buyers are
to variations in price. If a slight drop in
price
causes customers to buy, they are very price-
sensitive; if price goes up a lot and customers
still buy, they are not at all price-sensitive.
CHAPTER 4Summary
served market That portion of the target mar-
ket that is currently served by the company or
is the focus of the company.
strategic-group map A technique to cluster, in
a two-dimensional space, strategically similar
competitors in industries, especially useful
when industries contain disparate competitors.
target market The group of customers tar-
geted by a company (could be companies or
consumers, domestic or international).
GETTING STARTED WITH MERGENTACCESSING MERGENT1 Go to t

More Related Content

Similar to GETTING STARTED WITH MERGENTACCESSING MERGENT1 Go to t

EnvironmentalScanning.pptx
EnvironmentalScanning.pptxEnvironmentalScanning.pptx
EnvironmentalScanning.pptxBaeXuKai
 
Conducting an industry analysis
Conducting an industry analysisConducting an industry analysis
Conducting an industry analysisHanish Sharma
 
Business Research
Business ResearchBusiness Research
Business ResearchChris Mobbs
 
Media Management 2011-Strategy Module - Jan 21_2
Media Management 2011-Strategy Module - Jan 21_2Media Management 2011-Strategy Module - Jan 21_2
Media Management 2011-Strategy Module - Jan 21_2Robin Teigland
 
HOW INDUSTRIES CHANGE- case study...pptx
HOW INDUSTRIES CHANGE- case study...pptxHOW INDUSTRIES CHANGE- case study...pptx
HOW INDUSTRIES CHANGE- case study...pptxAseesdeep1
 
INDUSTRY ANALYSIS One of the major competences that str.docx
INDUSTRY ANALYSIS  One of the major competences that str.docxINDUSTRY ANALYSIS  One of the major competences that str.docx
INDUSTRY ANALYSIS One of the major competences that str.docxcarliotwaycave
 
Mtm4 white paper industry analysis (featuring the 5 forces)
Mtm4 white paper   industry analysis (featuring the 5 forces)Mtm4 white paper   industry analysis (featuring the 5 forces)
Mtm4 white paper industry analysis (featuring the 5 forces)IntelCollab.com
 
Key Terms3Chapter Outline3-1The Organization’s Indu
Key Terms3Chapter Outline3-1The Organization’s InduKey Terms3Chapter Outline3-1The Organization’s Indu
Key Terms3Chapter Outline3-1The Organization’s InduTatianaMajor22
 
BUSI 4940.001 Summer 5 Week 1 Class 1 Welcome.docx
BUSI 4940.001 Summer 5 Week 1 Class 1 Welcome.docxBUSI 4940.001 Summer 5 Week 1 Class 1 Welcome.docx
BUSI 4940.001 Summer 5 Week 1 Class 1 Welcome.docxhumphrieskalyn
 
Week 4 Discussion_ BUS 599A Rotten Apple  Please respond.docx
Week 4 Discussion_ BUS 599A Rotten Apple  Please respond.docxWeek 4 Discussion_ BUS 599A Rotten Apple  Please respond.docx
Week 4 Discussion_ BUS 599A Rotten Apple  Please respond.docxcockekeshia
 
Competitive intelligence-analysis-tools-for-economic-development
Competitive intelligence-analysis-tools-for-economic-developmentCompetitive intelligence-analysis-tools-for-economic-development
Competitive intelligence-analysis-tools-for-economic-developmentPraxis Gnosis
 
Fundamental analysis and technical analysis
Fundamental analysis and technical analysisFundamental analysis and technical analysis
Fundamental analysis and technical analysisMohammed Umair
 
Scip Chicago 20080131
Scip Chicago 20080131Scip Chicago 20080131
Scip Chicago 20080131Arik Johnson
 

Similar to GETTING STARTED WITH MERGENTACCESSING MERGENT1 Go to t (20)

Mis presentation
Mis presentationMis presentation
Mis presentation
 
EnvironmentalScanning.pptx
EnvironmentalScanning.pptxEnvironmentalScanning.pptx
EnvironmentalScanning.pptx
 
Conducting an industry analysis
Conducting an industry analysisConducting an industry analysis
Conducting an industry analysis
 
Sm module (2)
Sm module (2)Sm module (2)
Sm module (2)
 
Business Research
Business ResearchBusiness Research
Business Research
 
Chapter 3
Chapter 3Chapter 3
Chapter 3
 
Media Management 2011-Strategy Module - Jan 21_2
Media Management 2011-Strategy Module - Jan 21_2Media Management 2011-Strategy Module - Jan 21_2
Media Management 2011-Strategy Module - Jan 21_2
 
HOW INDUSTRIES CHANGE- case study...pptx
HOW INDUSTRIES CHANGE- case study...pptxHOW INDUSTRIES CHANGE- case study...pptx
HOW INDUSTRIES CHANGE- case study...pptx
 
INDUSTRY ANALYSIS One of the major competences that str.docx
INDUSTRY ANALYSIS  One of the major competences that str.docxINDUSTRY ANALYSIS  One of the major competences that str.docx
INDUSTRY ANALYSIS One of the major competences that str.docx
 
Mtm4 white paper industry analysis (featuring the 5 forces)
Mtm4 white paper   industry analysis (featuring the 5 forces)Mtm4 white paper   industry analysis (featuring the 5 forces)
Mtm4 white paper industry analysis (featuring the 5 forces)
 
Key Terms3Chapter Outline3-1The Organization’s Indu
Key Terms3Chapter Outline3-1The Organization’s InduKey Terms3Chapter Outline3-1The Organization’s Indu
Key Terms3Chapter Outline3-1The Organization’s Indu
 
Building The Outer Structure
Building The Outer StructureBuilding The Outer Structure
Building The Outer Structure
 
BUSI 4940.001 Summer 5 Week 1 Class 1 Welcome.docx
BUSI 4940.001 Summer 5 Week 1 Class 1 Welcome.docxBUSI 4940.001 Summer 5 Week 1 Class 1 Welcome.docx
BUSI 4940.001 Summer 5 Week 1 Class 1 Welcome.docx
 
Week 4 Discussion_ BUS 599A Rotten Apple  Please respond.docx
Week 4 Discussion_ BUS 599A Rotten Apple  Please respond.docxWeek 4 Discussion_ BUS 599A Rotten Apple  Please respond.docx
Week 4 Discussion_ BUS 599A Rotten Apple  Please respond.docx
 
Competitive intelligence-analysis-tools-for-economic-development
Competitive intelligence-analysis-tools-for-economic-developmentCompetitive intelligence-analysis-tools-for-economic-development
Competitive intelligence-analysis-tools-for-economic-development
 
Advertising and Campaign planning
Advertising and Campaign planningAdvertising and Campaign planning
Advertising and Campaign planning
 
Fundamental analysis and technical analysis
Fundamental analysis and technical analysisFundamental analysis and technical analysis
Fundamental analysis and technical analysis
 
Lect ch 05
Lect ch 05Lect ch 05
Lect ch 05
 
Scip Chicago 20080131
Scip Chicago 20080131Scip Chicago 20080131
Scip Chicago 20080131
 
Operation and strategy course 1.0
Operation and strategy  course 1.0Operation and strategy  course 1.0
Operation and strategy course 1.0
 

More from MatthewTennant613

Assignment Application Adoption of New Technology SystemsAs a nu.docx
Assignment Application Adoption of New Technology SystemsAs a nu.docxAssignment Application Adoption of New Technology SystemsAs a nu.docx
Assignment Application Adoption of New Technology SystemsAs a nu.docxMatthewTennant613
 
Assignment Accreditation and Quality EnhancementThe purpose of ac.docx
Assignment Accreditation and Quality EnhancementThe purpose of ac.docxAssignment Accreditation and Quality EnhancementThe purpose of ac.docx
Assignment Accreditation and Quality EnhancementThe purpose of ac.docxMatthewTennant613
 
ASSIGNMENT AOperationsManagement- Y.docx
ASSIGNMENT AOperationsManagement- Y.docxASSIGNMENT AOperationsManagement- Y.docx
ASSIGNMENT AOperationsManagement- Y.docxMatthewTennant613
 
Assignment Adaptive ResponseAs an advanced practice nurse, you wi.docx
Assignment Adaptive ResponseAs an advanced practice nurse, you wi.docxAssignment Adaptive ResponseAs an advanced practice nurse, you wi.docx
Assignment Adaptive ResponseAs an advanced practice nurse, you wi.docxMatthewTennant613
 
Assignment 5 Senior Seminar Project Due Week 10 and worth 200 poi.docx
Assignment 5 Senior Seminar Project Due Week 10 and worth 200 poi.docxAssignment 5 Senior Seminar Project Due Week 10 and worth 200 poi.docx
Assignment 5 Senior Seminar Project Due Week 10 and worth 200 poi.docxMatthewTennant613
 
Assignment 5 Federal Contracting Activities and Contract Types Du.docx
Assignment 5 Federal Contracting Activities and Contract Types Du.docxAssignment 5 Federal Contracting Activities and Contract Types Du.docx
Assignment 5 Federal Contracting Activities and Contract Types Du.docxMatthewTennant613
 
Assignment 5 CrowdsourcingDue 06102017 At 1159 PMCrowdso.docx
Assignment 5 CrowdsourcingDue 06102017 At 1159 PMCrowdso.docxAssignment 5 CrowdsourcingDue 06102017 At 1159 PMCrowdso.docx
Assignment 5 CrowdsourcingDue 06102017 At 1159 PMCrowdso.docxMatthewTennant613
 
Assignment 4What are the power motivators of police leaders Expla.docx
Assignment 4What are the power motivators of police leaders Expla.docxAssignment 4What are the power motivators of police leaders Expla.docx
Assignment 4What are the power motivators of police leaders Expla.docxMatthewTennant613
 
Assignment 4Project ProgressDue Week 9 and worth 200 points.docx
Assignment 4Project ProgressDue Week 9 and worth 200 points.docxAssignment 4Project ProgressDue Week 9 and worth 200 points.docx
Assignment 4Project ProgressDue Week 9 and worth 200 points.docxMatthewTennant613
 
Assignment 4 PresentationChoose any federal statute that is curre.docx
Assignment 4 PresentationChoose any federal statute that is curre.docxAssignment 4 PresentationChoose any federal statute that is curre.docx
Assignment 4 PresentationChoose any federal statute that is curre.docxMatthewTennant613
 
Assignment 4 The Perfect ManagerWrite a one to two (1–2) page pap.docx
Assignment 4 The Perfect ManagerWrite a one to two (1–2) page pap.docxAssignment 4 The Perfect ManagerWrite a one to two (1–2) page pap.docx
Assignment 4 The Perfect ManagerWrite a one to two (1–2) page pap.docxMatthewTennant613
 
Assignment 4 Presentation Choose any federal statute that is cu.docx
Assignment 4 Presentation Choose any federal statute that is cu.docxAssignment 4 Presentation Choose any federal statute that is cu.docx
Assignment 4 Presentation Choose any federal statute that is cu.docxMatthewTennant613
 
Assignment 4 Inmates Rights and Special CircumstancesDue Week 8 a.docx
Assignment 4 Inmates Rights and Special CircumstancesDue Week 8 a.docxAssignment 4 Inmates Rights and Special CircumstancesDue Week 8 a.docx
Assignment 4 Inmates Rights and Special CircumstancesDue Week 8 a.docxMatthewTennant613
 
Assignment 4 Part D Your Marketing Plan – Video Presentation.docx
Assignment 4 Part D Your Marketing Plan – Video Presentation.docxAssignment 4 Part D Your Marketing Plan – Video Presentation.docx
Assignment 4 Part D Your Marketing Plan – Video Presentation.docxMatthewTennant613
 
Assignment 4 DUE Friday 72117 @ 1100amTurn in a written respon.docx
Assignment 4 DUE Friday 72117 @ 1100amTurn in a written respon.docxAssignment 4 DUE Friday 72117 @ 1100amTurn in a written respon.docx
Assignment 4 DUE Friday 72117 @ 1100amTurn in a written respon.docxMatthewTennant613
 
Assignment 4 Database Modeling and NormalizationImagine that yo.docx
Assignment 4 Database Modeling and NormalizationImagine that yo.docxAssignment 4 Database Modeling and NormalizationImagine that yo.docx
Assignment 4 Database Modeling and NormalizationImagine that yo.docxMatthewTennant613
 
Assignment 3 Inductive and Deductive ArgumentsIn this assignment,.docx
Assignment 3 Inductive and Deductive ArgumentsIn this assignment,.docxAssignment 3 Inductive and Deductive ArgumentsIn this assignment,.docx
Assignment 3 Inductive and Deductive ArgumentsIn this assignment,.docxMatthewTennant613
 
Assignment 3 Wireless WorldWith the fast-moving technology, the w.docx
Assignment 3 Wireless WorldWith the fast-moving technology, the w.docxAssignment 3 Wireless WorldWith the fast-moving technology, the w.docx
Assignment 3 Wireless WorldWith the fast-moving technology, the w.docxMatthewTennant613
 
Assignment 3 Web Design Usability Guide PresentationBefore you .docx
Assignment 3 Web Design Usability Guide PresentationBefore you .docxAssignment 3 Web Design Usability Guide PresentationBefore you .docx
Assignment 3 Web Design Usability Guide PresentationBefore you .docxMatthewTennant613
 
Assignment 3 Understanding the Prevalence of Community PolicingAs.docx
Assignment 3 Understanding the Prevalence of Community PolicingAs.docxAssignment 3 Understanding the Prevalence of Community PolicingAs.docx
Assignment 3 Understanding the Prevalence of Community PolicingAs.docxMatthewTennant613
 

More from MatthewTennant613 (20)

Assignment Application Adoption of New Technology SystemsAs a nu.docx
Assignment Application Adoption of New Technology SystemsAs a nu.docxAssignment Application Adoption of New Technology SystemsAs a nu.docx
Assignment Application Adoption of New Technology SystemsAs a nu.docx
 
Assignment Accreditation and Quality EnhancementThe purpose of ac.docx
Assignment Accreditation and Quality EnhancementThe purpose of ac.docxAssignment Accreditation and Quality EnhancementThe purpose of ac.docx
Assignment Accreditation and Quality EnhancementThe purpose of ac.docx
 
ASSIGNMENT AOperationsManagement- Y.docx
ASSIGNMENT AOperationsManagement- Y.docxASSIGNMENT AOperationsManagement- Y.docx
ASSIGNMENT AOperationsManagement- Y.docx
 
Assignment Adaptive ResponseAs an advanced practice nurse, you wi.docx
Assignment Adaptive ResponseAs an advanced practice nurse, you wi.docxAssignment Adaptive ResponseAs an advanced practice nurse, you wi.docx
Assignment Adaptive ResponseAs an advanced practice nurse, you wi.docx
 
Assignment 5 Senior Seminar Project Due Week 10 and worth 200 poi.docx
Assignment 5 Senior Seminar Project Due Week 10 and worth 200 poi.docxAssignment 5 Senior Seminar Project Due Week 10 and worth 200 poi.docx
Assignment 5 Senior Seminar Project Due Week 10 and worth 200 poi.docx
 
Assignment 5 Federal Contracting Activities and Contract Types Du.docx
Assignment 5 Federal Contracting Activities and Contract Types Du.docxAssignment 5 Federal Contracting Activities and Contract Types Du.docx
Assignment 5 Federal Contracting Activities and Contract Types Du.docx
 
Assignment 5 CrowdsourcingDue 06102017 At 1159 PMCrowdso.docx
Assignment 5 CrowdsourcingDue 06102017 At 1159 PMCrowdso.docxAssignment 5 CrowdsourcingDue 06102017 At 1159 PMCrowdso.docx
Assignment 5 CrowdsourcingDue 06102017 At 1159 PMCrowdso.docx
 
Assignment 4What are the power motivators of police leaders Expla.docx
Assignment 4What are the power motivators of police leaders Expla.docxAssignment 4What are the power motivators of police leaders Expla.docx
Assignment 4What are the power motivators of police leaders Expla.docx
 
Assignment 4Project ProgressDue Week 9 and worth 200 points.docx
Assignment 4Project ProgressDue Week 9 and worth 200 points.docxAssignment 4Project ProgressDue Week 9 and worth 200 points.docx
Assignment 4Project ProgressDue Week 9 and worth 200 points.docx
 
Assignment 4 PresentationChoose any federal statute that is curre.docx
Assignment 4 PresentationChoose any federal statute that is curre.docxAssignment 4 PresentationChoose any federal statute that is curre.docx
Assignment 4 PresentationChoose any federal statute that is curre.docx
 
Assignment 4 The Perfect ManagerWrite a one to two (1–2) page pap.docx
Assignment 4 The Perfect ManagerWrite a one to two (1–2) page pap.docxAssignment 4 The Perfect ManagerWrite a one to two (1–2) page pap.docx
Assignment 4 The Perfect ManagerWrite a one to two (1–2) page pap.docx
 
Assignment 4 Presentation Choose any federal statute that is cu.docx
Assignment 4 Presentation Choose any federal statute that is cu.docxAssignment 4 Presentation Choose any federal statute that is cu.docx
Assignment 4 Presentation Choose any federal statute that is cu.docx
 
Assignment 4 Inmates Rights and Special CircumstancesDue Week 8 a.docx
Assignment 4 Inmates Rights and Special CircumstancesDue Week 8 a.docxAssignment 4 Inmates Rights and Special CircumstancesDue Week 8 a.docx
Assignment 4 Inmates Rights and Special CircumstancesDue Week 8 a.docx
 
Assignment 4 Part D Your Marketing Plan – Video Presentation.docx
Assignment 4 Part D Your Marketing Plan – Video Presentation.docxAssignment 4 Part D Your Marketing Plan – Video Presentation.docx
Assignment 4 Part D Your Marketing Plan – Video Presentation.docx
 
Assignment 4 DUE Friday 72117 @ 1100amTurn in a written respon.docx
Assignment 4 DUE Friday 72117 @ 1100amTurn in a written respon.docxAssignment 4 DUE Friday 72117 @ 1100amTurn in a written respon.docx
Assignment 4 DUE Friday 72117 @ 1100amTurn in a written respon.docx
 
Assignment 4 Database Modeling and NormalizationImagine that yo.docx
Assignment 4 Database Modeling and NormalizationImagine that yo.docxAssignment 4 Database Modeling and NormalizationImagine that yo.docx
Assignment 4 Database Modeling and NormalizationImagine that yo.docx
 
Assignment 3 Inductive and Deductive ArgumentsIn this assignment,.docx
Assignment 3 Inductive and Deductive ArgumentsIn this assignment,.docxAssignment 3 Inductive and Deductive ArgumentsIn this assignment,.docx
Assignment 3 Inductive and Deductive ArgumentsIn this assignment,.docx
 
Assignment 3 Wireless WorldWith the fast-moving technology, the w.docx
Assignment 3 Wireless WorldWith the fast-moving technology, the w.docxAssignment 3 Wireless WorldWith the fast-moving technology, the w.docx
Assignment 3 Wireless WorldWith the fast-moving technology, the w.docx
 
Assignment 3 Web Design Usability Guide PresentationBefore you .docx
Assignment 3 Web Design Usability Guide PresentationBefore you .docxAssignment 3 Web Design Usability Guide PresentationBefore you .docx
Assignment 3 Web Design Usability Guide PresentationBefore you .docx
 
Assignment 3 Understanding the Prevalence of Community PolicingAs.docx
Assignment 3 Understanding the Prevalence of Community PolicingAs.docxAssignment 3 Understanding the Prevalence of Community PolicingAs.docx
Assignment 3 Understanding the Prevalence of Community PolicingAs.docx
 

Recently uploaded

ECONOMIC CONTEXT - LONG FORM TV DRAMA - PPT
ECONOMIC CONTEXT - LONG FORM TV DRAMA - PPTECONOMIC CONTEXT - LONG FORM TV DRAMA - PPT
ECONOMIC CONTEXT - LONG FORM TV DRAMA - PPTiammrhaywood
 
mini mental status format.docx
mini    mental       status     format.docxmini    mental       status     format.docx
mini mental status format.docxPoojaSen20
 
CARE OF CHILD IN INCUBATOR..........pptx
CARE OF CHILD IN INCUBATOR..........pptxCARE OF CHILD IN INCUBATOR..........pptx
CARE OF CHILD IN INCUBATOR..........pptxGaneshChakor2
 
A Critique of the Proposed National Education Policy Reform
A Critique of the Proposed National Education Policy ReformA Critique of the Proposed National Education Policy Reform
A Critique of the Proposed National Education Policy ReformChameera Dedduwage
 
How to Make a Pirate ship Primary Education.pptx
How to Make a Pirate ship Primary Education.pptxHow to Make a Pirate ship Primary Education.pptx
How to Make a Pirate ship Primary Education.pptxmanuelaromero2013
 
KSHARA STURA .pptx---KSHARA KARMA THERAPY (CAUSTIC THERAPY)————IMP.OF KSHARA ...
KSHARA STURA .pptx---KSHARA KARMA THERAPY (CAUSTIC THERAPY)————IMP.OF KSHARA ...KSHARA STURA .pptx---KSHARA KARMA THERAPY (CAUSTIC THERAPY)————IMP.OF KSHARA ...
KSHARA STURA .pptx---KSHARA KARMA THERAPY (CAUSTIC THERAPY)————IMP.OF KSHARA ...M56BOOKSTORE PRODUCT/SERVICE
 
Introduction to AI in Higher Education_draft.pptx
Introduction to AI in Higher Education_draft.pptxIntroduction to AI in Higher Education_draft.pptx
Introduction to AI in Higher Education_draft.pptxpboyjonauth
 
Employee wellbeing at the workplace.pptx
Employee wellbeing at the workplace.pptxEmployee wellbeing at the workplace.pptx
Employee wellbeing at the workplace.pptxNirmalaLoungPoorunde1
 
Crayon Activity Handout For the Crayon A
Crayon Activity Handout For the Crayon ACrayon Activity Handout For the Crayon A
Crayon Activity Handout For the Crayon AUnboundStockton
 
microwave assisted reaction. General introduction
microwave assisted reaction. General introductionmicrowave assisted reaction. General introduction
microwave assisted reaction. General introductionMaksud Ahmed
 
MENTAL STATUS EXAMINATION format.docx
MENTAL     STATUS EXAMINATION format.docxMENTAL     STATUS EXAMINATION format.docx
MENTAL STATUS EXAMINATION format.docxPoojaSen20
 
Paris 2024 Olympic Geographies - an activity
Paris 2024 Olympic Geographies - an activityParis 2024 Olympic Geographies - an activity
Paris 2024 Olympic Geographies - an activityGeoBlogs
 
Presentation by Andreas Schleicher Tackling the School Absenteeism Crisis 30 ...
Presentation by Andreas Schleicher Tackling the School Absenteeism Crisis 30 ...Presentation by Andreas Schleicher Tackling the School Absenteeism Crisis 30 ...
Presentation by Andreas Schleicher Tackling the School Absenteeism Crisis 30 ...EduSkills OECD
 
Class 11 Legal Studies Ch-1 Concept of State .pdf
Class 11 Legal Studies Ch-1 Concept of State .pdfClass 11 Legal Studies Ch-1 Concept of State .pdf
Class 11 Legal Studies Ch-1 Concept of State .pdfakmcokerachita
 
How to Configure Email Server in Odoo 17
How to Configure Email Server in Odoo 17How to Configure Email Server in Odoo 17
How to Configure Email Server in Odoo 17Celine George
 
SOCIAL AND HISTORICAL CONTEXT - LFTVD.pptx
SOCIAL AND HISTORICAL CONTEXT - LFTVD.pptxSOCIAL AND HISTORICAL CONTEXT - LFTVD.pptx
SOCIAL AND HISTORICAL CONTEXT - LFTVD.pptxiammrhaywood
 
_Math 4-Q4 Week 5.pptx Steps in Collecting Data
_Math 4-Q4 Week 5.pptx Steps in Collecting Data_Math 4-Q4 Week 5.pptx Steps in Collecting Data
_Math 4-Q4 Week 5.pptx Steps in Collecting DataJhengPantaleon
 
Science 7 - LAND and SEA BREEZE and its Characteristics
Science 7 - LAND and SEA BREEZE and its CharacteristicsScience 7 - LAND and SEA BREEZE and its Characteristics
Science 7 - LAND and SEA BREEZE and its CharacteristicsKarinaGenton
 

Recently uploaded (20)

ECONOMIC CONTEXT - LONG FORM TV DRAMA - PPT
ECONOMIC CONTEXT - LONG FORM TV DRAMA - PPTECONOMIC CONTEXT - LONG FORM TV DRAMA - PPT
ECONOMIC CONTEXT - LONG FORM TV DRAMA - PPT
 
mini mental status format.docx
mini    mental       status     format.docxmini    mental       status     format.docx
mini mental status format.docx
 
CARE OF CHILD IN INCUBATOR..........pptx
CARE OF CHILD IN INCUBATOR..........pptxCARE OF CHILD IN INCUBATOR..........pptx
CARE OF CHILD IN INCUBATOR..........pptx
 
A Critique of the Proposed National Education Policy Reform
A Critique of the Proposed National Education Policy ReformA Critique of the Proposed National Education Policy Reform
A Critique of the Proposed National Education Policy Reform
 
How to Make a Pirate ship Primary Education.pptx
How to Make a Pirate ship Primary Education.pptxHow to Make a Pirate ship Primary Education.pptx
How to Make a Pirate ship Primary Education.pptx
 
KSHARA STURA .pptx---KSHARA KARMA THERAPY (CAUSTIC THERAPY)————IMP.OF KSHARA ...
KSHARA STURA .pptx---KSHARA KARMA THERAPY (CAUSTIC THERAPY)————IMP.OF KSHARA ...KSHARA STURA .pptx---KSHARA KARMA THERAPY (CAUSTIC THERAPY)————IMP.OF KSHARA ...
KSHARA STURA .pptx---KSHARA KARMA THERAPY (CAUSTIC THERAPY)————IMP.OF KSHARA ...
 
Model Call Girl in Bikash Puri Delhi reach out to us at 🔝9953056974🔝
Model Call Girl in Bikash Puri  Delhi reach out to us at 🔝9953056974🔝Model Call Girl in Bikash Puri  Delhi reach out to us at 🔝9953056974🔝
Model Call Girl in Bikash Puri Delhi reach out to us at 🔝9953056974🔝
 
Introduction to AI in Higher Education_draft.pptx
Introduction to AI in Higher Education_draft.pptxIntroduction to AI in Higher Education_draft.pptx
Introduction to AI in Higher Education_draft.pptx
 
Employee wellbeing at the workplace.pptx
Employee wellbeing at the workplace.pptxEmployee wellbeing at the workplace.pptx
Employee wellbeing at the workplace.pptx
 
Crayon Activity Handout For the Crayon A
Crayon Activity Handout For the Crayon ACrayon Activity Handout For the Crayon A
Crayon Activity Handout For the Crayon A
 
microwave assisted reaction. General introduction
microwave assisted reaction. General introductionmicrowave assisted reaction. General introduction
microwave assisted reaction. General introduction
 
Staff of Color (SOC) Retention Efforts DDSD
Staff of Color (SOC) Retention Efforts DDSDStaff of Color (SOC) Retention Efforts DDSD
Staff of Color (SOC) Retention Efforts DDSD
 
MENTAL STATUS EXAMINATION format.docx
MENTAL     STATUS EXAMINATION format.docxMENTAL     STATUS EXAMINATION format.docx
MENTAL STATUS EXAMINATION format.docx
 
Paris 2024 Olympic Geographies - an activity
Paris 2024 Olympic Geographies - an activityParis 2024 Olympic Geographies - an activity
Paris 2024 Olympic Geographies - an activity
 
Presentation by Andreas Schleicher Tackling the School Absenteeism Crisis 30 ...
Presentation by Andreas Schleicher Tackling the School Absenteeism Crisis 30 ...Presentation by Andreas Schleicher Tackling the School Absenteeism Crisis 30 ...
Presentation by Andreas Schleicher Tackling the School Absenteeism Crisis 30 ...
 
Class 11 Legal Studies Ch-1 Concept of State .pdf
Class 11 Legal Studies Ch-1 Concept of State .pdfClass 11 Legal Studies Ch-1 Concept of State .pdf
Class 11 Legal Studies Ch-1 Concept of State .pdf
 
How to Configure Email Server in Odoo 17
How to Configure Email Server in Odoo 17How to Configure Email Server in Odoo 17
How to Configure Email Server in Odoo 17
 
SOCIAL AND HISTORICAL CONTEXT - LFTVD.pptx
SOCIAL AND HISTORICAL CONTEXT - LFTVD.pptxSOCIAL AND HISTORICAL CONTEXT - LFTVD.pptx
SOCIAL AND HISTORICAL CONTEXT - LFTVD.pptx
 
_Math 4-Q4 Week 5.pptx Steps in Collecting Data
_Math 4-Q4 Week 5.pptx Steps in Collecting Data_Math 4-Q4 Week 5.pptx Steps in Collecting Data
_Math 4-Q4 Week 5.pptx Steps in Collecting Data
 
Science 7 - LAND and SEA BREEZE and its Characteristics
Science 7 - LAND and SEA BREEZE and its CharacteristicsScience 7 - LAND and SEA BREEZE and its Characteristics
Science 7 - LAND and SEA BREEZE and its Characteristics
 

GETTING STARTED WITH MERGENTACCESSING MERGENT1 Go to t

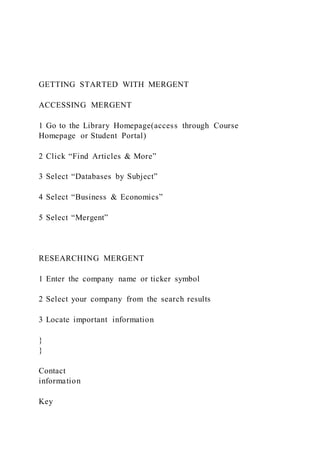
  • 1. GETTING STARTED WITH MERGENT ACCESSING MERGENT 1 Go to the Library Homepage(access through Course Homepage or Student Portal) 2 Click “Find Articles & More” 3 Select “Databases by Subject” 4 Select “Business & Economics” 5 Select “Mergent” RESEARCHING MERGENT 1 Enter the company name or ticker symbol 2 Select your company from the search results 3 Locate important information } } Contact information Key
  • 2. Figures } Company information in tabs 4 Select reports and download 5 Citation Format Author. (year). Title of Document. Retrieved from name of database. Examples: Mergent. (2016). Acadia Healthcare Annual Report. Retrieved from Mergent Online database. Mergent. (2017). Acadia Healthcare Company Details. Retrieved from Mergent Online database. Mergent. (2017). Acadia Healthcare Company Financials. Retrieved from Mergent Online database. LIBRARY ASHFORD UNIVERSITY October 2017 BUSINESS INSIGHTS: GLOBAL Accessing Business Insights: Global
  • 3. Watch a short video to learn more about what this resource has to offer, including: Go to the Library Homepage (access through Course Homepage or Student Portal) Click “Find Articles & More” Select “Databases by Subject” Select “Business & Economics” Select “Business Insights: Global (Gale)” 1 2 3 4 5 https://www.youtube.com/watch?v=aXAKj6lQICg
  • 4. Researching Business Insights: Global 1 Enter the company name or ticker symbol 2 Select your company from the search results 3 Locate important information }Contact information } CompanyInformation Key Figures} 4 Limit to Full Text 5 View Full Text 6 Share, save, print, download, or cite* *always double-check database citations. For citation information, go to writingcenter.ashford.edu LIBRARY ASHFORD UNIVERSITY November 2017 http://writingcenter.ashford.edu/ External Environmental Analysis
  • 5. Learning Objectives By the time you have completed this chapter, you should be able to do the following: • Conduct an industry and competitive analysis and understand why it is important. • Conduct a market analysis and understand why it is important. • Scan the general environment for any changes or trends that might favor or adversely affect the company. 4 Belinda Images / SuperStock CHAPTER 4Section 4.1 Industry and Competitive Analysis Chapter Outline 4.1 Industry and Competitive Analysis 4.2 Market Analysis 4.3 Environmental-Trend Analysis An analysis of the external environment covers the industry or segment in which the company competes, its competitors, markets, and other relevant environmental trends and changes. The purpose is to understand how the company’s relevant environment is changing and might
  • 6. change in the future—in this sense, “relevant” means anything the company might affect or could be affected by. Without such an understanding, doing strategic planning becomes much more difficult. 4.1 Industry and Competitive Analysis An industry analysis is the study of a firm’s industry and the forces that might be causing it to change. It involves using a number of standard but indispensable tools, including Porter’s five- forces model, industry attractiveness (part of the GE Matrix), driving forces, critical-success factor analysis, and strategic groups, all discussed in this chapter. Because the ways in which an industry changes can dramatically affect the decisions a company makes, an industry analysis has become a key element in strategic planning. The word industry in “industry analysis” can mean a segment of a larger industry or the industry itself. If a company manufactures disk drives for personal computers, for example, it could say that it competes in the disk-drive industry for purposes of doing a strategic analysis, even though that is really a segment of the computer industry. What we are really analyzing is the arena in which
  • 7. the company competes. One thing to keep in mind when conducting an industry analysis is to writedown what is true for the industry, not for the company under analysis. Sometimes industry data are easy to obtain because they are regularly published or because trade groups or consulting firms keep tabs on industry statistics. However, many industries are not tracked by any group, or they consist largely of privately held firms. This makes get- ting industry data and completing an industry analysis difficult. To minimize errors when using inadequate data or relying on one person’s estimates, it is advisable to assemble a group of people to share perspectives and use shared estimates in the analysis. If the group is fairly knowledgeable about the industry, the perceptions gathered about the industry will be more useful and make Ryan McVay/Photodisc/Thinkstock Assembling a group of knowledgeable people can be very help- ful when performing an industry analysis. CHAPTER 4Section 4.1 Industry and Competitive Analysis
  • 8. the understanding more complete. Group members who have differing estimates and opinions will be forced to explain their views and, in the process, either convince others they are correct or be persuaded to change their own views or estimates. In this way, a shared perspective leads to greater understanding. Doing an Industry Analysis The purpose of doing an industry analysis is to answer the following kinds of questions: • What are the dominant economic characteristics of the industry? • In what ways is the industry changing, and why? • Do buyers and/or suppliers have greater bargaining power? • How steep are entry barriers? • Is the industry concentrated or fragmented? • What must one do well in order to succeed in this industry? • How appealing is the industry? Dominant Economic Characteristics of an Industry Economic characteristics can vary by industry but generally are applicable throughout business and include the following: • Industry size—total dollar sales of all firms in the industry. • Industry growth rate—percentage increase or decrease over the previous year. • Scope of competitive rivalry—local, regional,
  • 9. national, international. • Number of competitors—if known. • Stage in the industry’s lifecycle: • emerging—must be a brand-new industry with total industry sales less than 5%. • growth—total industry sales growing at over 5% per year. • shakeout—a transitional period between growth and maturity where some competi- tors fail, others are acquired, and the total number of competitors shrinks. • mature—total industry sales of between 0–5% • declining—the growth rate must be negative for several years in a row. • The customers or buyers—Who are they? Where are they? How many are there? • Degree of vertical integration—How many companies in the industry are vertically inte- grated forward? How many are vertically integrated backward? How many are vertically integrated in both directions? • Rate of technological innovation—How dependent is the industry on technological inno- vation? How much innovation is taking place? • Product characteristics—Are the products commodity- like or differentiated? This deter- mines to a large extent the bargaining power the industry has with respect to buyers. Are the products high- or low-tech?
  • 10. • Economies of scale—for example in purchasing, production, shipping, distribution, or advertising. • Capacity utilization—Is capacity utilization in the industry high or low? How sensitive are variations in capacity utilization to profits? In commodity-like industries, profits are very sensitive to capacity utilization. • Industry profitability—If profitability in the industry is not high, what are some causes? Commodity-like industries are low-profit, while those with differentiated companies com- mand higher profits. CHAPTER 4Section 4.1 Industry and Competitive Analysis Forces Driving Industry Change To understand how an industry is changing, identify the driving forces causing those changes. The following are examples of driving forces: • Changes in the industry growth rate • Changes in who buys the product and how customers use it • Product or marketing innovations • Changes in technology • Exit or entry of major firms • Circulation of technical knowledge • Increasing global scope of the industry • Changes in cost and efficiency, for example, in process innovations • Emerging buyer preferences for differentiation
  • 11. • Changes in governmental or economic policy • Deregulation or increasing regulation of an industry • Changes in societal attitudes, concerns, and lifestyles • Reductions or increases in uncertainty and business risk • Likelihood that this and one or more other industries will merge or converge It is one thing to ascertain that an industry has been and is changing, but quite another to gauge the way it will change in the future. That is, however, the challenge managers must face. If one can come to understand how an industry is changing and what is causing it to change, the chances are good that future changes can be predicted and possibly anticipated. In many industries today, rapidly advancing technology is changing everything about the industry—the product itself, how it is made, how it is distributed, and how it is used. The examples provided of driving forces may provide a starting point for an examination of a particular industry and how it may be changing. Of course, it is important to keep in mind that every industry is unique and may have driving forces other than those listed here. Bargaining Power
  • 12. What exactly is bargaining power? In simple terms, it comes down to who dictates the terms such as price, delivery, quality, and the like in a negotiation. Consider the example of someone trying to sell a used car. There is a certain “Blue Book” price for a car of a certain model, age, mileage, condi- tion, and options. If the make and model is in high demand, the car at issue has low mileage, and is in good condition, then the price will be higher. It is possible that several potential buyers may actually bid up the price. The seller in that situation may demand full payment in cash and other conditions and will probably get them. In this case, the seller has bargaining power and will end up making a favorable deal. On the other hand, if the seller is desperate to sell the car, or it is not in very good condition, perhaps needing major repairs, and the seller has to incur costs to advertise extensively, he may have to accept the first offer that comes along, even at some fraction of his asking price. In this case, the buyer would have all the bargaining power and the seller none. Sometimes both buyers and suppliers have bargaining power. In that situation it is likely that the industry in question has low profitability, the product
  • 13. is viewed as a commodity, rivalry among competitors is fierce, and innovation is relatively low. On the other hand, if companies in the industry have more bargaining power than both buyers and suppliers, the chances are that it is profitable, the products and competitors are differentiated and have strong brands, competition is controlled as it is in monopolistic competition, and innovation may be fairly rapid. For another example of bargaining power, consider the unfortunate predicament of a California tool manufacturer. About 90% of the company’s production was going to one customer. Profit margin was understandably low. One day the customer demanded a price reduction of 10% and CHAPTER 4Section 4.1 Industry and Competitive Analysis delivery in small quantities at frequent intervals, thus forcing the tool manufacturer to carryeven more inventory and increase its costs. If the company had not been so dependent on this one cus- tomer, it might have refused to supply it but it could not. Instead, it got squeezed. It’s not difficult to tell who had the bargaining power here.
  • 14. This example is true and, while unfortunate, illustrates how shortsighted companies can be. The customer in this case did not appear to care that it might driveone of its principal suppliers out of business. Walmart is another example of a company that, because of its size and influence with its customers, retains the bargaining power when negotiating with its suppliers. It, too, appears to run many of its suppliers into the ground in its drivefor ever-lower costs. In contrast, Toyota and other companies practice Kaizen, a system in which independent suppliers sign long-term agreements with the manufacturer, practically collocate with the manufacturer, earn fair profits, and are given help and training to supply products and parts at the desired level of quality and delivery. If a company has many suppliers all competing for the contract to supply it, the company has bar- gaining power. If it has to purchase a component, however, and only one company can supply it, that supplier will have bargaining power. One strategy that suppliers have for retaining bargaining power is to raise the switching costs of the buyer, that is, make it so expensive for a buyer to switch
  • 15. to a competing supplier that it will not do so. Consider a supplier that provides its customer’s pro- curement staff with computer terminals that are tied in with its own system, enabling the customer to order at any time, track the status of delivery of any order, and so on. The service could be so convenient, and the purchasing company’s people so well trained and comfortable in using the ordering system, that it might not change suppliers even if a lower-cost competitor came along. Porter’s Five-Forces Model In 1980, Michael E. Porter of the Harvard Business School developed what is probably the most influential tool for assessing the structure and competitive threats of an industry. Porter proposed a framework that in a given industry, five forces determine the degree of competitiveness in that indus- try. Competitiveness, in turn establishes the attractiveness or profitability of the industry. This model can be used by organizations considering a wide range of strategic plans, including entry into the industry and beyond. The five forces described by Porter are • Rivalry among existing competitors • Bargaining power of buyers
  • 16. • Bargaining power of suppliers • Threat of new entrants • Threat of substitutes Figure 4.1 depicts Porter’s five-forces model in diagrammatic form. The five main boxes in the shape of a crossconstitute the actual model. The four “analysis” boxes in each corner add meaning to the model and enhance the industry analysis. In the model, the terms buyers and suppliers are self-evident; these are the customers of the industry and the firms that supply the raw materials, respectively. Rivals are all of the companies presently competing in the industry. New entrants are firms not currently engaged in the industry but which could potentially compete in the future. For example, British supermarket chain Tesco PLC entered the U.S. grocery indus- try in 2007 under the brand Fresh and Easy, with an aggressive growth plan, concentrating primarily on the Southwest states. Although Tesco did not open Fresh and Easy locations in all U.S. markets, or even in all Southwestern communities, existing grocers were wise to be aware of the Fresh and Easy threat. (continued)
  • 17. CHAPTER 4Section 4.1 Industry and Competitive Analysis Substitutes are products in other industries that have the potential to draw customers awayand are, in effect, also competitors. The concept of substitutes is sometimes hard to grasp; accordingly, the following example may help. The founder of a for-profit theater company in a moderately sized California town believed he had no competition as there was no other theater company in the town. Yet when his season tickets went on sale in the fall, they did not sell out. In fact, far from selling out, many tickets remained unsold all season long. He remained puzzled by this until someone asked him what a person in the town could do with $20 on a Friday or Saturday night. Well, he replied, that per- son could go to the movies, out to dinner, watch TV, go for a walk, go to a ballgame, go shopping, or visit with friends, among many other options. It turned out that “going to the theater” ranked quite low on this list, accounting for the dearth of ticket sales. This impressed on the theater owner that his real competition came from substitutes. To perform an industry analysis for a particular
  • 18. company using Porter’s model, one would begin by listing the company name as well as those of its principal competitors in the Rivals box. Next, writea description of the buyers and suppliers of the industry (not the company under study) in the respec- tive boxes. Be careful not to list distributors or retail channels as buyers, even though they may purchase the products for resale. Porter intended that buyers for companies that make frames for glasses be listed as people, not optometrists. The names of any firms that could possibly enter the industry are entered in the New Entrants box. If no potential new entrants can be identified, the box should be marked “unknown.” Finally any substitutes to what the industry produces are written in the box so labeled. Once the five boxes have been filled in on the model, then writea brief assessment of the intensity of rivalry (low, medium, or high, and why), bargaining power of buyers and suppliers (low, medium, or high, and why), entry barriers (low, medium, or high, and what they are), and threat of substitutes (low, medium, or high, and why) in each of the corner analysis boxes.
  • 19. Porter’s model provides a clear, straightforward way to assess the nature of competition in any indus- try. Users should take care not to be misled by the seemingly simplistic nature of this tool. Strategic thinkers must be thorough and wide-ranging in their thinking when analyzing each element within the context of their business, industry, and environment. As the theatre owner’s case illustrates, shortsighted or narrow thinking may lead to an inaccurate assessment of the elements and poten- tially negative implications for profit, public relations, employee morale, and more. Threat of Entrant Power of Buyer Power of Supplier Competitive Rivalry Threat of Substitutes Figure 4.1: Porter’s Five-Forces Model Source: Adapted from Alexander Osterwalder and Yves Pigneur, Business Model Generation: A Handbook
  • 20. for Visionaries, Game Changers, p. 99.Copyright © 2010 John Wiley & Sons. Reprinted with permission. llepera Typewritten Text llepera Typewritten Text llepera Typewritten Text llepera Typewritten Text CHAPTER 4Section 4.1 Industry and Competitive Analysis Barriers to Entry High entry barriers keep potential entrants out of an industry. This is a good thing for a company that is already in the industry, but a bad thing for a company trying to enter the industry. Barriers to entry could take any of several forms. An industry that requires a significant capital invest- ment to enter has a high barrier to entry, particularly to smaller firms. Another type of barrier is the need for expertise in a certain technology or manufacturing process, a core competence, or proprietary technology, which could cost a lot or take a long time to develop. Electronics and
  • 21. biotechnology industries have this barrier. An established brand name and customer loyalty, both of which take time to develop, may also provide a deterrent to would-be entrants. When an industry includes competitors with significant market share and market power or competitors with low costs that realize significant economies of scale, prospective entrants would probably view this as a barrier. What if the potential entrant is a much larger corporation with more than adequate financial resources and possibly also a strong brand identity in a related market? The results of this assess- ment might turn out quite differently. The issue is to try to imagine (a) who the likely potential entrant might be; (b) why it might want to enter this industry now; and (c) make as best an assess- ment as you can. What is perceived by one firm to be a high barrier to entry may not present a deterrent to another. Also, in some industries it may be easy to enter the industry but difficult to compete effectively on a national or global scale once having entered. For example, in the donut industry, anyone can open a single donut shop that serves local customers (“easy to enter”). Yet such an entrant would unlikely compete with the large national chains like
  • 22. Dunkin Donuts, Winchell’s, and Krispy Kreme, and so would not present a threat at all (“hard to compete with”). Industry Concentration A concentrated industry is one in which a few firms in the industry account for a large portion of total industry sales. Examples are com- mercial aircraft manufacturing, in which only two firms compete (Boeing and Airbus), or the busi- ness of auditing public companies in the United States, in which 96% of the work is shared among the “Big Four” certified public accounting (CPA) firms. Even six to eight firms, accounting for upwards of 40% of an industry’s sales, would qualify to be called concentrated. A fragmented industry is one in which no one firm has more than a fraction of a percent in market share. Examples are beauty salons and the Inga Ivanova/iStock/Thinkstock Beauty salons are an example of a fragmented industry. CHAPTER 4Section 4.1 Industry and Competitive Analysis auditing of privately held businesses. Bookstores
  • 23. and fast-food restaurants used to be fragmented industries, but now are fairly concentrated due to franchising and the emergence of dominant chains. For a company in a fragmented industry, it is difficult to increase market share unless you clone or standardize the business and duplicate or franchise it (Porter, 1982). This is what some fast-food companies did and what enabled them to become global giants such as McDonald’s, KFC, Burger King, and so on. Critical Success Factors When a potential company is assessing an industry, it often needs to identify the industry’s critical success factors (CSFs). Think of them as constituting the rules of the industry. Just as every sport has its own set of unique rules, there is no way that one can “play” in an industry, let alone domi- nate it, without knowing and playing by those rules. CSFs attach to an industry, not to a company, and every industry has a different set. Ideally, a firm should be able to identify six to eight CSFs. One way is to come up with a much larger number first and then edit them down to those that are really essential to succeeding in its particular industry.
  • 24. The value of identifying the industry’s critical success factors becomes evident when they are used to compare a company with its key competitors. A CSF analysis allows a company to compare itself against its principal competitors using CSFs as the dimensions to do so (Table 4.1). After choosing six appropriate CSFs for the industry, the example company was rated along the dimensions of the listed CSFs on a scale of 0–10, 10 being highest. The same was done for each competitor in the table. Table 4.1: Critical-success-factor analysis Critical-Success Factor Company Competitor A Competitor B Competitor C Competitor D Strength of brand 10 8 9 8 10 Distribution channels 6 10 9 8 7 New-product development 8 5 10 7 8 Financial strength 9 6 10 8 9 Customer service 8 7 8 9 5
  • 25. Low costs 5 6 5 6 9 Totals 46 39 51 46 48 In the example shown, the company under analysis rated a total of 46 out of a possible 60. Com- paring the scores gives a rough idea of how the company “stacks up” against its competitors, as well as how each of the key competitors stacks up against the others. To the extent that your ratings of a company and those of its competitors are accurate or realistic, the analysis provides useful information regarding whether or not the company has competitive advantages or vulner- abilities and which competitors are most dangerous. CHAPTER 4Section 4.1 Industry and Competitive Analysis Looking across the rows, the table reveals where there may be a competitive advantage or com- petitive vulnerability. In this example, the company’s strong brand may constitute a competitive advantage. Competitor A may have one in its extensive distribution system, and Competitor B one in its ability to generate new products rapidly. Any rating of 5 in the table would signify a competi- tive vulnerability, something that should be addressed in that company’s short-term plans (like the company’s and Competitor B’s costs).
  • 26. Looking down the columns, the analysis identifies which competitors are more dangerous than others. In the table, judging from the totals at the bottom, the company lies in the middle of the pack, with Competitors B and D to be more feared than the other two competitors. Competitive analysis includes how the company might react to attacks, especially from strong competitors (Coyne & Horn, 2009). Industry Attractiveness Can one measure industry “attractiveness,” and is it important? The answers to these questions are yes and yes, but the measurement is highly subjective and the result is more useful in some situations than others. Industry attractiveness is based on of a number of attributes or charac- teristics. To discover them, imagine what an ideal industry would look like. It would have, for example, a huge market (potential customer base), be growing rapidly, be hugely profitable, have few competitors, be unregulated, have high entry barriers, and require no need for technological expertise that the company could not handle. This would yield the following initial list of factors for an industry-attractiveness analysis: • Size of the potential market • Industry growth rate • Intensity of competition
  • 27. • Degree of regulation • Entry barriers • Degree of technological innovation These factors, of course, constitute an incomplete list; they may be changed or amplified. Notice also that the factors are stated in a neutral way: “size of the potential market,” not “large market.” To perform an industry-attractiveness analysis, first assign a weight to each of these factors as a percentage according to their perceived importance. Next rate each factor from the point of view of the company doing the analysis on a scale of 0–1.0. Finally, multiply the weight by the rating for each factor. Be careful in two instances: (a) If degree of competition is high, the rating should be low because it makes the industry less attractive, and (b) if degree of regulation is low, the rating should be high as it makes the industry more attractive. Remember that the rating should be high for any factor that makes the industry more attractive, and low if the opposite. Add up the prod- ucts to yield a percentage figure. Table 4.2 below shows an industry-attractive matrix, which is a weighted technique based on a num-
  • 28. ber of factors to determine how attractive an industry is. The industry-attractiveness (I.A.) index of 75.6 shows this to be an attractive industry, attractive enough to stay in it and invest in improving the company’s position. When such an analysis yields a result of less than 50%, then the company might well ask the fateful question, “Should we continue to be in this industry, or should we exit?” CHAPTER 4Section 4.1 Industry and Competitive Analysis Strategic-Group Map In industries that contain disparate competitors, a strategic-group map is a useful technique to cluster and identify strategically similar competitors. Competitors can show differences—and similarities—to each other on various factors (Porter, 1982). Those that are similar to each other belong to the same strategic group; the more distant one strategic group is from another reflects the extent to which they are dissimilar and hence not direct competitors. An industry often consists of a small number of distinct strategic groups. A strategic-group map is a two- dimen- sional representation of an industry’s strategic groups.
  • 29. To create one, choose two strategic dimensions that are not correlated with each other, as are price and qual- ity, and that have the capacity to separate the com- petitors in the industry. For example, if all companies in the industry have broad product lines, choosing this dimension as one of the axes will not work—all the com- petitors would be bunched up at one end. On the other hand, positioning might be a useful dimension to use if there are some companies at the high end, some at the midlevel, and some at the low end of the industry. Other than the two guidelines given previously, there is no rule for choosing strategic dimensions that would serve as axes for the strategic-group map. The dimensions cho- sen as axes for a strategic-group map should embody strategic variables, not performance. Try several and see which two separate the competitors or rivals into clusters on the map. When you have several clusters that make sense and can articulate the strategy of each cluster, you have a useful strategic-group map. Naturally,
  • 30. using the technique presupposes a good working knowl- edge of competitors in a particular industry. Figures 4.2 and 4.3 show examples of strategic-group maps. Figure 4.2 is a simple strategic- group map that represents the pharmaceutical industry. Figure 4.3 shows a slightly more complex Daniel Acker/Bloomberg via Getty Images Budweiser is in the same strategic group as Miller Brewing company, but in a different group than microbrewers. Table 4.2: Industry-attractiveness matrix Factor Weight Rating Product Industry growth rate 24 0.8 19.2 Profitability 20 0.7 14.0 Size of potential market 18 1.0 18.0 Intensity of competition 16 0.3 4.8 Entry barriers 12 0.8 9.6 Degree of regulation 10 1.0 10.0 Totals 100 I.A. Index 75.6
  • 31. CHAPTER 4Section 4.1 Industry and Competitive Analysis strategic-group map of selected retail chains. The figures display different strategic dimensions in use and underscore the fact that companies in the same strategic group compete more intensely with each other, while competition between distant groups is virtually nonexistent. Low High P ri ce s C h a rg e d R&D Spending High Generic Group Teva Mylan Labs Watson Pharma
  • 32. Greenstone Proprietary Group Valeant Pharm. Merck Pfizer Lilly Figure 4.2: Simple strategic-group map of the pharmaceutical industry Few Locations High Geographic Coverage Many Locations Low High P ri ce /Q u a lit y
  • 33. Neiman- Marcus, Saks Fifth Ave Macy’s, Nordstrom, Dillard’s Ralph Lauren Gucci, Chanel, ect. Gap TJ Max Walmart, Kmart Target Figure 4.3: Strategic-group map of selected retail chains Source: Adapted from Arthur A. Thompson, Jr., John E. Gamble, and A. J Strickland III, Strategy: Core Concepts, Analytical Tools, Readings, p. 68. Copyright © 2004 Irwin McGraw-Hill. Reprinted with permission. Source: Charles W. L. Hill and Gareth R. Jones, Strategic Management: An Integrated
  • 34. Approach, 10th ed., p. 96. Copyright © 2013 Cengage Learning. Reprinted by permission. CHAPTER 4Section 4.1 Industry and Competitive Analysis What can be learned from a strategic-group map? First, the companies in a particular strategic group are strategically similar and constitute the group’s key competitors. Those in a nearby group form the next tier of competitors. In all likelihood, companies in a distant strategic group are not really competitors although they are in the same industry. For example, in the U.S. beer industry, Anheuser Busch competes with Miller Brewing in the same strategic group, but not with the many microbrewers and some of the imported high-end beers, which are in distant strategic groups. In another example, this time in the hospitality industry, Days Inn (low end) does not compete with Ritz Carlton (high end) because they are strategically dissimilar and in different strategic groups; their markets are quite different. Secondly, the implications of Porter’s five-forces model are different for different strategic groups. Entry barriers vary among the groups, as do bargaining power with suppliers and customers, the threat of substitutes, and the intensity of intra-
  • 35. group rivalry. Thus, it could be more desirable to be in one strategic group than another (there could be more opportunities and fewer threats) (Hill & Jones, 2001). For example, in retailing, a recession would adversely affect high-end department stores but actually increase demand for discounters and mass merchandisers. Because of such differences, it may be worthwhile for a company to move consciously from one strategic group to another. The ease of doing so depends on the size of mobility barriers between the groups (fac- tors that inhibit both entry into and exit from a group). For example, in Figure 4.2, Greenstone is a generic pharmaceutical company that competes with others in its strategic group; it would find it very difficult to move into the proprietary strategic group with companies like Valeant Pharma- ceutical and Merck. This is because Greenstone lacks the necessary R&D skills and resources that would take time and a great deal of capital to acquire. Thirdly, one could discover some unserved demand in an area of a strategic-group map not occu- pied by any strategic group. In creating a strategic-group map of the automobile industry, using pricing and safety as the two strategic dimensions, a group of business students found that no
  • 36. company was offering a low-priced, high-safety automobile. Such a car might appeal to parents with teenagers and possibly olderdrivers (Harrison, 2003). Finally, it is possible for a company to belong to more than one strategic group. In the hospitality indus- try, Hilton Hotels and Marriott compete in both the high end and affordable ends, through the lower-rate Hampton Inns and Courtyards by Marriott respec- tively. In this illustration, each company, rather than surmount mobility barriers by moving to another stra- tegic group, has penetrated another strategic group through internal diversification and acquisition. Competitive Analysis Strategy began as a military concept. Before going into battle, and during the battle itself, generals would try to find out everything they could about the enemy: their strength in numbers, their weaponry, supplies, communications capability, precise locations, intents, and strategies. To go into a battle with no information Zefa/SuperStock
  • 37. Knowing as much about your competitors as possible is imperative. CHAPTER 4Section 4.1 Industry and Competitive Analysis about the enemy would be to put an army at considerable risk and its chances of success at vir- tually zero. It is only with good intelligence about the enemy—their movements, resources, and strategies—that a general or leader can plan strategy and deploy resources to win the battle or achieve a military objective. The same imperative exists in business today. In virtually every business, companies must be aware of and know how to deal with their competitors. The first step is to ask, “How much do I know about my competitors?” One should know— or try to obtain—at least the following informa- tion about one’s competitors: • Market share—Many industries have publications that track these data, but companies will occasionally have to determine a competitor’s market, or industry, share on their own. • Geographic scope—Are your competitors local, regional, national, or international/global competitors? • Diversification—Are your competitors
  • 38. conglomerates with a portfolio of businesses in unrelated industries, companies with many related businesses, companies with many strategic alliances, or companies in only one business? • Vertical integration—The degree to which competitors are vertically integrated, especially backwards along the supply chain, may give them cost and competitive advantages that can be difficult to overcome. • Competitive advantage—Do your competitors possess a competitive advantage? What is it? How large is it? How have they sustained it? • Core competence—What are the core competences that underlie your competitors’ strategies? • Strategic intent—How are your competitors trying to position themselves in the industry? Are they aggressively trying to overtake rivals on their way to market dominance, or are they more concerned with defending their ranking and maintaining market share? • Strategy—What strategies are your competitors following? In most cases, they can be inferred from other information known about the companies and what they are actually doing. Have the strategies been working, or are they about to be changed? Are mergers among key competitors likely? Are any of them looking to be acquired? If in a high-tech industry, what is their investment in R&D as a
  • 39. percent of sales? • Resources and capabilities—How strong financially and technologically are each of your competitors? How flexible are they to adapting to the changing environment? How well managed? How fast do they bring new products to market? Do they have innovative cul- tures and a record of innovation? Which one just got a new CEO? Trying to get this kind of information about key competitors also reveals how much or how little a company knows about them. Discussion Questions 1. What additional information might an industry analysis give that simply monitoring a company’s competitors does not? After all, isn’t the industry just an aggregate of all competitors? 2. Porter’s five-forces model is a useful tool to analyze the competitive forces and structural char- acteristics of an industry. But isn’t this at best a snapshot at a point in time? How could one get a more dynamic perspective? (continued)
  • 40. CHAPTER 4Section 4.2 Market Analysis 4.2 Market Analysis We now turn to an examination of a company’s customers, which could be companies in another industry, like the auto industry, or individual consumers. A market analysis is an umbrella term covering the collection and analysis of data and information about a company’s customers, which could be companies in another industry or individuals (consumers). While it is relatively straight- forward to get information about a customer industry, getting useful information about consum- ers is more difficult. The demographic or socioeconomic groups of some consumers make them harder to analyze and understand. It is important to keep in mind the target market and degree of market penetration, changing customer needs, and distribution channels and pricing, as discussed in the following sections. Target Market and Market Penetration First consider the target market. For example, if banks buy your product, your market is banks. But are you targeting all banks world- wide (which is the overall market), only the large banks, only neigh- borhood banks, only banks with
  • 41. over $2.0 billion in deposits or over 500 branches, or middle-market banks nationally? Very few com- panies can target the entire popu- lation of their markets although © Fancy Collection / SuperStock Getting specific information about your customers can be more difficult than learning about the industry. 3. Suppose a company has very little bargaining power with suppliers; in fact, its industry also is plagued with weakbargaining power. What are some ways of gaining more bargaining power? 4. What might be a method for identifying an industry’s driving forces other than simply brainstorming? 5. Can a company be more profitable in a concentrated industry (not one of the industry leaders) or a fragmented one? Give your reasons either way. 6. The industry-attractiveness matrix is a highly subjective exercise. So what are the benefits of doing one despite the subjectivity? 7. A strategic-group map groups together strategically similar companies in an industry on a two- dimensional space. Yet, movement from one strategic group to another could experience mobil- ity or entry barriers, different competitors, and
  • 42. significant investment. Does that make each stra- tegic group an industry segment? Explain. 8. Once an industry’s dominant economic characteristics and driving forces have been identified and Porter’s five-forces analysis has been performed, how can the rules of the game for this industry and the critical success factors be discerned? Explain the steps this would take. 9. A critical-success-factor analysis can be very useful to a company in analyzing how it stacks up to its competitors. How might you tell if the numbers used in that analysis are realistic? Is there another kind of analysis you could do that would also yield good comparative data with your competitors? CHAPTER 4Section 4.2 Market Analysis there are exceptions such as Coca-Cola, Microsoft, and so forth. So a company needs to define its target market—what is it, how large is it, and how fast is it growing? It also must decide who is the served market, or that portion of the target market that is either currently served by the company or its current focus.
  • 43. Another factor to establish is the degree of market penetration. How far have all the companies in the industry penetrated the market? In other words, what proportion of the target market has bought a product/service from your industry? If the answer is 60%, the market is said to be 60% penetrated, leaving 40% that is unserved or underserved among them. When a market is 100% penetrated, it is considered saturated. The degree of penetration is, however, more complex than the illustration discussed here. For example, not all of the target market may purchase a product from the industry for various rea- sons—they cannot afford to, don’t need to, and the like. So the target market is often reduced to what is called a served market made up of viable customers who could buy the product or service. Also, though rare, it is possible for markets to be more than 100% penetrated, as when house- holds own more than one TV or car. Changing Customer Needs What are customers’ current needs? From what is known of a company’s customers and industry, can their needs be inferred? And can the degree to which such needs are currently satisfied be
  • 44. assessed? When we speak of “needs,” we mean benefits or what we now term value propositions. Companies that are constantly listening to their customers will know their needs and how they are changing (Ulwick & Bettencourt, 2008). What will the customer need in the future? This is a chicken-and-egg situation. New products and services often affect customers and satisfy needs they never knew they had, and sometimes unsatisfied needs are the spark that causes new products and services to be introduced. Try to address the question How are customers’ needs changing? To the extent that this proves diffi- cult to answer, it indicates whether the company is in touch with its customers or doesn’t know enough about them. Distribution Channels and Pricing The next stage of the market analysis is a consideration of the company’s distribution channels. This means learning how the industry’s products reach the market. One must find out whether the industry typically supplies products to wholesalers, distributors or retail outlets. In some industries it is standard practice to employ salespersons to make direct sales calls while in others catalogs and direct mail are the norm. The extent to which the Internet is used as a distribution
  • 45. channel is increasingly important. Note any differences between the distribution channels the company uses and those used by the industry in general. Another way of looking at this is to ask how customers buy the products. What is the decision process they go through before they decide to buy? An analysis of the distribution channels would not be complete without determining the size of channel markups. That is, for each stage in the distribution channel, what price is paid by the whole- saler, what price by the distributor, what price by the retailer, and what price by the final customer? If volume discounts are expected and offered at each stage, the quantities at which these become CHAPTER 4Section 4.2 Market Analysis applicable and the amount of the discount are key data points. While a company’s profits depend on the price it receives for the product, its competitiveness depends on what the customer will pay. One also needs to establish the degree to which customers are price-sensitive in the target mar- ket. Price sensitivity is critical with respect to
  • 46. how prices are set and changed and, indeed, which distribution channels are used. The following example of the law firm illustrates the importance of knowing how price-sensitive customers are (see Case Study: PriceSensitivity and a Law Firm). Any current trends in customer behavior are vital to an understanding of how the target market may be changing. Are customers buying differently? Are they becoming more demanding? Any other aspect of industry customers not covered elsewhere should be covered here. For example, increasingly, customers of brick-and-mortar bookstores like Barnes & Noble are actually buying their books on Amazon.com. To the extent that a company does business in several markets such as different countries, this type of detailed market analysis should be completed for each of those markets. Companies that target business customers (B2B) would do well to analyze the value chain of their major customers in order to discover which part of it is unserved and take advantage of the opportunity to move in to fill that need (Crain & Abraham, 2008). Case Study Price Sensitivity and a Law Firm A patent-law firm once held a retreat to go through a strategic-planning process. During
  • 47. the process, the partners in attendance maintained that it was the best firm of its kind in the large metropolitan region it served. A review of its finances revealed that its billings (i.e., sales) were flat, a situation that prompted the retreat in the first place. During the competitive-analysis phase, the firm acknowl- edged that it had about five principal competitors, all of which charged higher hourly rates than it did. Reluctantly, the partners finally admitted that hourly rates generally correlated with reputation; the higher the fee charged, the better the firm was perceived to be. Worse, it turned out that several of the firm’s partners were offering discounted rates to clients for fear that they would not even get their business. They expressed the fear that if they raised their rates, the firm would suffer a drastic decline in business. They felt hamstrung. The answer, of course, was that they were either serving the wrong kinds of clients, or they were not as good as they claimed to be. The latter conclusion was perhaps closer to the truth given their discounting behavior. Certainly, the market was not nearly as price-sen- sitive as they thought it was, as evidenced by the fees its competitors were charging—and getting.
  • 48. Discussion Questions 1. Why is defining your target market so difficult? If you agree, suggest how it can be made easier and yield accurate results at the same time. 2. Is distinguishing between “market,” “target market,” and “served market” useful? In what ways? 3. How might you discover that your target market would welcome opportunities to co- create value with your company? CHAPTER 4Section 4.3 Environmental-Trend Analysis 4.3 Environmental-Trend Analysis The almost dizzying pace of change going on in technology and business requires companies to plan differently than they have in the past. In order to keep pace with the rapidly changing environ- ment, companies should divide the environment into categories or manageable pieces and, in each category, try to articulate (a) what is changing and in which direction, and (b) with what impact on the company. If the change has no relevance for the company or for what it might do in the future, then it deserves to be ignored. If a trend cannot be clearly defined
  • 49. in terms of direction (for example, something getting larger or smaller, increasing or decreasing), then it should be omitted. Saying, for example, that the “economy is in a recession” is not useful as a trend. Environmental scanning is a com- mon name given to identifying and analyzing trends that are external to the business (Fahey & Narayanan, 1986). People who engage in it have found that it is easy to get caught up in what they are discovering. Before they know it, they are collecting information for its own sake. Most companies cannot afford that luxury. Again, the search should be confined to trends that are relevant to the company, specifically any trend that affects the company or that may affect it in the future. The currency of the collected data in environmental scanning is a valuable resource. Typically, one can find information on trends using historical data. However, the milieu in which strategic planning takes place, or the period during which the consequences of present decisions play out, is the future. Wavebreakmedia Ltd/Thinkstock Analyzing environmental trends involves looking at what is
  • 50. changing and its potential impact on the company. 4. What surveys would you take of your customers that would help guide what products to produce and how to persuade them to buy? 5. If you were designing a customer-relationship- management (CRM) system, what elements would you include and why? 6. Why is it that customers of highly differentiated companies are not that price- sensitive? 7. Customers buy products because, for the most part, the products satisfy their needs. (The excep- tions are impulse buys.) Are “needs” and the “benefits” they receive from using the product the same thing? 8. List the benefits you might experience from buying each of the following: A movie ticket A logo t-shirt A novel A car An iPod A vacation cruise Flowers for your spouse or date CHAPTER 4Section 4.3 Environmental-Trend Analysis
  • 51. A trend noticed during the 2004–2009 time frame, for example, may have limited value or even none at all in the 2012–2017 time frame. However, if the trend can be extrapolated or extended in a justifi- able manner to the future time frame in question, then it becomes valuable. Nevertheless, firms must be cautious, because some trends are discontinuous, meaning that behavior in the future is different from behavior in the past. While simple extrapolations can be performed by almost anyone, more complex forecasting, such as technological forecasting, must be done by an expert and may require consulting assistance. For such projects, the organization must have the requisite time and resources. The tradeoff between spending resources to do something properly and taking educated guesses when such resources are unavailable is something that the company will have to consider carefully. In many cases, rather than doing the forecasting internally, a firm can find estimated or projected data on trends to fit its future time frame. For example, demographic data taken from census data contain projections for at least 30 years into the future. Whenever using such projections, it is important to know how reliable the source is and, preferably, how the projections were
  • 52. derived. The more critical such data are to the company, the more care the company should exercise to ensure that reliable data and analyses are being used. Economic forecasts, for example, are par- ticularly difficult to verify as to quality; economists can be wrong even for short-term forecasts. Finally, the environmental scan should cover a geographic scope that matches the arena in which the company competes. For example, a distribution company operating and competing only in New Eng- land should pay more attention to what is happening in the New England economy rather than what may be happening nationally. Figure 4.4, for instance, shows the strategic group for the wholesale lumber industry. A large multinational company would have to extend its scan into every country in which it does business (buying, manufacturing, or selling) as well as include exchange rates between those countries and how events or trends in one of the countries might affect any of the others. The international environment is far more complex than dealing with just one country. For example, man- agers in each country are typically asked to complete an environmental analysis in their own country along with other analyses and projections required for strategic planning.
  • 54. Source: Reprinted by permission from the Case Research Journal, Copyright © 1992 by the North American Case Research Association and the author. CHAPTER 4Section 4.3 Environmental-Trend Analysis When conducting an environmental-trend analysis, there are seven common categories that the company should consider: economic, regulatory/legislative, political, demographic, sociocultural, attitude/lifestyle, and technological. No one category is more important than another per se, though certain categories can be more relevant to a particular company and so demand more of its attention. Economic Trends Of the seven categories of trends, we are flooded with opinions and doom-and-gloom prognosti- cations about the economy the most. The news media thrive on stories about how stocks are being buffeted by economic forecasts and events such as bank bailouts or even bailouts of countries like Greece recently. Unless one has a direct financial stake, a lot of such news is just “noise.” Economic data look very different and can provide a more solid feel as to how a country’s economy is faring and how its currency is faring with respect to the world’s major currencies, and hence
  • 55. begin to assess their effect on a company and its future. Economists monitor a number of principal indica- tors to identify trends: • “Structural shift” is a term that describes a trend from an industrial economy to a service economy, or from a predominantly manufacturing to a knowledge-based economy. • Structural variables are factors such as energy costs rising faster than raw material costs, or general or minimum wage rates changing. • Inflation and unemployment rates have historically tended to have an inverse relation- ship; as one goes up, the other typically goes down, and vice versa. Both are affected by fiscal policy controlled by the government and monetary policy controlled by the Federal Reserve Board, which also controls interest rates. • Interest rates are the most watched economic indicator. These reflect the cost of loans, mortgages, and credit, as well as how much savings and certificates of deposit (CDs) can earn. • The consumer price index (CPI) is a relative indicator of how far and how fast prices have risen compared to a base year. • Housing starts are a leading indicator of whether the economy might turn down or up.
  • 56. • Balance of trade is the net difference in value between a country’s exports and imports. A positive figure reflects a trade surplus while a negative figure indicates a trade deficit. The United States has for decades run an annual trade deficit. • Exchange rates reflect the value of one country’s currency against another. A declining value of the U.S. dollar, for example, means that U.S. exports will be more competitive in world markets and imports more expensive, while a rising value of the dollar means that imports will become cheaper and U.S. goods in world markets more expensive. • Personal disposable income is often associated with income data (demographic) and very useful when combined with demographic data such as geographic data, age, and ethnicity. Regulatory/Legislative Trends Regulations differ from laws in that they are made and enforced by city, state, and federal regula- tory agencies whereas legislation refers to laws enacted by state assemblies and Congress. For both laws and regulations, indications of impending changes can be discerned by closeobservation of the political process at the appropriate level of government. Also, rules are made according to well- defined processes that include opportunities for
  • 57. rebuttals by industry or interested parties. CHAPTER 4Section 4.3 Environmental-Trend Analysis • The volume of regulations enacted each year keeps increasing as reflected in the number of pages in the Federal Register devoted to them. • It behooves a company to monitor potential changes to regulations governing the indus- try in which it competes. Some industries, such as railroads and airlines, are so heavily regulated that they are called “regulated industries.” • Many regulations cut across all industries. Examples of these include tax regulations, workplace safety, insider trading, bargaining in good faith in labornegotiations, anticom- petitive practices, and price-fixing. All industries encounter some form of regulation, even those not considered “regulated.” • Deregulation of an industry can have an enormous impact. Examples of deregulated industries are telecommunications and electric power. Other industries such as airlines, banking, and transportation have seen a degree of deregulation. • The merging of industries can have enormous implications for companies in each. An example of this trend has been the convergence of the banking, insurance, and brokerage
  • 58. industries into what is now called financial services. • The standards set by regulation in an industry may change. In the automobile industry, for example, this can be seen in the standards for crash resistance, fuel economy, and exhaust emissions. Other industries are affected by environmental standards for allowable con- centrations of contaminants or impurities in air and water. Labeling requirements on all packaged and processed foods is another such example. • Trade regulations at the international level may impose tariffs or set quotas to limit imports into a country or make imported goods more costly. Regulations may also prohibit the importation of certain agricultural products or require the quarantining of animals to prevent diseases or invasive species from entering the country. • All the preceding regulatory trends affecting an industry may occur at both state and fed- eral levels as well as in many foreign countries. Political Trends Politics is not just for politicians. Politics is about power and the powerless and actions and activi- ties people take to redress perceived inequities. The “Occupy” movement that spread from Wall St. to Main Street in many cities across the country is a stunning example of this.
  • 59. Such trends could have a significant effect on some companies and their perceived public reputation. • The relative influence and power of interest groups in every sphere of economic and social activity in the United States is a matter of growing debate. From professional orga- nizations such as the American Medical Association, to industry groups like the National Association of Manufacturers and demographic collectives exemplified by the American Association of Retired Persons (AARP), interest groups are more organized and more influ- ential than ever before. The term lobbyist is in some circles used as a pejorative giving some indication of the controversial nature of this trend. • Fighting against or demanding enforcement of regulations or laws is a trend observed in the nation’s courtrooms. • The United States has always been a highly litigious society and that trend is only increasing. Demographic Trends This category is important only to companies that market directly to consumers. Because many companies’ products are targeted specifically at demographic groups, monitoring trends in this
  • 60. CHAPTER 4Section 4.3 Environmental-Trend Analysis category is imperative. Demographic trends are by definition concerned with groups identifiable by specific common characteristics such as age, gender, income, national heritage, and many others. • A country’s population growth (or decline) is a demographic trend with implications for most industries. • The growth rate of a particular age group such as the 25–39 or over-65 age group, gives clues as to whether the population of a country is aging or getting younger, or has a “demographic bulge” moving through it. • The geographic distribution of population reveals migration patterns affecting local markets. • Significant trends concerning gender, particularly gender differences, or in conjunction with one or more other demographic characteristics such as age, ethnicity, education, income levels, and others have critical strategic implications in a wide range of industries. • Changes in ethnic mix reveal the extent to which regions or cities are growing more diverse or becoming dominated by one ethnicity. • Data on income levels show patterns of
  • 61. wealth distribution and indicate relative purchas- ing power, especially in combination with geographic data concerning average individual income and household income. • Literacy rates reflect the extent to which a population has received basiceducation and can read its own language. Attitude/Lifestyle Trends This category of trends also concerns only companies targeting consumers. These shed light on how people live—their patterns of living—making the trends highly interrelated with one another as well as with demographic information. These are also an outward manifestation of people’s attitudes and values. • Household formation includes the family structure one chooses to establish such as mar- ried-couple families, one-parent families with either female or male head of household, couples with no children, and gay or lesbian couples. Also of interest is the average num- ber of persons per household. • Trends in the type of work and who is working are important to consumer-oriented indus- tries.For example, the rise of women in the workforce, especially in professional and technical jobs, and the increase of two-income households have had a tremendous effect on spending patterns and the types of products brought to market. Similarly the tendency
  • 62. of more elderly people delaying retirement and continuing to work is a growing trend. • Trends in the type and level of education achieved are significant, particularly when the data are combined with ethnicity, race, and sex demographic variables. • Companies producing for consumers need to be aware of changes in the consumption pat- terns of goods and services, especially homes, durable goods, furnishings, automobiles, clothes, beverages, and personal services and shifts in patterns within each category. • Consumer choices with respect to leisure activities are constantly changing. This includes all types of sports and physical-fitness activities, cultural events, movie attendance, travel, and home-centered activities such as watching network and cable television and videos, reading, gardening—anything people choose to do in their free time. Sociocultural Trends This category focuses on broader changes in society and the extant culture and becomes impor- tant only if societal or cultural changes might affect the business. For example, producing a movie CHAPTER 4Section 4.3 Environmental-Trend Analysis
  • 63. that may not be suitable for young people and therefore is rated NC-17, could in turn translate to lower revenues at the box office. • Changes in social regulations—such as increases in consumer and environmental protec- tion, changes in Supreme Court rulings, trend of the courts deciding issues that the politi- cal process cannot. • Changing social expectations are constantly in flux. Businesses need to be aware of and prepared to respond to evolving consumer values across a wide range of issues. Examples include changing attitudes toward work, rising consumer demands, greater acceptance of sex and violence in popular culture, a growing emphasis on personal health and physical fitness, and increasing activism among women and minority groups. • Changes in economic values have come to the fore recently, most evident in the genesis of the Tea Party and Occupy movements. Many people have expressed increasing concern with how economic benefits are distributed in society and how people are taxed. It can be argued that there is less acceptance of economic growth today as an unqualified benefit to society. • Changes in political priorities affect entire industries and even regions of the country. For
  • 64. example, choices made between defense versus nondefense appropriations will be of tre- mendous concern to any business that supplies the military or is located in regions where aerospace contractors or military bases are located. Technological Trends This category covers the entire swath of technology, from new energy sources, communication technologies, health care modalities and cures, food, agriculture, product and process innova- tions, and so on. Clearly, high-tech or technology- based companies must be current on technolog- ical developments in their fields and how those advances affect people, businesses, and society. In rapidly changing fields, it is possible to detect early signs of new technologies by going to pro- fessional-society meetings and listening to presentations on new processes and techniques, which often precede their introduction by several years. • The pace of change of basicscience or research is manifest in the number and nature of new patents applied for and issued. • The number and location of new companies formed to exploit new technologies and products based on new technologies are indicators of technology trends. • Changes in the average percentage of sales
  • 65. spent on research and development (R&D) in a particular high-technology industry and for particular competitors, if publicly held are critical trends for companies to monitor. • Trends in technology diffusion describe changes in the time required for a new technology to become accepted in general use. • Innovation lag indicates the period between when the scientific solution to a technologi- cal need is first recognized and the emergence of the first viable product using the solu- tion technology and its successor. A careful analysis of all relevant environmental trends will provide a company with an indication of strategic opportunities, that is, trends that might have a strong positive impact on the company, and looming threats or trends that might have a strong negative impact on the company. Envi- ronmental scanning should not be limited only to the period immediately preceding a strategic- planning session. Ideally, environmental scanning should be an ongoing, year-round activity done CHAPTER 4Summary by many people throughout the organization. If done year-round, it would be unlikely that
  • 66. the company would be blindsided by any changes in its environment—and it would also be one of the first to notice opportunities as they arise. This last point is worth emphasizing, because the earlier an opportunity is noticed, the more lead time the company would have to exploit it. Clearly, trends that have an immediate impact within the planning horizon—whether the impact is positive or negative—should receive the greatest attention. Trends that require a longer time to affect the company beyond the planning horizon are correspondingly less important but should nevertheless be monitored. Trends that have no impact on the company should be ignored. Summary This chapter explored the importance of and tools to help in analyzing a company’s external envi- ronment—its industry, competitors, markets, and general environment. Several useful tools for doing an industry and competitive analysis were presented and discussed, including Porter’s five-forces model, industry- attractiveness matrix, strategic-group maps, and critical-success-factor analysis. In addition, identifying the industry’s dominant economic charac- teristics and driving forces add to one’s knowledge about the industry and how it
  • 67. might be chang- ing—critical knowledge when deciding what strategy to pursue. Discussion Questions 1. Which environmental categories most need scanning if your company: Produces cell phones? Is a mass merchandiser? Produces steel tubing? Supplies lumber for the construction industry? Is a four-year university? Publishes books? Sells nutritional supplements online? 2. List some sources of information for each category of environmental scanning. 3. We know why environmental scanning is considered part of strategic planning, but why is it part of strategic thinking? 4. Economic and demographic data are often quantitative, which makes it easier to identify trends and their impact on the company. But attitude and lifestyle and sociocultural trends are “soft,” subjective, and elusive. How can one understand better what’s going on in these areas? 5. Scanning the technological environment is difficult for anyone but scientists or engineers in the field. Realizing what’s happening today in
  • 68. this environment is too late, because develop- ing technology takes years. How can one find out now what might be developing several years from now? 6. Assessing threats is a critical part of an external analysis that should precede, or be a part of, the strategic-planning process. But the world is not “convenient” in this respect. Forces that may adversely affect the company are constantly changing. How can a company monitor these so that it is never caught unawares? 7. What happens when threats are underestimated? Whose fault is it? Discuss. CHAPTER 4Summary An industry sells its products or services to customers, so a key part of the external analysis is finding out all one can about a company’s customers (market). Included in a market analy- sis is distinguishing between a market, target market, and served market (which could be a niche), determining the size of it and whether it is growing (not to be confused with industry growth rate), how far the market is penetrated, what customers’ needs are and whether these are changing, the distribution channels used, whether the market is price-sensitive, and any
  • 69. relevant trends, for example, in buying habits. The chapter then provides a discussion and pointers to scan the general environment for any changes or trends that might favor (opportunities) or adversely affect (threats) the company. The general environment includes seven categories, not all of which are relevant to any one company: economic, regulatory/legislative, political/legal, demographic, attitude/lifestyle, sociocultural, and technological. Key Terms bargaining power An ability to dictate the terms—price, delivery, quality, and the like—in a trading negotiation. concentrated industry One in which a few firms in the industry account for a large por- tion of total industry sales (opposite of frag- mented industry). critical success factors (CSFs) What a company must do well in order to succeed in the indus- try; however, they attach to an industry, not a company (think of them as constituting “rules of the industry”). distribution channel How a product finally reaches the customer (can include directly via salespeople, wholesalers, distributors, retail- ers, mail order, and the Internet).
  • 70. driving forces Trends responsible for how an industry is changing. entry barriers Factors that could, if sufficiently high (like capital required, distribution chan- nels, brand reputation, technological know- how, etc.), prevent a company from entering an industry. fragmented industry One in which no one firm has more than a fraction of a percent in mar- ket share (opposite of concentrated industry). industry attractiveness matrix A weighted technique based on a number of factors to determine how attractive an industry is. industry attractiveness (I.A.) index The final result achieved from using the industry- attractiveness matrix, usually expressed as a percentage. market analysis An umbrella term covering the collection and analysis of data and information about a company’s customers, which could be companies in another industry or individuals (consumers). market penetration The proportion of a mar- ket that has bought a product/service from the industry (can vary from 0 for a brand new market to 100% and beyond, as when people own more than one car or TV).
  • 71. Porter’s five-forces model An analytical tool developed by and named after Michael E. Porter to assess the five sources of competi- tive threat extant in an industry and causes of industry profitability. price sensitivity How sensitive buyers are to variations in price. If a slight drop in price causes customers to buy, they are very price- sensitive; if price goes up a lot and customers still buy, they are not at all price-sensitive. CHAPTER 4Summary served market That portion of the target mar- ket that is currently served by the company or is the focus of the company. strategic-group map A technique to cluster, in a two-dimensional space, strategically similar competitors in industries, especially useful when industries contain disparate competitors. target market The group of customers tar- geted by a company (could be companies or consumers, domestic or international).