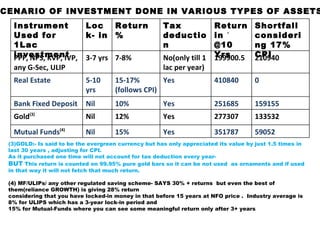
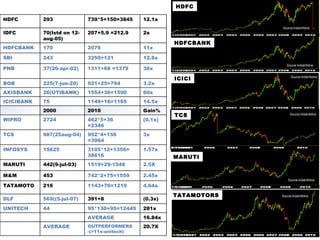
(3)GOLD:- Is said to be the evergreen currency but has only appreciated its value by just 1.5 times in last 30 years , adjusting for CPI.  As it purchased one time will not account for tax deduction every year-  BUT  This return is counted on 99.95% pure gold bars so it can be not used  as ornaments and if used in that way it will not fetch that much return. (4) MF/ULIPs/ any other regulated saving scheme- SAYS 30% + returns  but even the best of them(reliance GROWTH) is giving 28% return  considering that you have locked-in money in that before 15 years at NFO price .  Industry average is 8% for ULIPS which has a 3-year lock-in period and  15% for Mutual-Funds where you can see some meaningful return only after 3+ years SCENARIO OF INVESTMENT DONE IN VARIOUS TYPES OF ASSETS Instrument Used for 1Lac investment Lock- in Return % Tax deduction Return in  `  @10 Yrs Shortfall considering 17% CPI PPF, NPS, KVP, IVP, any G-Sec, ULIP 3-7 yrs 7-8% No(only till 1 lac per year)  199900.5 210940 Real Estate 5-10 yrs 15-17% (follows CPI) Yes 410840 0 Bank Fixed Deposit Nil 10% Yes 251685 159155 Gold (3) Nil 12% Yes 277307 133532 Mutual Funds (4) Nil 15% Yes 351787 59052
Family includes (1)Mother  (2)Father (3)You  (4)Your Spouse (5&6) Children's i.e  1LAC  initially invested for 10 years  in Equity (@19-just  passive  investing) will be  478544   &   410840  is needed to have same purchasing power considering 17% CPI-  CLEAR  SURPLUS  of  67704 . OTHER TYPS OF ASSETS AR UNABLE TO MAINTAIN YR PURCHASING POWR, WHILE EQUITIES DO. Return /month /1Lac ACTIVE  INVESTING Total  Expense (Insurance cover for ALL) Returns after all expenses Effective yield  After covering yr Family to most Financial disastrs 2 1212322 #Life insurance ( Term insurance .  +   ADBR  &  WOP riders )  @ 60 X  of earning  for  earning  member -- Now@15600(6% incr. /yr.)  ---------- 393-596/month   #  Medical insurance For whole family ------- 1215-1936/month #  Home insurance  ---------  600-1100/month 251827 ~10.9 2.5 2245673 791687 ~25.85 3 4144673 1898947 ~38.68 3.5 7629289 4096686 ~51.07 4 14002344 8363063 ~63.23
Equity Markets  are compounding with  13 % YOY for last  20  years –considering NIFTY (Benchmark) – NIFTY moved from  1550  in  2000   to  6274  on  2008   which can be calculated as  19  % YOY compounded and  has  Double  from  2700   from  MAR 2009  in this 17 months   Its futures movement in line with past performance can be supported by  ( 1 )Correction and bounce-back has clearly indicated that this is inherent level of Indian economy as on now,  +  the supporting trend is seen in  ( 2 ) Inherent ability of Indian Economy to grow to trillion dollar economy  ( LOWER CHART IN SLIDE 6 ) ( 3 )Private Investment(mostly FDI)  ( UPPER  CHART IN SLIDE 7 )   AND by investing more than  45623 Cr in equity  till sep-10 due  to increased confidence in INDIAN system  enhancing liquidity  DUE TO  Stable government Deregulation of PETROL and (Proposed) DIESEL,  Bar association regulation and  Infrastructure development for boost up of inland trade and global trade which are making INDIA at par with international system where only and only performance is counted. ( 4 ) SENSEX ROE   ( LOWER CHART IN SLIDE 7 ) ( 5 )SENSEX EPS  ( UPPER CHART IN SLIDE 8 ) ( 6 )IIP(Index of industrial production) movements back to original trend)  ( LOWER CHART IN SLIDE 8 ) ( 7)HOUSEHOLD INCOME,  ( UPPER CHART IN SLIDE 9 ) (8)SAVINGS LEVEL  ( LOWER CHART IN SLIDE 9 ) (9)General Economy uptrend  ( UPPER CHART IN SLIDE 10 ) (10)GOVT. SUPPORT TO BOOST ECONOMY (FREIGHT CORRIDOR)  ( LOWER CHART IN SLIDE 10 ) (11)PORTS level of Traffic  ( SLIDE 11 ) (12)HEALTH CARE  ( UPPER CHARTS IN SLIDE 12 ) (13)Secior wise PAT (CAGR)  ( LOWER  CHARTS IN SLIDE  12 ) (14) Govt. also took out >50% of stimulus given, which was just 8% of the American  govt. stimulus given in there country.
ONGC GAIL BHEL STER SOURCE-INDIAINFOLINE DETAILS OF PAST PERFORMANCE Source-IndiaInfoline Source-IndiaInfoline Source-IndiaInfoline Source-IndiaInfoline NIFTY Source-nseindia TATASTEEL NIFTY 1550 6179 AMBUJA 335(spl 10:2) 7.5*144+111=1011 2x ACC 268 1033+190 div =1034 3.5x ONGC 205 1389*1.5+231=2314 10.3x RIL 345 1033*2+68=2135 5.2x GAIL 65(IPO) 492*1.5+47.25=785.25 11x BPCL 407 663+43=809 0.98x LT 597 2069*4+92.5=8368 13x ABB 262 775*5+50=3675 16.8x RANBAXY 974 447+25.5=462.5 (0.5x) BHEL 224 2498*2+133=5129 22.3x 2000 2010 Gain% SUNPHAR 1760 2047*4 +54=8242 3.6x CIPLA 1380 330*7.5+92.5=2567 0.86x TATASTEEL 148 679+81=760 4.3x HINDALCO 851 210*10+28=2128 1.5x STER 452(listed on 28-may-04) 176*40+171=7211 14.95x BHARTIARTL 44(18-feb-02) 355*2+15=732 15.4x RCOM 291(6-mar-06) 176.9 (0.4x) IDEA 121(9-mar--07) 72.8 (0.4x)
HDFC TCS ICICI HDFCBANK TATAMOTORS MARUTI Source-IndiaInfoline Source-IndiaInfoline Source-IndiaInfoline Source-IndiaInfoline Source-IndiaInfoline Source-IndiaInfoline HDFC 293 739*5+150=3845 12.1x IDFC 70(lstd on 12-aug-05) 207+5.9 =212.9 2x HDFCBANK 170 2076 11x SBI 243 3250+121 12.8x PNB 37(26-apr-02) 1311+68 =1379 36x BOB 225(7-jun-20) 921+25=794 3.2x AXISBANK 26(UTIBANK) 1554+36=1590 60x ICICIBANK 75 1149+16=1165 14.5x 2000 2010 Gain% WIPRO 2724 462*5+36 =2346 (0.1x) TCS 987(25aug-04) 952*4+156 =3964 3x INFOSYS 15625 3105*12+1356= 38616 1.57x MARUTI 442(9-jul-03) 1519+29-1548 2.5X M&M 453 742*2+75=1559 2.45x TATAMOTO 216 1143+76=1219 4.64x DLF 569((5-jul-07) 391+8 (0.3x) UNITECH 44 95*130+95=12445 281x AVERAGE 16.84x AVERAGE OUTPERFORMERS (>11x-unitech) 20.7X
Details of GROWTH POTENTIAL in INDIA— Recap of India’s NTD (Nxt Trilion $)  Era Geography tells us INDIA is only country in whole world comprising about 200 countries enriched with all resources, metals, minerals, spices, rivers, crude oil, etc. etc. All other  countries have one or very few. We are also fortunate in having excellent human resources  for both blue collar and white collar jobs.  Also we had & have superb scientists for the needed R&D. RESILIENCE OF FUTURE PERFORMANCE 60 years for first US$ 1 trillion of GDP 6 years for NTD
 
Total Purchase in SEP only in equity by FII were 27+ CR IIP fell due to global recession but again  was inline
At 40% of GDP, India’s savings could hit US$1 TN in 7-8 years
 
Since jan-09 FII has pumped ~49B in Indian Stock markets but till now it had not reached the level of ownership of FII that was reached in September-07(19%). Of this ~47Bn,  69% has gone into paper issues(48%IPO/FPO  And  28% QIP), CEMENT   (JAIPRAKASH, INDIACEM, MADRASCEM),  AUTO   (HEROHONDA, BHARATFORGE), FMCG  (UNITEDSPIRITS, GODREJCP),  PHARMA   (SUNPHARMA, CIPLA, DIVISLAB),  INFRA   (HDIL, CENTURYTEX) METAL   (STERLITE, TATASTEEL, HINDZINC),  POWER  (JSWPOWER, TATAPOWER, RPOWER, POWERGRID),  ENGG   (BHEL, BEL, ENGINERSIND ),  REALTY  (HDIL, CENTURYTEX), BFI FMCG   (HINDLEVER, GODREJCP),  BFSI   (ICICC,PNB, KOTAK, BOB), CEMENT),  PHARMA   (SUNPHARMA, CADILA, PIRAMAL) MEDIA   (DBCORP),  REALTY  (DLF, UNITECH) DII IT   (TCS, OFSS, EDUCOMP),  TELECOM  (BHARTI, RCOM, IDEA, GTL,GTLINFRA),  OIL   (ONGC, IOC, CAIRN) REALTY  (DLF, UNITECH, HDIL) AUTO   (TATAMOTORS, HEROHONDA,EXIDE), METALS  (TATASTEEL, JSWSTEEL),  BFSI  (SBI, HDFC, IDFC, ICICI, LICHSG, BOB, REC),  PHARMA (RANBXY, LUPIN,GLENMRK, DIVISLAB), POWER  (NTPC, ADANI, JPWR,TATAPWR, ONGC),  FMCG  (ITC, HINDLEVER, UNITDSPIRITS, DABUR) FII (ex- Adr/ Gdr) Least preferred Most preferred
The scenario for Indian Economy in general has undoubtedly improved to an extent, after political stability in country along with  easing liquidity situation and the offshoots of  recovery in global economy.  This is done in view to connect major clusters of India and to make freight corridor for ease of transportation of manufactured goods to the end-user
P O R T S
 
Best cities to work Surat Bangalore Ahmedabad has created jobs after this recession in tune with Bombay and Delhi In VADODARA, you can find people working from every part of India. This indicates the good picture of our cosmopolitan city. Chennai Hyderabad Mumbai Pune Delhi Gurgaon Noida Chandigarh 9 Emerging Cities of India Pune Ahmedabad Chandigarh  Goa Indore Jaipur Kochi Nagpur Vadodara Best cities to work, play and live  1 Gurgaon  2 Chandigarh  3 Chennai  4 Hyderabad 5 Mumbai 6 Noida 7 Bangalore 8 Pune  9 Surat 10 Ahmedabad 11 Vadodara  12  Coimbatore 13  Delhi  14 Nashik  15 Faridabad 16 Kolkata 17 Nagpur 18 Visakhapatnam 19 Kochi 20 Jamshedpur
## I  am  confident  to  handle  your  financial  portfolio  needs  effectively  as  I  have experience  in  diversifying  it  in  various  instruments  as  per  risk/return  appetite  of  an individual. ## Have  experienced  in  getting  good  return  investing  in  equities  &  believes  that life  insurance(TERM), + Medical,  Accident & Household insurance  is  necessary  for  an individual ##   I am safe trader & have good grip on taking new positions in counters which are looking  technically sound & am periodically wounding up position to ensure that risk taken gets diminished. ## EQUITY MARKETS INVESTMENTS give LIQUIDITY like no other assets give ## Even Gold can be considered at par (or below) with it  AS whatever/whenever  you  sell(reasonable big quantity)  legally,  you  get the  amount  in  Cheque  that  can  be  reflected  in  your  account  ledger  atleast  after  12  hours. While  stock  market  transactions  can  be  made  online  where  you  can  pay  instantly  and similarly  redeem  instantly  through  NET  BANKING.  .  ## And since trading in scripts that are in Futures you can be assured of high liquidity and an impact cost of at-most 0.02% So 1LAC invested for 10 yrs  in Equity can be compounded to   478544  &  410840   is needed to have same purchasing power at end considering  17%   CPI-  CLEAR   SURPLUS   of   67704 . Portfolio Advisory Service (PAS), as name suggests, is specialized advisory service for retail investors. Those availing  service pay specific fee for professional advice given by   PORTFOLIO ADVISOR ,  that’s ME  ( ZOHAR )……..
The burden of monitoring portfolio, on daily basis, is  removed .  As done by advisor(PAS). In PAS the advisor comes up with entry and exit levels by which you don’t miss upon any opportunity to make money. The monitoring of your portfolio provides timely advice for appropriate rebalancing of the portfolio in a volatile markets which optimizes returns. The flip side If the investor does not implement the advice given by the advisor on time, the investor may stand to lose (or gain) depending on the market situation.  So, execution is the key and  inaction (or unneeded action ) on part of investor may work both ways. ZOHAR   BATTERYWALA 9429927829  [email_address] PAS PMS Investor does not pay any amount to invest. Investor has to pay money upfront. Client invests in his own name The investments are done in portfolio manager’s firm. Investor has total control on decisions as the advice is discretionary. Investor has no control on decision-making as it is non-discretionary Investor may accept or reject the advice of the advisor. Investor may or may not consult the advisor. Client can buy or sell securities as and when he decides. The portfolio manager may churn the portfolio often to earn more brokerage. Can select his own broker No such choice available.

Generali

  • 1.
    (3)GOLD:- Is saidto be the evergreen currency but has only appreciated its value by just 1.5 times in last 30 years , adjusting for CPI. As it purchased one time will not account for tax deduction every year- BUT This return is counted on 99.95% pure gold bars so it can be not used as ornaments and if used in that way it will not fetch that much return. (4) MF/ULIPs/ any other regulated saving scheme- SAYS 30% + returns but even the best of them(reliance GROWTH) is giving 28% return considering that you have locked-in money in that before 15 years at NFO price . Industry average is 8% for ULIPS which has a 3-year lock-in period and 15% for Mutual-Funds where you can see some meaningful return only after 3+ years SCENARIO OF INVESTMENT DONE IN VARIOUS TYPES OF ASSETS Instrument Used for 1Lac investment Lock- in Return % Tax deduction Return in ` @10 Yrs Shortfall considering 17% CPI PPF, NPS, KVP, IVP, any G-Sec, ULIP 3-7 yrs 7-8% No(only till 1 lac per year) 199900.5 210940 Real Estate 5-10 yrs 15-17% (follows CPI) Yes 410840 0 Bank Fixed Deposit Nil 10% Yes 251685 159155 Gold (3) Nil 12% Yes 277307 133532 Mutual Funds (4) Nil 15% Yes 351787 59052
  • 2.
    Family includes (1)Mother (2)Father (3)You (4)Your Spouse (5&6) Children's i.e 1LAC initially invested for 10 years in Equity (@19-just passive investing) will be 478544 & 410840 is needed to have same purchasing power considering 17% CPI- CLEAR SURPLUS of 67704 . OTHER TYPS OF ASSETS AR UNABLE TO MAINTAIN YR PURCHASING POWR, WHILE EQUITIES DO. Return /month /1Lac ACTIVE INVESTING Total Expense (Insurance cover for ALL) Returns after all expenses Effective yield After covering yr Family to most Financial disastrs 2 1212322 #Life insurance ( Term insurance . + ADBR & WOP riders ) @ 60 X of earning for earning member -- Now@15600(6% incr. /yr.) ---------- 393-596/month # Medical insurance For whole family ------- 1215-1936/month # Home insurance --------- 600-1100/month 251827 ~10.9 2.5 2245673 791687 ~25.85 3 4144673 1898947 ~38.68 3.5 7629289 4096686 ~51.07 4 14002344 8363063 ~63.23
  • 3.
    Equity Markets are compounding with 13 % YOY for last 20 years –considering NIFTY (Benchmark) – NIFTY moved from 1550 in 2000 to 6274 on 2008 which can be calculated as 19 % YOY compounded and has Double from 2700 from MAR 2009 in this 17 months Its futures movement in line with past performance can be supported by ( 1 )Correction and bounce-back has clearly indicated that this is inherent level of Indian economy as on now, + the supporting trend is seen in ( 2 ) Inherent ability of Indian Economy to grow to trillion dollar economy ( LOWER CHART IN SLIDE 6 ) ( 3 )Private Investment(mostly FDI) ( UPPER CHART IN SLIDE 7 ) AND by investing more than 45623 Cr in equity till sep-10 due to increased confidence in INDIAN system enhancing liquidity DUE TO Stable government Deregulation of PETROL and (Proposed) DIESEL, Bar association regulation and Infrastructure development for boost up of inland trade and global trade which are making INDIA at par with international system where only and only performance is counted. ( 4 ) SENSEX ROE ( LOWER CHART IN SLIDE 7 ) ( 5 )SENSEX EPS ( UPPER CHART IN SLIDE 8 ) ( 6 )IIP(Index of industrial production) movements back to original trend) ( LOWER CHART IN SLIDE 8 ) ( 7)HOUSEHOLD INCOME, ( UPPER CHART IN SLIDE 9 ) (8)SAVINGS LEVEL ( LOWER CHART IN SLIDE 9 ) (9)General Economy uptrend ( UPPER CHART IN SLIDE 10 ) (10)GOVT. SUPPORT TO BOOST ECONOMY (FREIGHT CORRIDOR) ( LOWER CHART IN SLIDE 10 ) (11)PORTS level of Traffic ( SLIDE 11 ) (12)HEALTH CARE ( UPPER CHARTS IN SLIDE 12 ) (13)Secior wise PAT (CAGR) ( LOWER CHARTS IN SLIDE 12 ) (14) Govt. also took out >50% of stimulus given, which was just 8% of the American govt. stimulus given in there country.
  • 4.
    ONGC GAIL BHELSTER SOURCE-INDIAINFOLINE DETAILS OF PAST PERFORMANCE Source-IndiaInfoline Source-IndiaInfoline Source-IndiaInfoline Source-IndiaInfoline NIFTY Source-nseindia TATASTEEL NIFTY 1550 6179 AMBUJA 335(spl 10:2) 7.5*144+111=1011 2x ACC 268 1033+190 div =1034 3.5x ONGC 205 1389*1.5+231=2314 10.3x RIL 345 1033*2+68=2135 5.2x GAIL 65(IPO) 492*1.5+47.25=785.25 11x BPCL 407 663+43=809 0.98x LT 597 2069*4+92.5=8368 13x ABB 262 775*5+50=3675 16.8x RANBAXY 974 447+25.5=462.5 (0.5x) BHEL 224 2498*2+133=5129 22.3x 2000 2010 Gain% SUNPHAR 1760 2047*4 +54=8242 3.6x CIPLA 1380 330*7.5+92.5=2567 0.86x TATASTEEL 148 679+81=760 4.3x HINDALCO 851 210*10+28=2128 1.5x STER 452(listed on 28-may-04) 176*40+171=7211 14.95x BHARTIARTL 44(18-feb-02) 355*2+15=732 15.4x RCOM 291(6-mar-06) 176.9 (0.4x) IDEA 121(9-mar--07) 72.8 (0.4x)
  • 5.
    HDFC TCS ICICIHDFCBANK TATAMOTORS MARUTI Source-IndiaInfoline Source-IndiaInfoline Source-IndiaInfoline Source-IndiaInfoline Source-IndiaInfoline Source-IndiaInfoline HDFC 293 739*5+150=3845 12.1x IDFC 70(lstd on 12-aug-05) 207+5.9 =212.9 2x HDFCBANK 170 2076 11x SBI 243 3250+121 12.8x PNB 37(26-apr-02) 1311+68 =1379 36x BOB 225(7-jun-20) 921+25=794 3.2x AXISBANK 26(UTIBANK) 1554+36=1590 60x ICICIBANK 75 1149+16=1165 14.5x 2000 2010 Gain% WIPRO 2724 462*5+36 =2346 (0.1x) TCS 987(25aug-04) 952*4+156 =3964 3x INFOSYS 15625 3105*12+1356= 38616 1.57x MARUTI 442(9-jul-03) 1519+29-1548 2.5X M&M 453 742*2+75=1559 2.45x TATAMOTO 216 1143+76=1219 4.64x DLF 569((5-jul-07) 391+8 (0.3x) UNITECH 44 95*130+95=12445 281x AVERAGE 16.84x AVERAGE OUTPERFORMERS (>11x-unitech) 20.7X
  • 6.
    Details of GROWTHPOTENTIAL in INDIA— Recap of India’s NTD (Nxt Trilion $) Era Geography tells us INDIA is only country in whole world comprising about 200 countries enriched with all resources, metals, minerals, spices, rivers, crude oil, etc. etc. All other  countries have one or very few. We are also fortunate in having excellent human resources  for both blue collar and white collar jobs. Also we had & have superb scientists for the needed R&D. RESILIENCE OF FUTURE PERFORMANCE 60 years for first US$ 1 trillion of GDP 6 years for NTD
  • 7.
  • 8.
    Total Purchase inSEP only in equity by FII were 27+ CR IIP fell due to global recession but again was inline
  • 9.
    At 40% ofGDP, India’s savings could hit US$1 TN in 7-8 years
  • 10.
  • 11.
    Since jan-09 FIIhas pumped ~49B in Indian Stock markets but till now it had not reached the level of ownership of FII that was reached in September-07(19%). Of this ~47Bn, 69% has gone into paper issues(48%IPO/FPO And 28% QIP), CEMENT (JAIPRAKASH, INDIACEM, MADRASCEM), AUTO (HEROHONDA, BHARATFORGE), FMCG (UNITEDSPIRITS, GODREJCP), PHARMA (SUNPHARMA, CIPLA, DIVISLAB), INFRA (HDIL, CENTURYTEX) METAL (STERLITE, TATASTEEL, HINDZINC), POWER (JSWPOWER, TATAPOWER, RPOWER, POWERGRID), ENGG (BHEL, BEL, ENGINERSIND ), REALTY (HDIL, CENTURYTEX), BFI FMCG (HINDLEVER, GODREJCP), BFSI (ICICC,PNB, KOTAK, BOB), CEMENT), PHARMA (SUNPHARMA, CADILA, PIRAMAL) MEDIA (DBCORP), REALTY (DLF, UNITECH) DII IT (TCS, OFSS, EDUCOMP), TELECOM (BHARTI, RCOM, IDEA, GTL,GTLINFRA), OIL (ONGC, IOC, CAIRN) REALTY (DLF, UNITECH, HDIL) AUTO (TATAMOTORS, HEROHONDA,EXIDE), METALS (TATASTEEL, JSWSTEEL), BFSI (SBI, HDFC, IDFC, ICICI, LICHSG, BOB, REC), PHARMA (RANBXY, LUPIN,GLENMRK, DIVISLAB), POWER (NTPC, ADANI, JPWR,TATAPWR, ONGC), FMCG (ITC, HINDLEVER, UNITDSPIRITS, DABUR) FII (ex- Adr/ Gdr) Least preferred Most preferred
  • 12.
    The scenario forIndian Economy in general has undoubtedly improved to an extent, after political stability in country along with easing liquidity situation and the offshoots of recovery in global economy. This is done in view to connect major clusters of India and to make freight corridor for ease of transportation of manufactured goods to the end-user
  • 13.
    P O RT S
  • 14.
  • 15.
    Best cities towork Surat Bangalore Ahmedabad has created jobs after this recession in tune with Bombay and Delhi In VADODARA, you can find people working from every part of India. This indicates the good picture of our cosmopolitan city. Chennai Hyderabad Mumbai Pune Delhi Gurgaon Noida Chandigarh 9 Emerging Cities of India Pune Ahmedabad Chandigarh Goa Indore Jaipur Kochi Nagpur Vadodara Best cities to work, play and live 1 Gurgaon 2 Chandigarh 3 Chennai 4 Hyderabad 5 Mumbai 6 Noida 7 Bangalore 8 Pune 9 Surat 10 Ahmedabad 11 Vadodara 12 Coimbatore 13 Delhi 14 Nashik 15 Faridabad 16 Kolkata 17 Nagpur 18 Visakhapatnam 19 Kochi 20 Jamshedpur
  • 16.
    ## I am confident to handle your financial portfolio needs effectively as I have experience in diversifying it in various instruments as per risk/return appetite of an individual. ## Have experienced in getting good return investing in equities & believes that life insurance(TERM), + Medical, Accident & Household insurance is necessary for an individual ## I am safe trader & have good grip on taking new positions in counters which are looking technically sound & am periodically wounding up position to ensure that risk taken gets diminished. ## EQUITY MARKETS INVESTMENTS give LIQUIDITY like no other assets give ## Even Gold can be considered at par (or below) with it AS whatever/whenever you sell(reasonable big quantity) legally, you get the amount in Cheque that can be reflected in your account ledger atleast after 12 hours. While stock market transactions can be made online where you can pay instantly and similarly redeem instantly through NET BANKING. . ## And since trading in scripts that are in Futures you can be assured of high liquidity and an impact cost of at-most 0.02% So 1LAC invested for 10 yrs in Equity can be compounded to 478544 & 410840 is needed to have same purchasing power at end considering 17% CPI- CLEAR SURPLUS of 67704 . Portfolio Advisory Service (PAS), as name suggests, is specialized advisory service for retail investors. Those availing service pay specific fee for professional advice given by PORTFOLIO ADVISOR , that’s ME ( ZOHAR )……..
  • 17.
    The burden ofmonitoring portfolio, on daily basis, is removed . As done by advisor(PAS). In PAS the advisor comes up with entry and exit levels by which you don’t miss upon any opportunity to make money. The monitoring of your portfolio provides timely advice for appropriate rebalancing of the portfolio in a volatile markets which optimizes returns. The flip side If the investor does not implement the advice given by the advisor on time, the investor may stand to lose (or gain) depending on the market situation. So, execution is the key and inaction (or unneeded action ) on part of investor may work both ways. ZOHAR BATTERYWALA 9429927829 [email_address] PAS PMS Investor does not pay any amount to invest. Investor has to pay money upfront. Client invests in his own name The investments are done in portfolio manager’s firm. Investor has total control on decisions as the advice is discretionary. Investor has no control on decision-making as it is non-discretionary Investor may accept or reject the advice of the advisor. Investor may or may not consult the advisor. Client can buy or sell securities as and when he decides. The portfolio manager may churn the portfolio often to earn more brokerage. Can select his own broker No such choice available.