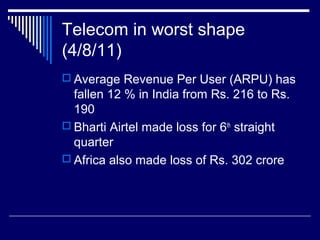
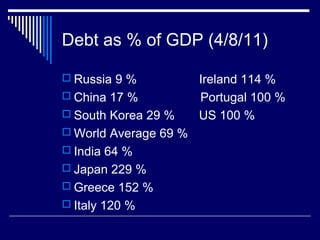
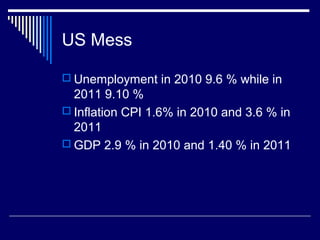
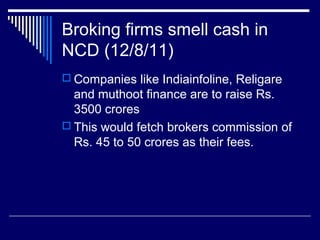
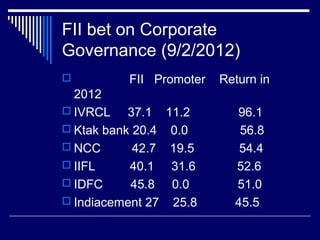
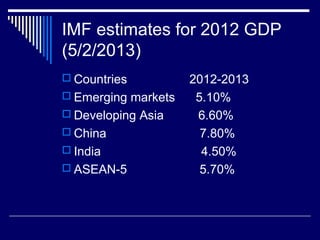
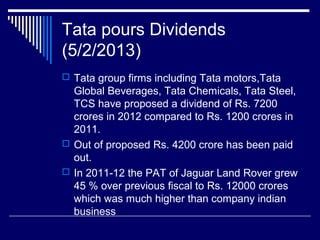
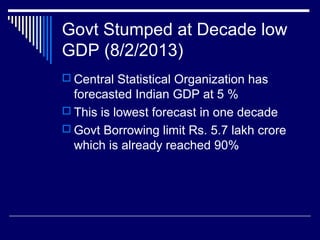
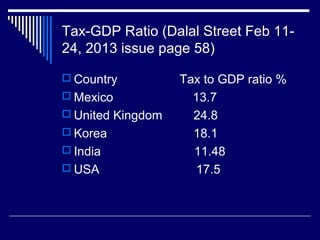
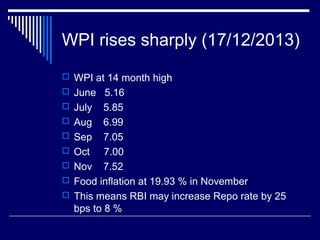
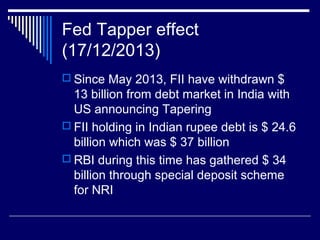
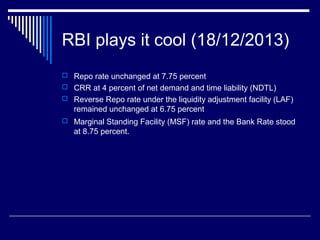
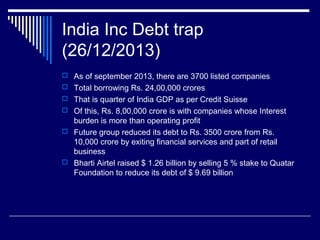
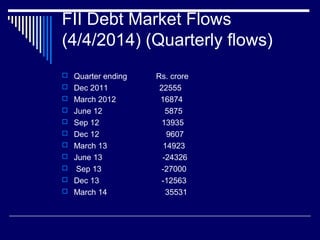
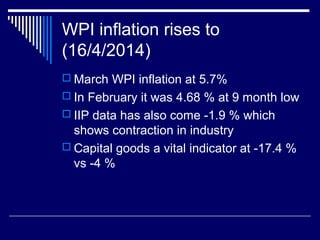
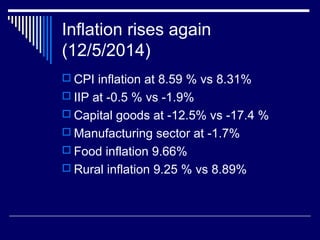
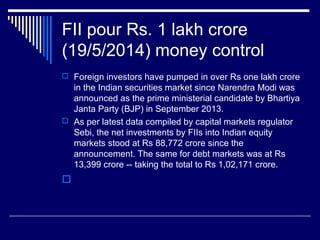
Download to read offline

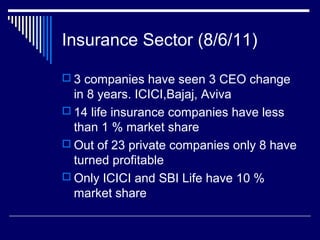


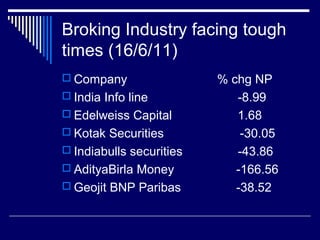


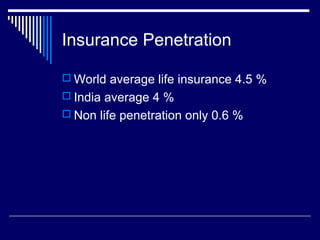

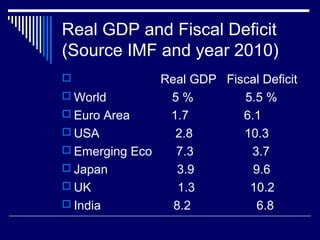


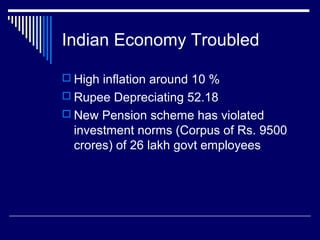


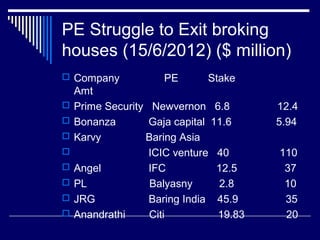


The document discusses developments in the Indian economy and insurance sector based on information presented between June 8-July 1, 2011. It notes that only 8 of 23 private insurance companies have turned profitable, while ICICI and SBI Life control 10% of the market each. It also discusses rising inflation in India and China, challenges facing the Indian fiscal deficit and GDP growth targets, and declining profits in the broking industry.


