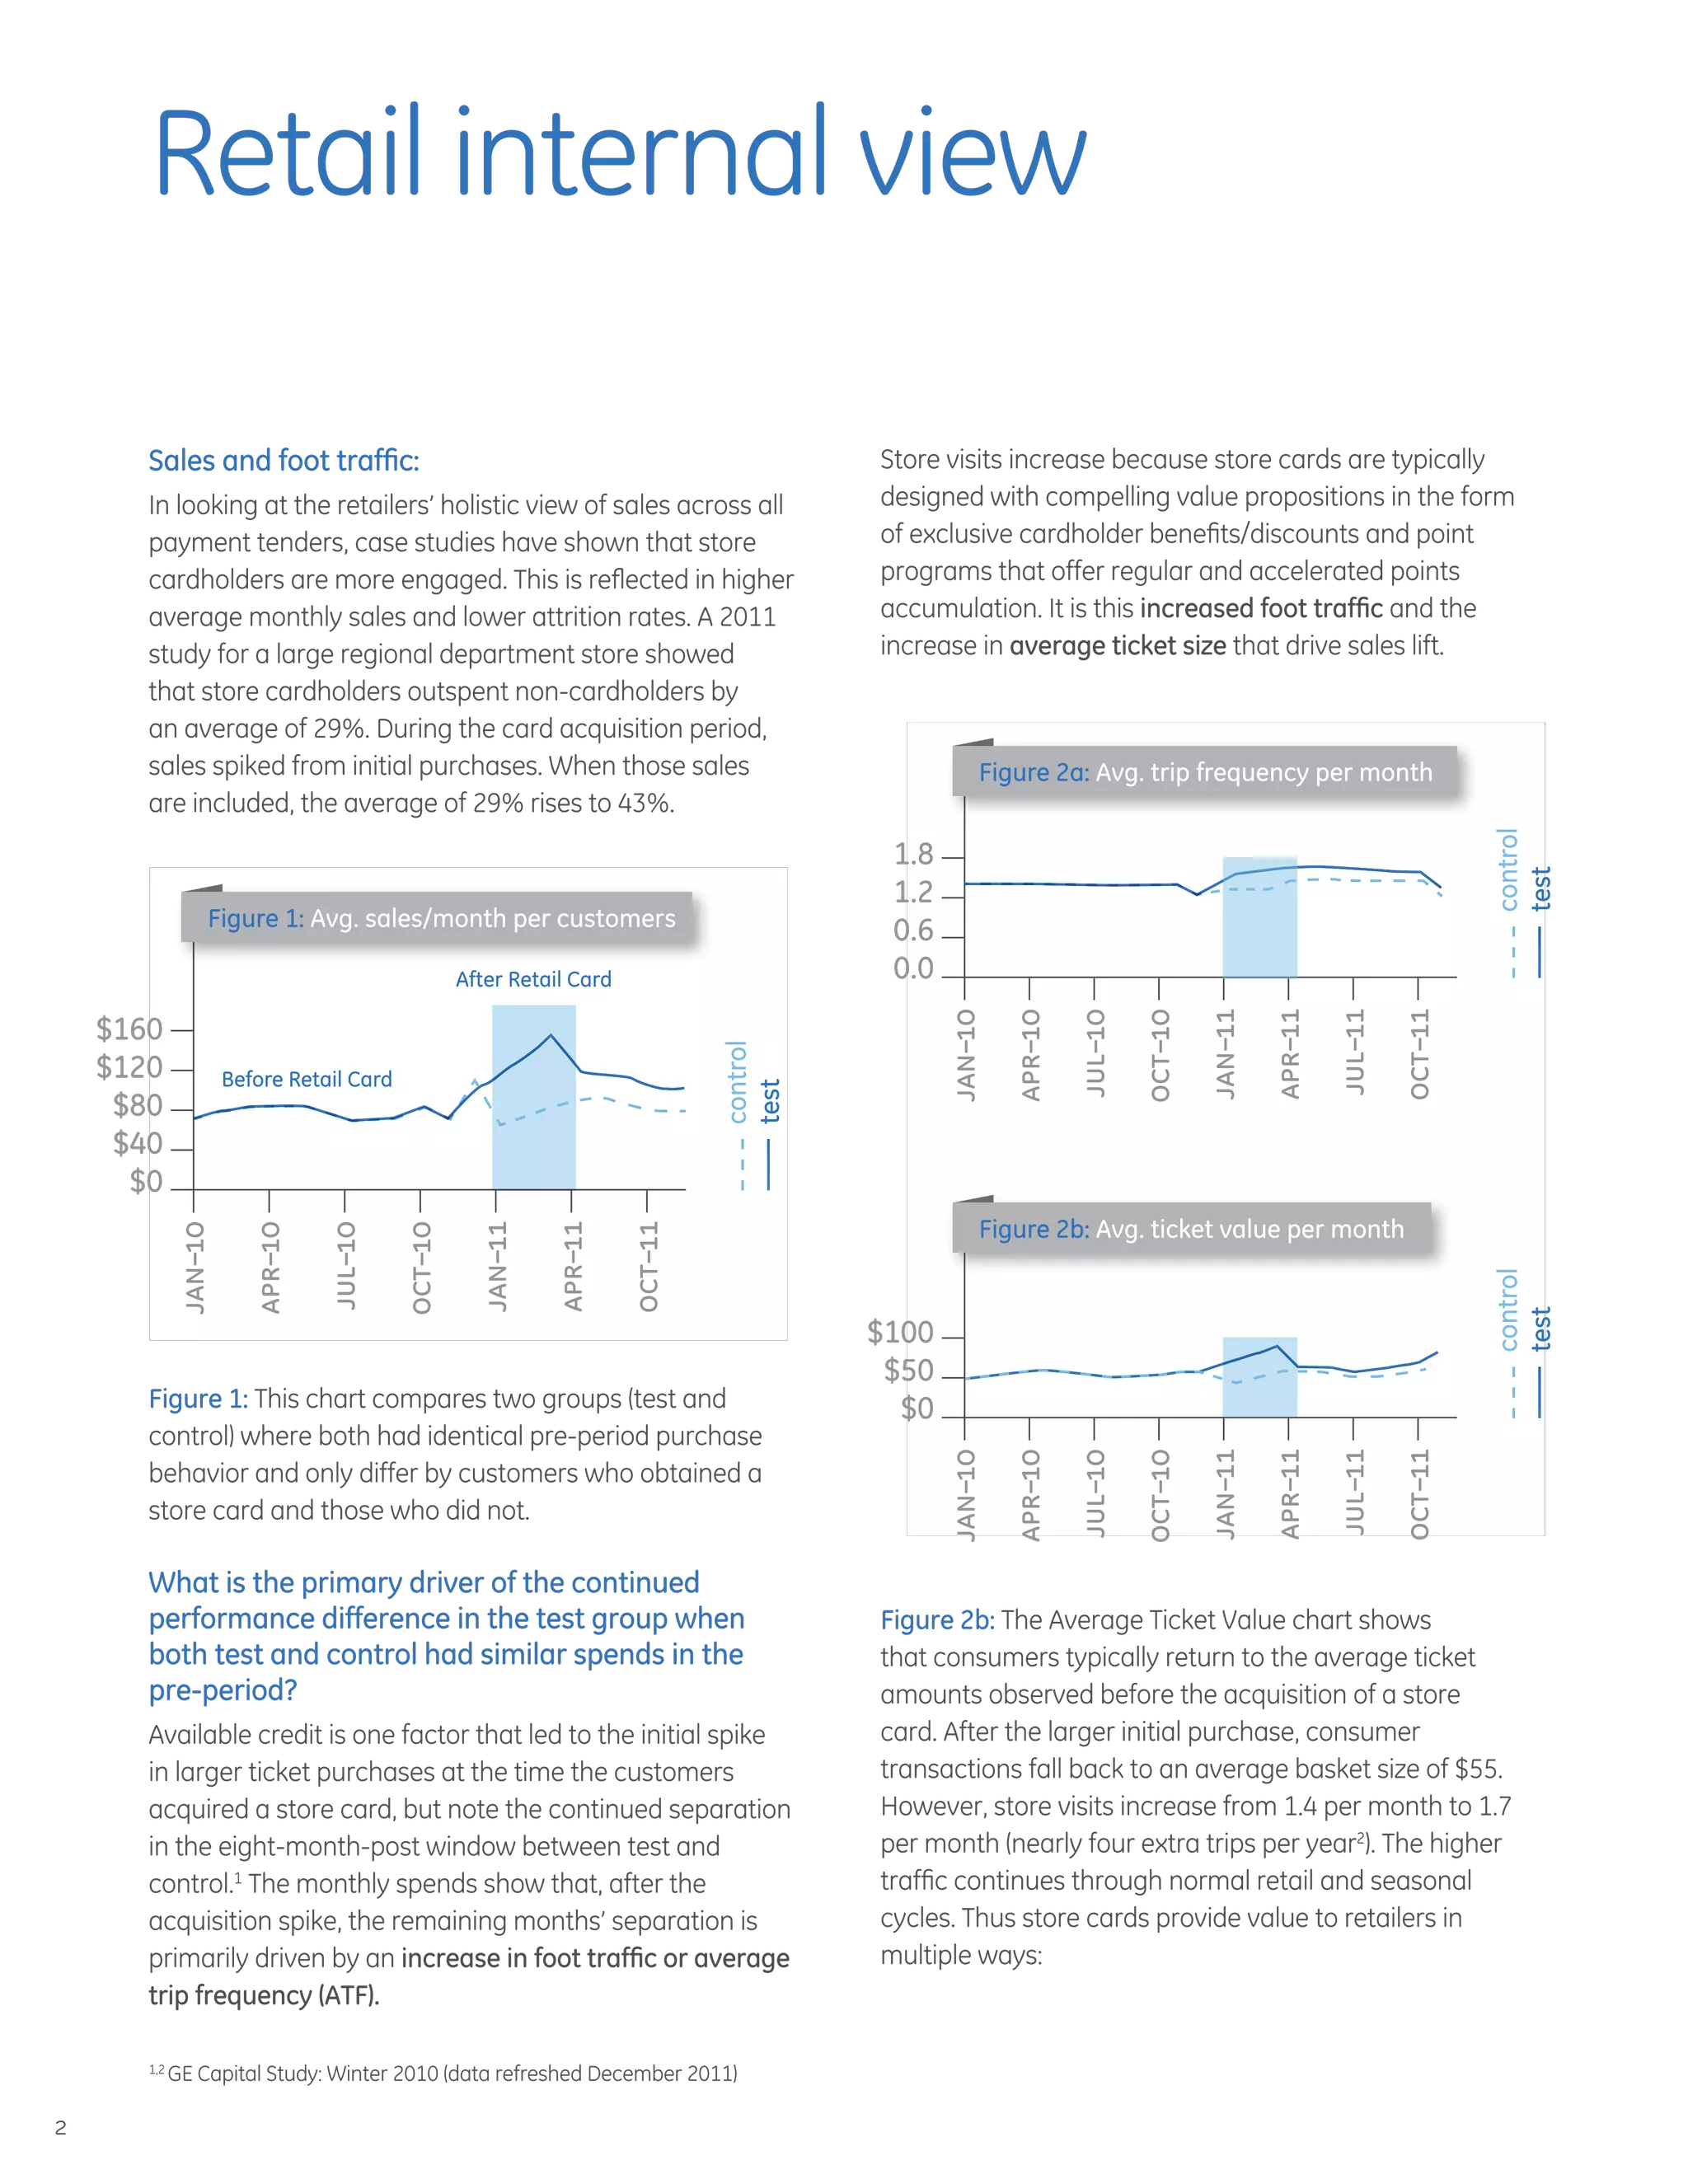
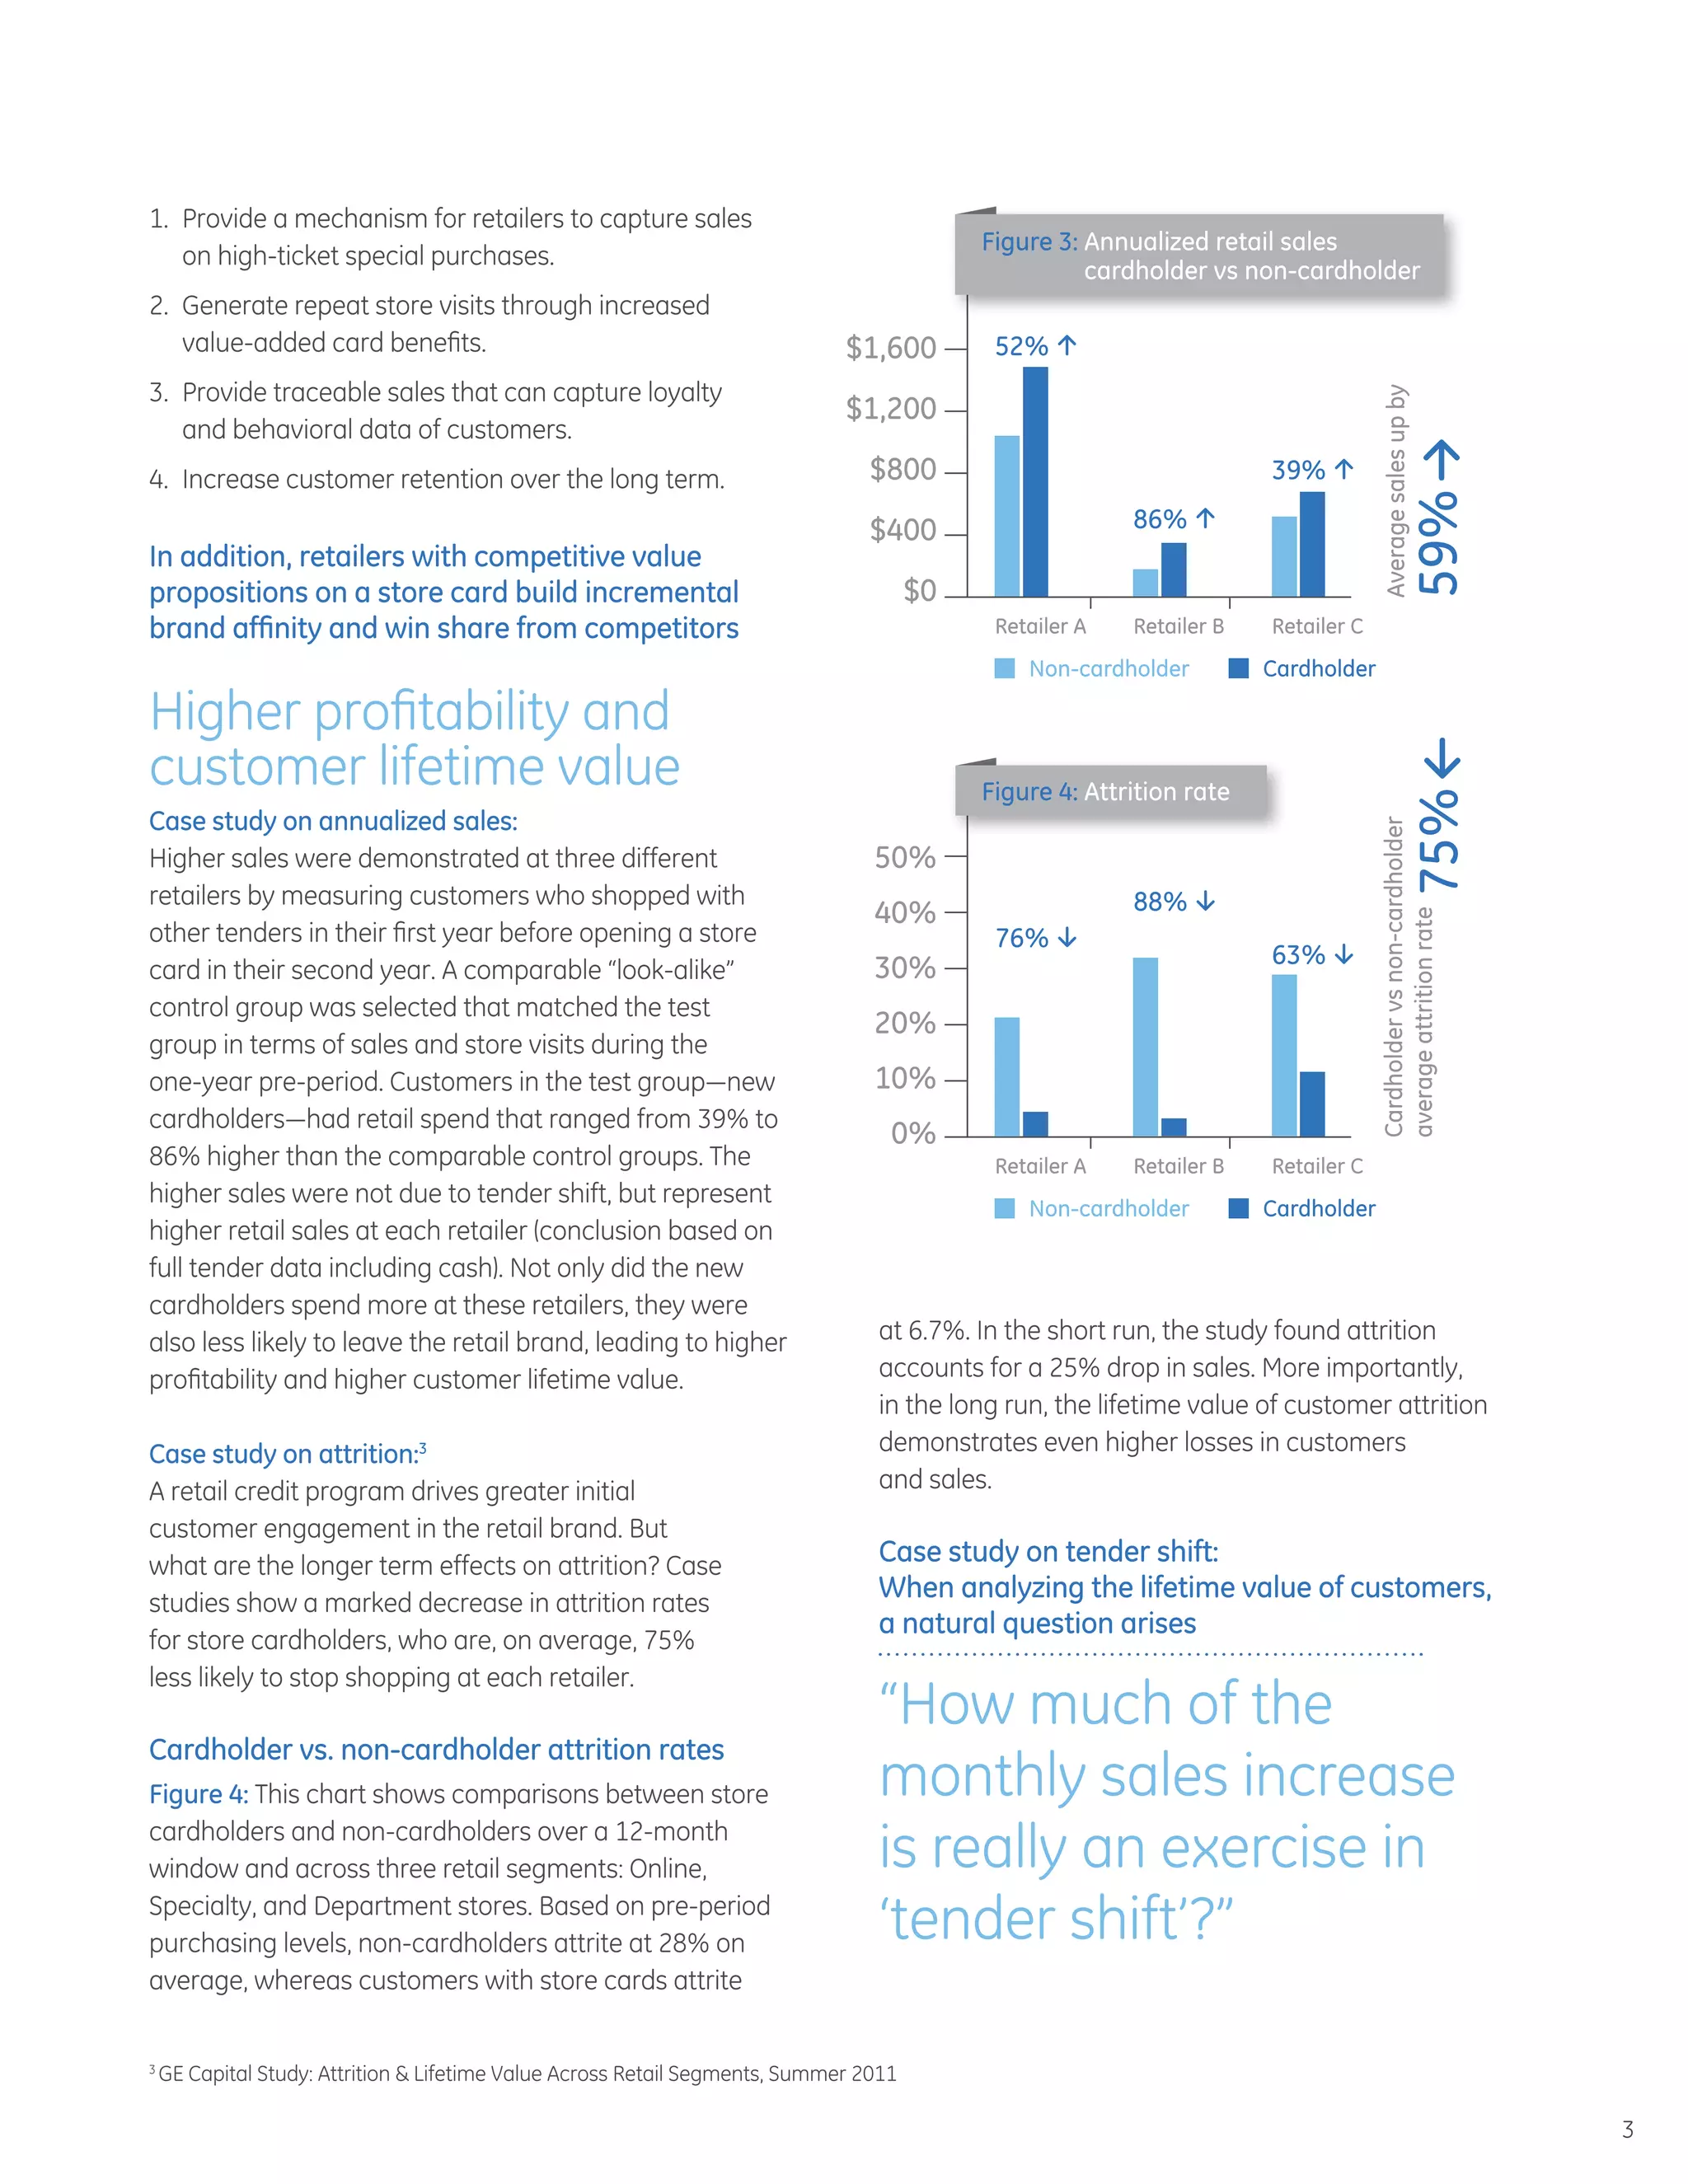
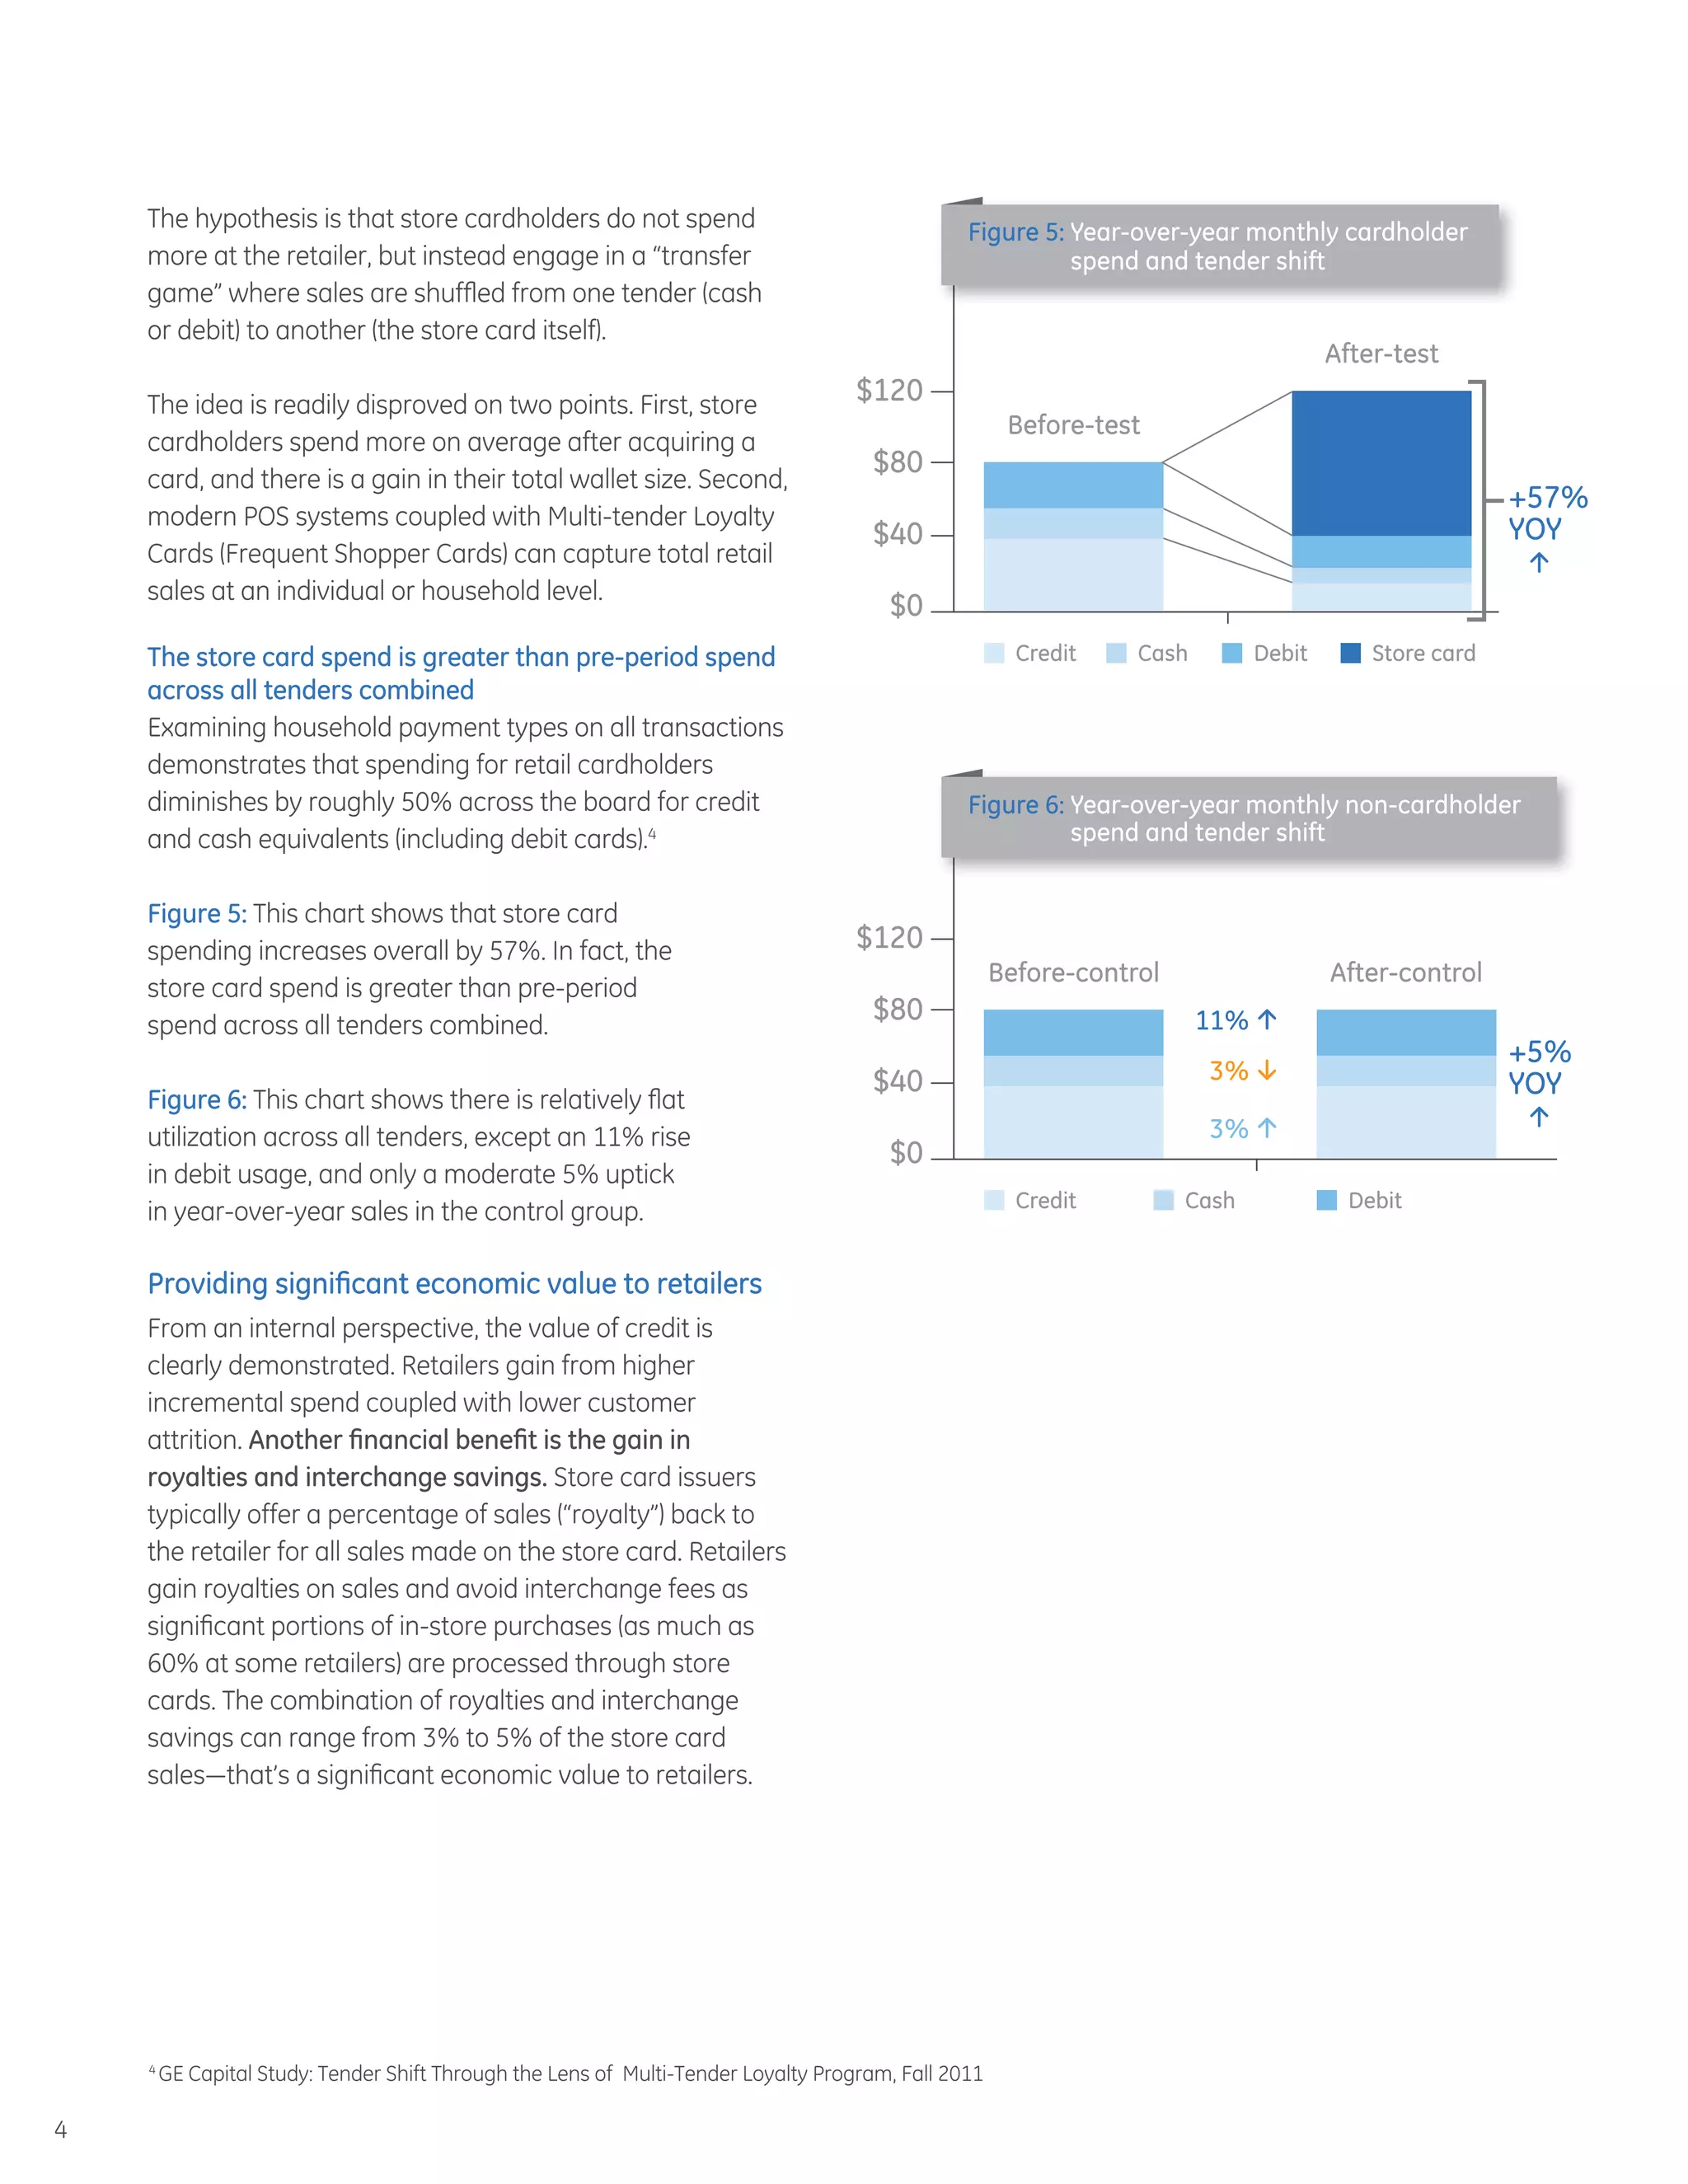
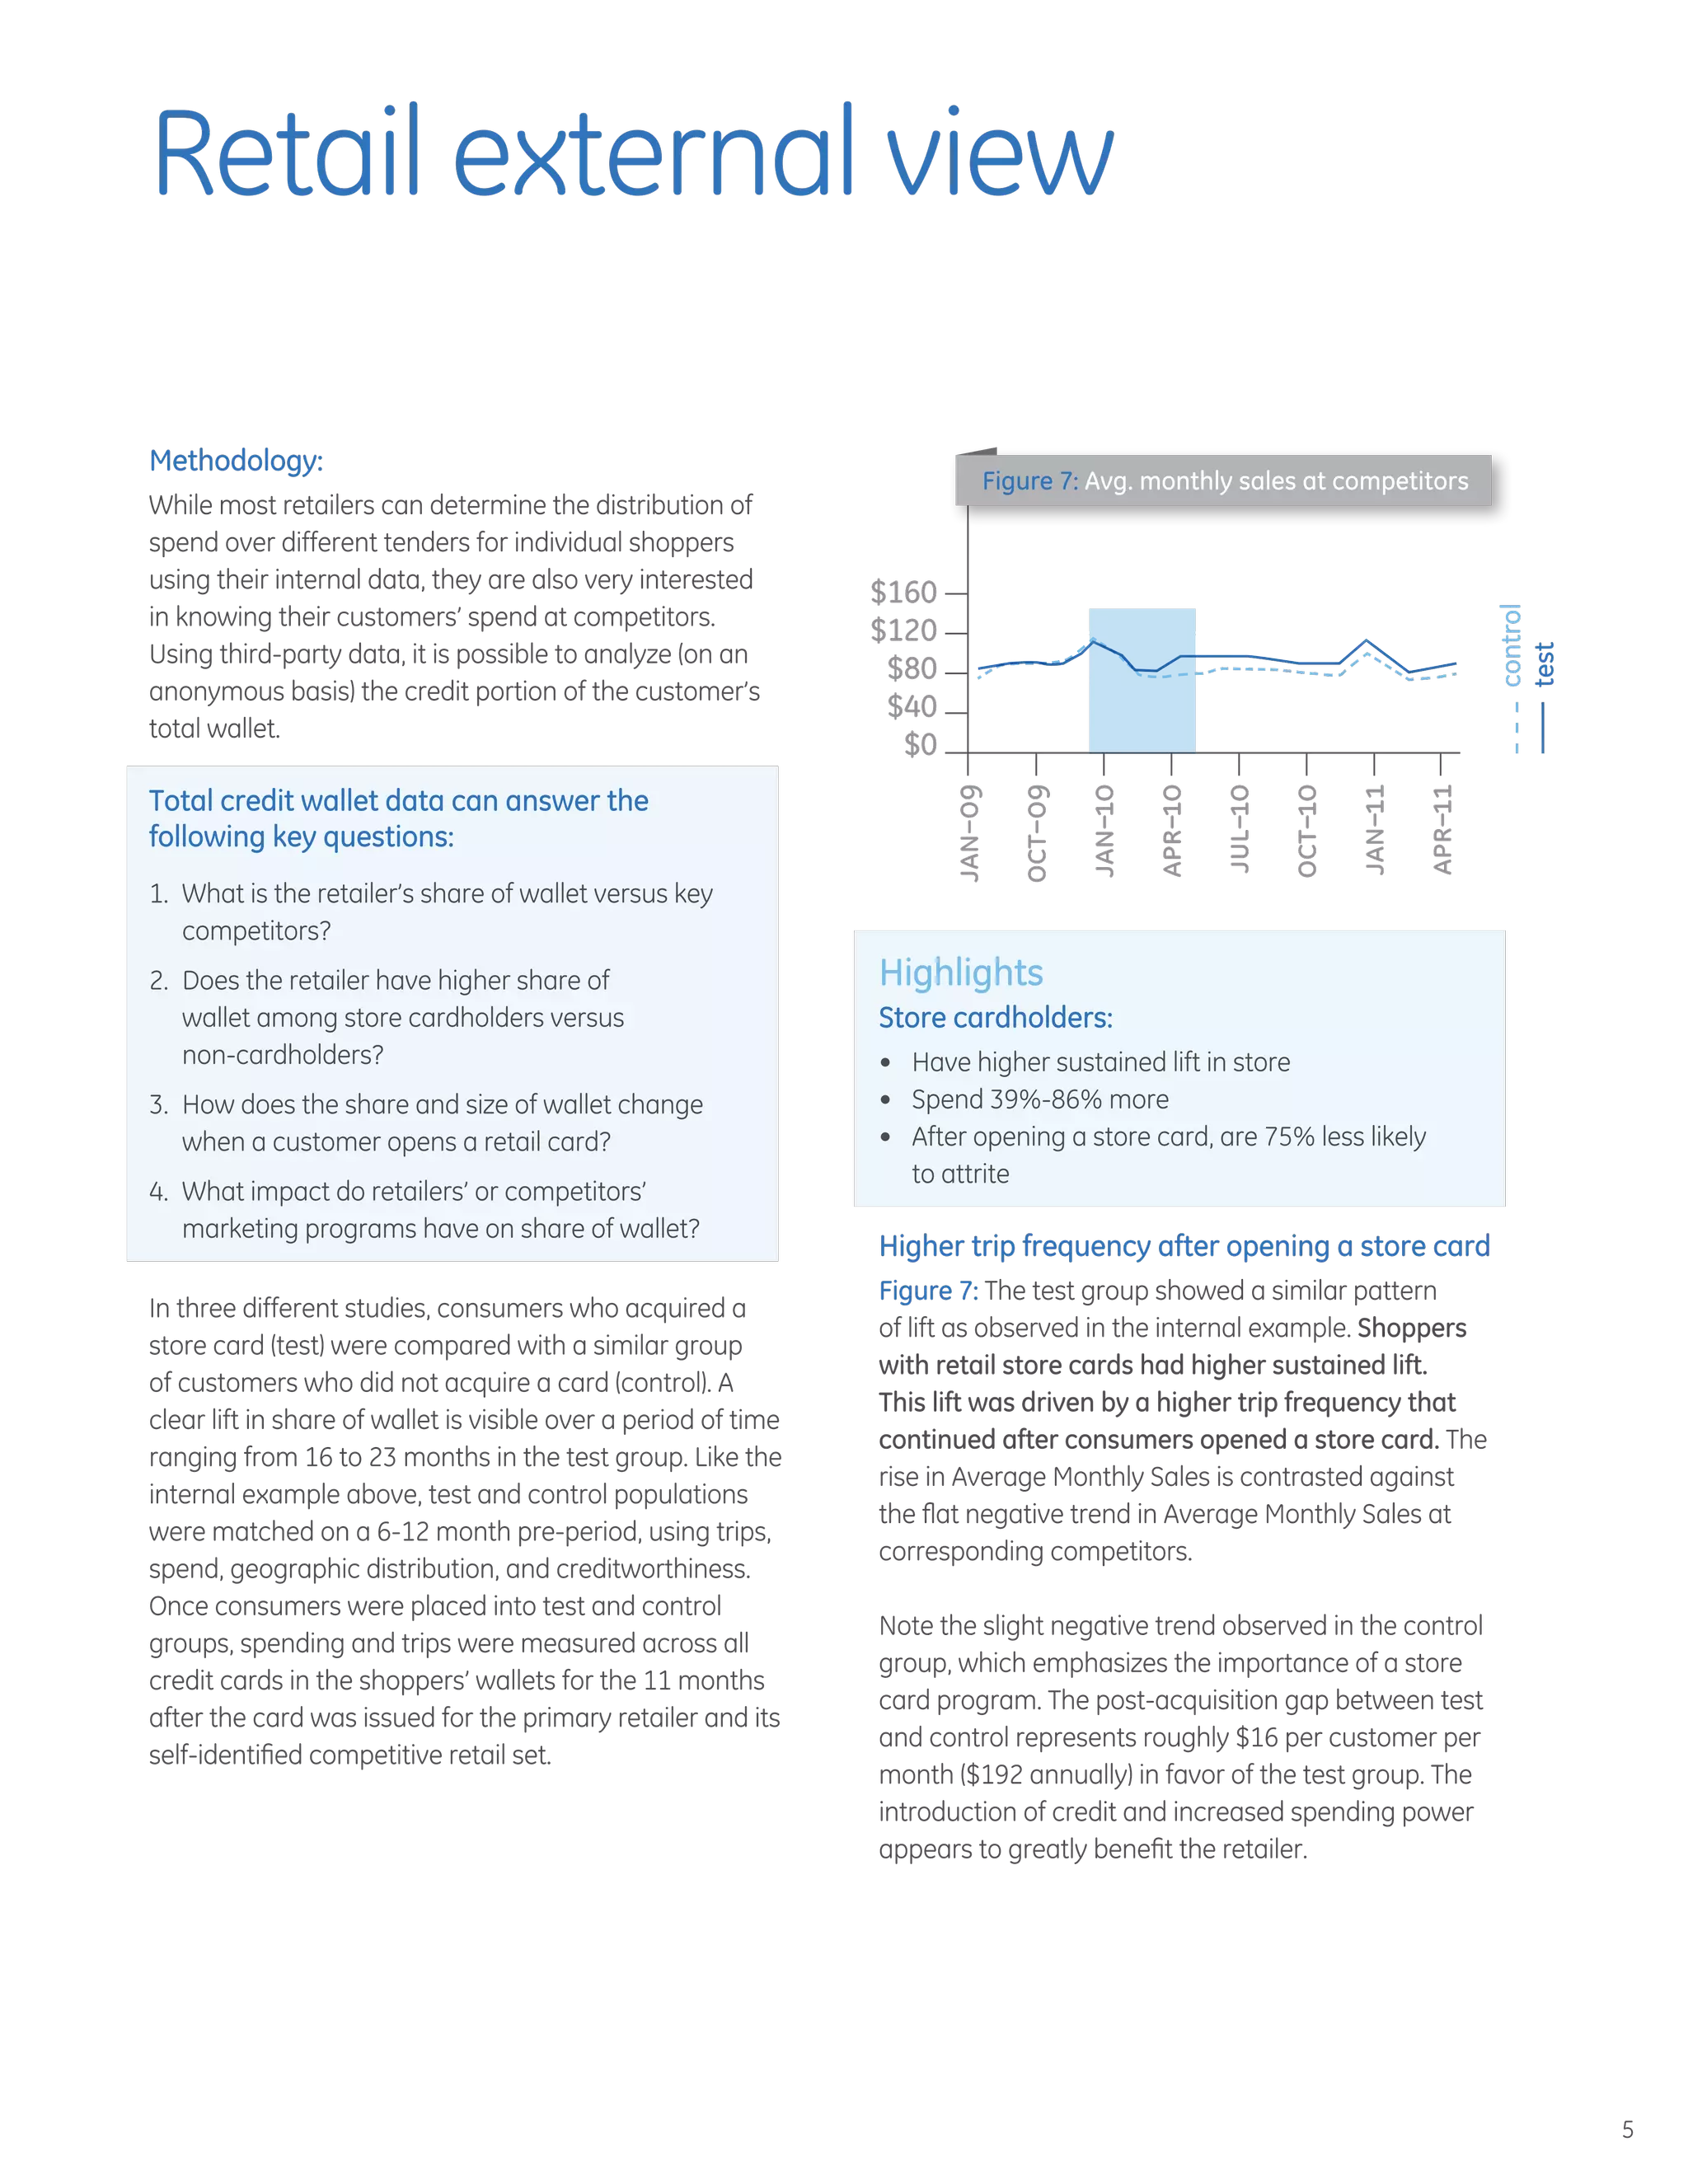
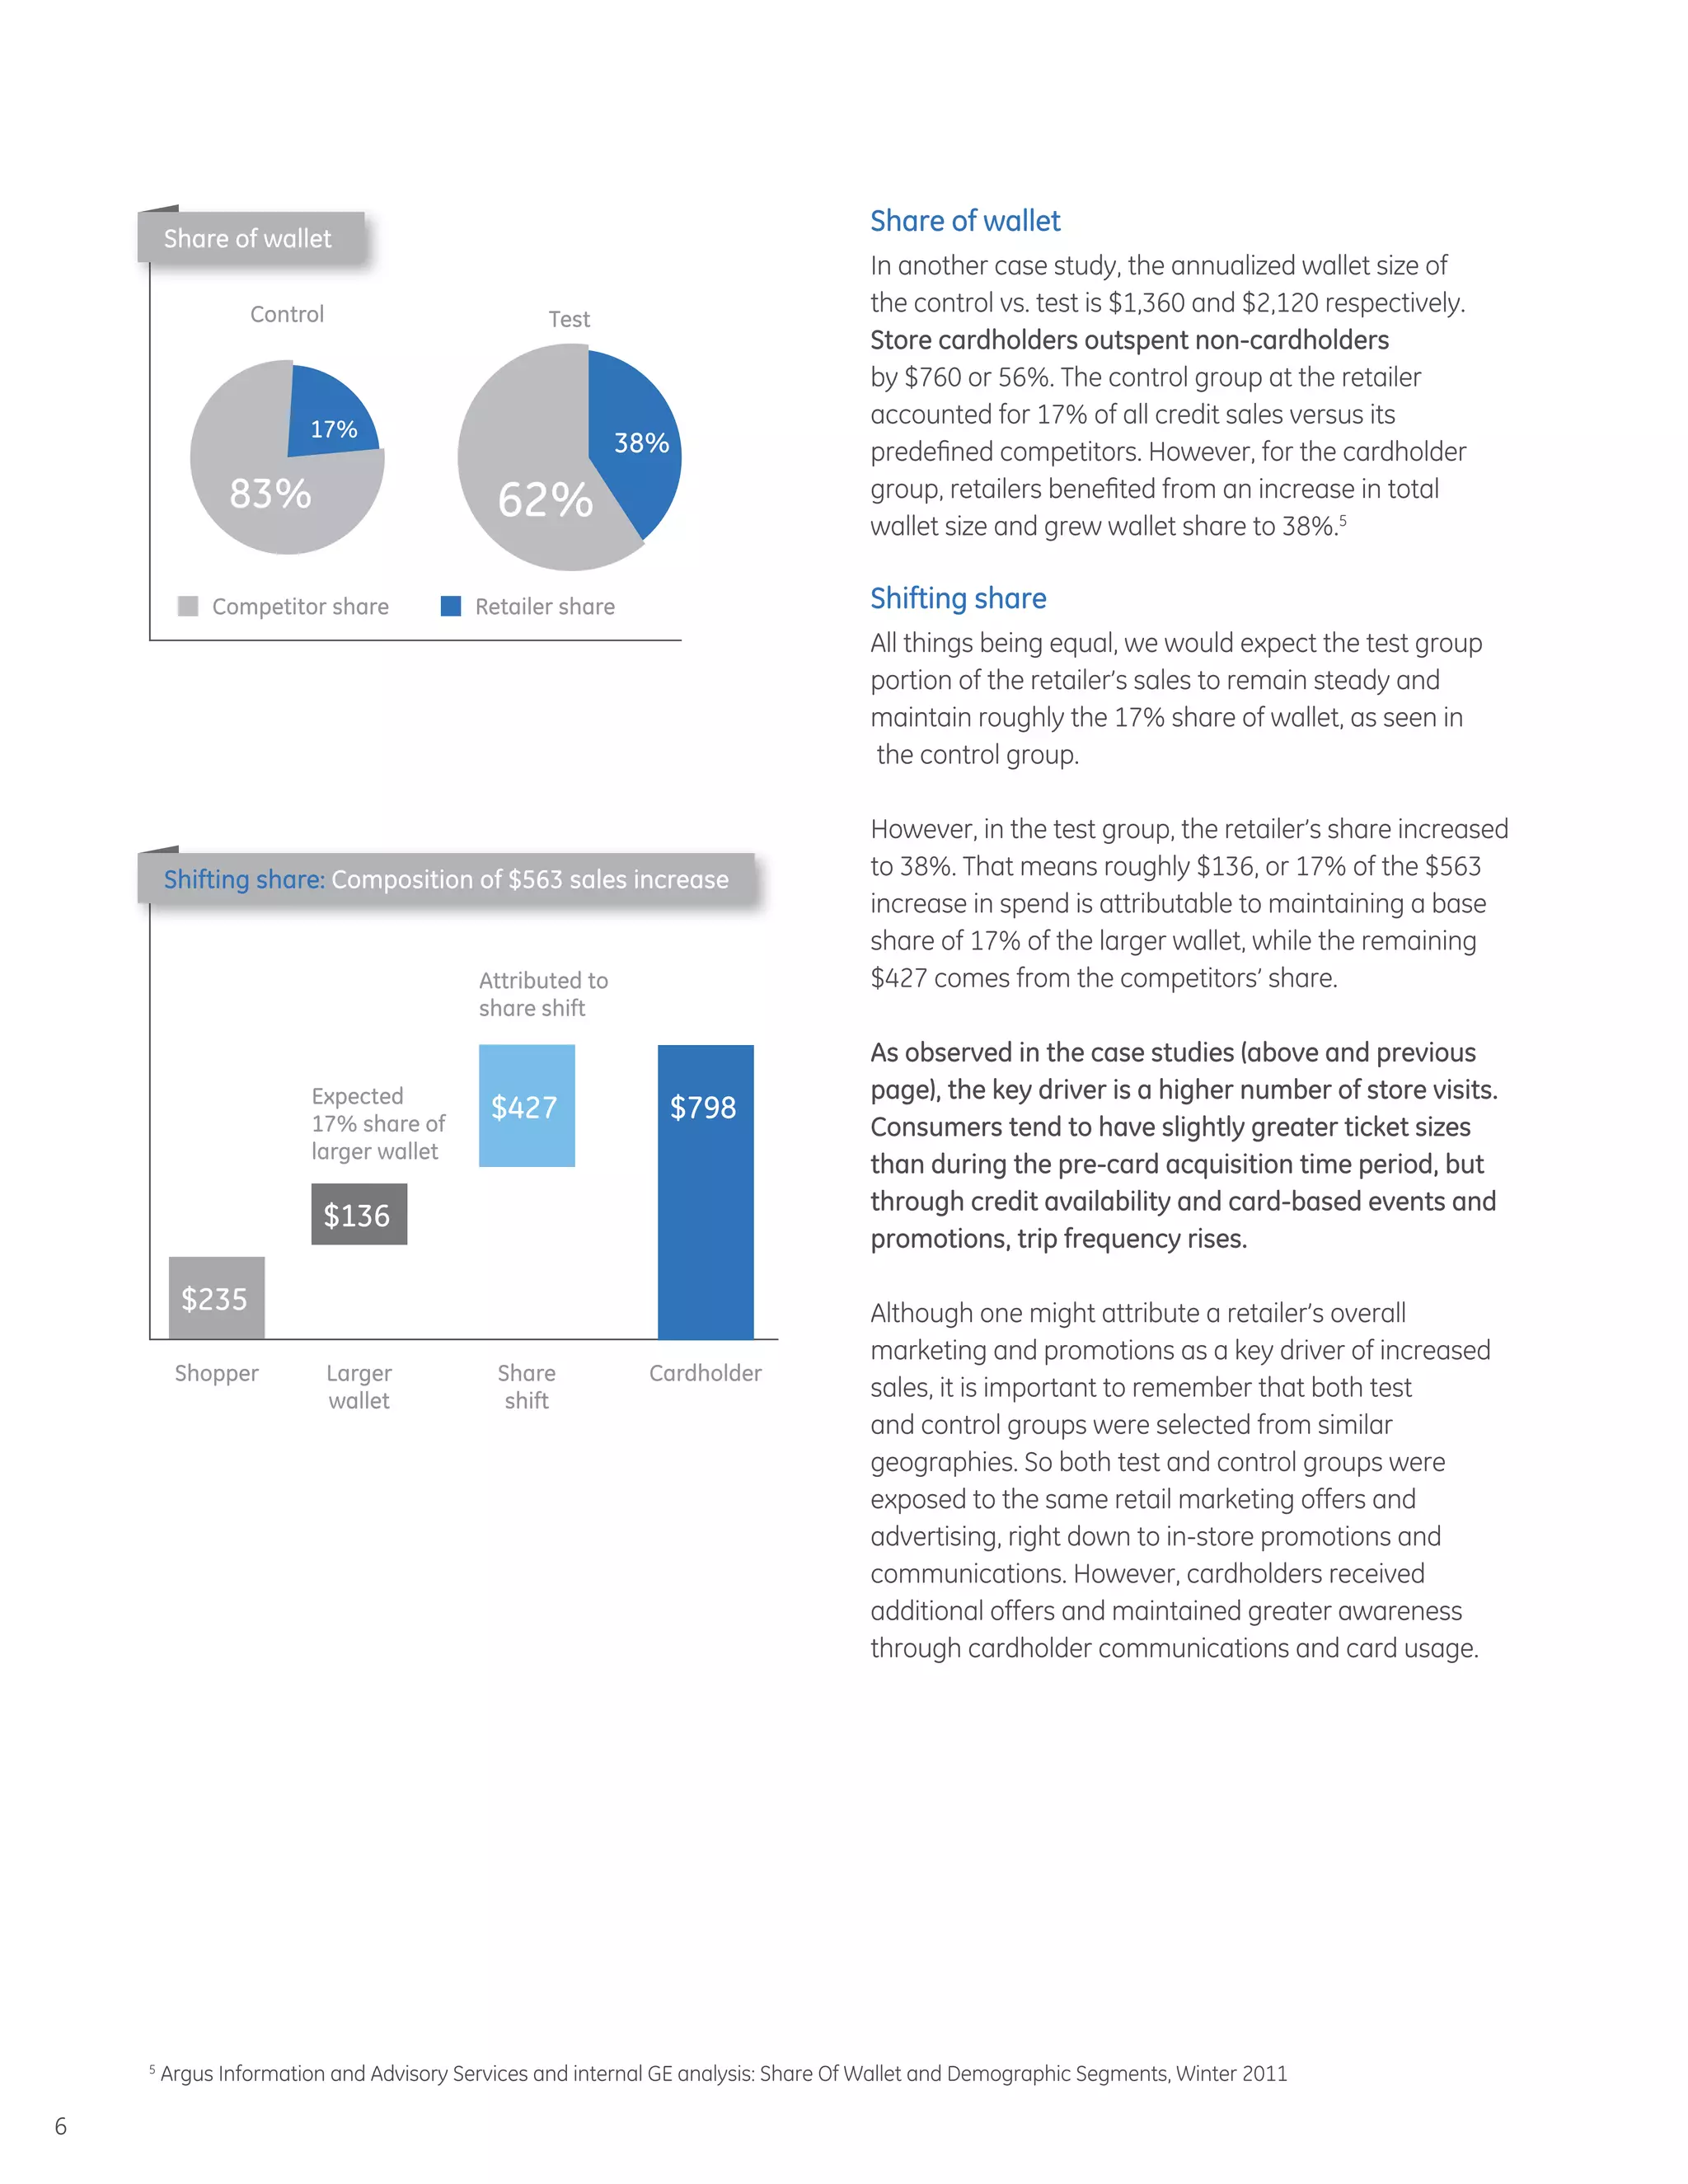
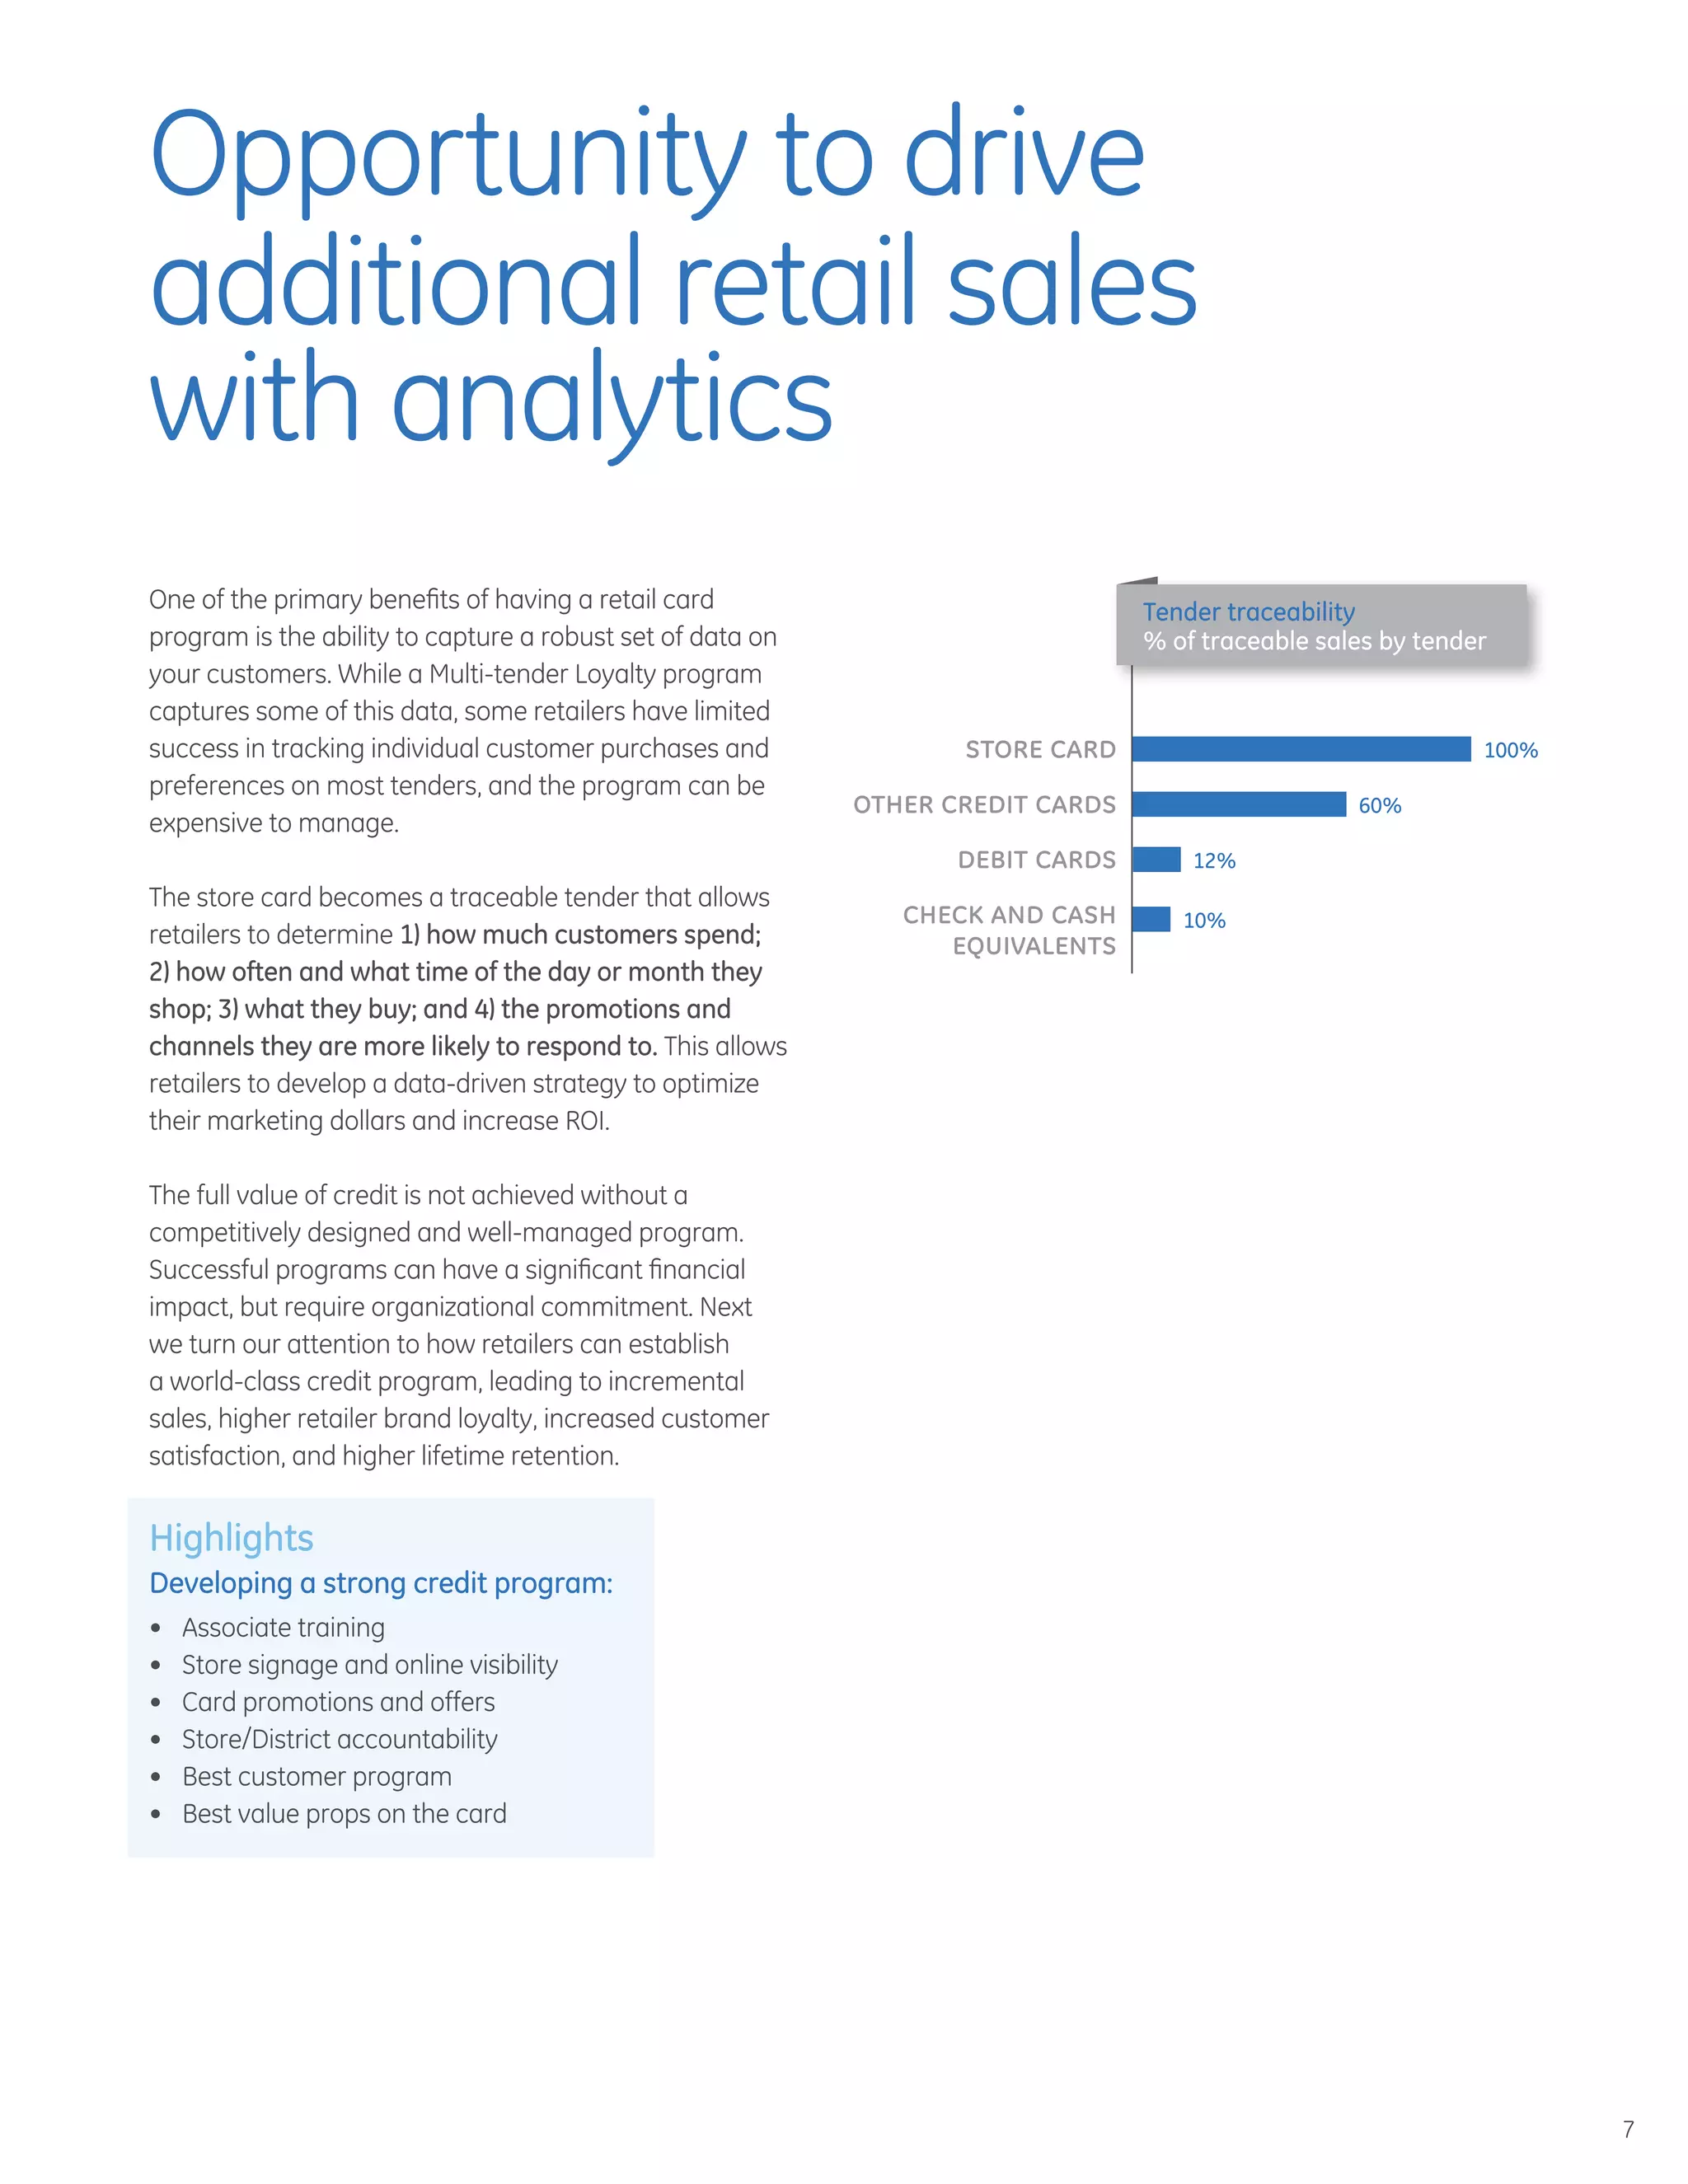
Retailer-branded credit card programs can provide significant benefits to retailers, including increased sales, customer loyalty, and wallet share. Case studies show that credit cardholders spend 39-86% more on average annually than non-cardholders. They also visit stores more frequently and have attrition rates that are 75% lower. Retailers can gain insights into customer purchasing behaviors from credit card transaction data to improve marketing. When implemented effectively, retailer credit programs can help drive higher long-term revenues and profits through customer retention and increased spending.
This document provides an overview of analytical tools that retailers can use to maximize the results of their marketing efforts. It discusses five key tools: targeting, predictive modeling, contact management, channel optimization, and media mix modeling. These tools help retailers understand customer behavior, effectively target consumers, optimize the number of customer interactions, engage customers through their preferred channels, and adjust marketing spend across channels to maximize sales and ROI. The document emphasizes that measurement is critical for marketing success and retailers should implement analytic tools to influence their strategies and drive improved results.
Data visualization is the presentation of data in a visual format to help identify patterns, trends, and correlations. It allows business users to easily understand and apply insights from large amounts of data. The document discusses various data visualization tools like dashboards, graphs, sensitivity modeling, and heat maps that can provide executives actionable insights to inform strategic decisions and drive business performance. These tools simplify complex data and communicate insights across organizations in a visual and easy to understand manner.
Retailers are using customer segmentation strategies to better understand their customers and target them more effectively. Segmentation involves collecting customer data to group them into segments based on spending behaviors, purchase categories, channel usage, and other factors. This allows retailers to develop tailored marketing strategies for each segment to grow sales and loyalty. Key metrics to measure the success of segmentation include changes in customer migration patterns, attrition rates, sales and profit per customer. Combining segmentation with predictive modeling helps retailers further optimize their targeting and spending.
Microsoft Word - Customer Centric Sales Strategies - William SurmonWilliam Surmon
Cross selling is an important strategy for growing revenue, but should be done responsibly based on customer insights. A thorough analysis of the customer base can identify opportunities for profitable cross selling by segmenting customers based on factors like life stage, income, and existing product holdings. The potential for cross selling and increasing product usage can then be determined for each segment. This helps ensure customers are offered additional products they can benefit from and afford. Tracking attrition also provides insights to improve the customer experience.
RFM (Recency, Frequency, Monetary value) analysis measures a customer's recency of purchase, visit frequency, and typical monetary value. It helps marketers identify their best customers, customers at risk of churning, and potential customers. CleverTap's RFM dashboard visualizes customers on a 2D graph by recency and frequency scores. It segments customers into 10 groups including Champions, Potential Loyalists, New Customers, and At-Risk Customers to target personalized campaigns.
Align, Aim, Perform and Grow with Shopper MarketingRick Abens
Shopper marketers are under more scrutiny than ever to accurately forecast and assess ROI.
Foresight ROI is proud to have analyzed over 18,000 shopper marketing events to help Clorox and other leading CPGs:
• Decide levels of investment across demand creation programs
• Better understand shopper marketing impact across the portfolio
• Gain visibility to which plan elements are “working harder” than others
Learn more in this presentation by Rick Abens, Founder and CEO at Foresight ROI, and David Cardona, Director, Shopper Marketing, Category Advisory & Multi-Cultural Capabilities at the Clorox Company, delivered at the Path to Purchase Expo in Rosemont, IL on September 22, 2016.
To learn more contact us at www.foresightroi.com or call us directly at 312-575-0024.
Looking Inside the Consumer Wallet Key Success Factors for Driving Loyalty in...Vivastream
Big data from various sources provides insights into consumer spending trends from the macro to micro level. Understanding these trends is key to making effective marketing decisions in today's competitive environment. A full wallet, 360 degree view of customers that includes transaction data provides a more complete picture of consumer behavior compared to traditional models relying on demographics and in-store spend alone. This comprehensive view of customers, markets, competition and opportunities can help merchants optimize acquisition, retention and marketing strategies.
Our Shopper Marketing Methodology is a planning methodology that highlights our premium tool-kit of tools & templates to help you develop and implement a shopper marketing strategy that increases sales, builds shopper insights, and grows brand awareness.
Demand Metric methodologies are step-by-step guides that help you build strategic processes using "Best Practices" and other Demand Metric tools & templates.
Stages of this methodology include:
Learn About Shopper
Analyze Opportunities
Strategic Planning
Technology Selection
Campaign Execution
Measure Results
Marketing must evolve to keep up with today's customer who is in control of their buying journey. While most marketers use marketing automation to standardize processes, the most successful are using it to transform their practices with a focus on customer behavior across channels. Those marketers who have adopted behavioral marketing saw benefits like higher revenue growth and larger contributions to sales pipelines. Behavioral marketers have more fully implemented automation, run more and a greater variety of campaigns, and have more triggers based on customer behavior. Overall marketing automation adoption is widespread but execution remains basic for many, indicating room for improved strategies focused on the customer experience.
Defining Target Market for Telemarketing CampaignsMelody Ucros
IE Business School MBD Program
Retail Analytics Project O1 Group C:
Annie Pi – Anchal Jaiswal – Cedric Viret – Melody Ucros – Miguel Martin Romero – Pablo Dosal - Victor Kausch
Our Shopper Marketing Methodology is a planning methodology that highlights our premium tool-kit of tools & templates to help you develop and implement a shopper marketing strategy that increases sales, builds shopper insights, and grows brand awareness.
Demand Metric methodologies are step-by-step guides that help you build strategic processes using "Best Practices" and other Demand Metric tools & templates. For background info on Demand Metric methodologies, read our blog post: Much Ado About Methodologies.
Stages of this methodology include:
Learn About Shopper
Analyze Opportunities
Strategic Planning
Technology Selection
Campaign Execution
Measure Results
1. The document discusses how the classic economic model of consumer behavior as rational actors seeking to maximize benefits is an oversimplification and does not account for variability and irrationality in consumer decision making.
2. It then outlines the traditional linear consumer purchase process model involving problem recognition, information search, evaluation of alternatives, purchase, and post-purchase evaluation.
3. However, it notes that the modern consumer decision journey is non-linear with multiple touchpoints of influence from various sources, requiring marketers to engage consumers throughout the process through two-way conversations to build loyalty.
This document summarizes the key findings of a Forrester Consulting research study on multichannel marketing:
- Marketers have widely adopted multichannel marketing practices to engage customers across digital and offline channels. 40% of respondents considered themselves mature practitioners.
- Mature multichannel marketers reported significant business gains, including improved campaign performance and higher marketing ROI.
- However, even mature practitioners still have disjointed processes and opportunities to better integrate technologies to drive more benefits from their multichannel efforts.
This document discusses strategies for fashion retailers to minimize margin erosion through data-driven optimization of their product, promotion, placement, people, and price strategies. It provides details on how retailers can focus on assortment and inventory management, promotional ROI, geographic placement of inventory, labor management, and targeted markdown pricing to arrest inevitable margin erosion in the multi-channel retail environment.
For more classes visit
www.snaptutorial.com
1. The term “receivables” refers to
cash to be paid to debtors.
merchandise to be collected from individuals or companies.
cash to be paid to creditors.
amounts due from individuals or companies.
Retail Displays - Front End Merchandising Trend 2011richltd
The document discusses the opportunity for retailers to revolutionize front-end merchandising. It states that front-end merchandising represents the greatest opportunity for performance improvement in retailing today. While front-ends have traditionally played a modest role, they impact customer satisfaction and loyalty more than any other store area. Emerging forces like declining magazine sales, health concerns with confections, and environmental sustainability are changing the traditional product mix and creating conditions for innovation. Retailers who make revitalizing their front-ends a strategic priority will be best positioned to improve performance and enhance their competitive positions.
1. There is widespread debate in the industry around defining shopper marketing, with various definitions focusing on different aspects such as reach, activities, and program initiator.
2. The most encompassing definition is "shopper-centric marketing," which focuses on satisfying shoppers' needs through relevant information, store experiences, and ease of purchase, regardless of the specific marketing stimulus or who funds it.
3. Shopper marketing should aim to reach shoppers through in-store and out-of-store activities designed to influence purchase decisions at any point when shoppers are considering a product category.
This document outlines a proposal to analyze customer relationship management (CRM) data to predict young female customers' propensity to apply for a debit card. The objective is to test hypotheses about factors that influence application rates. The analysis would involve segmenting customers, predictive modeling using logistic regression, and multivariate testing of marketing campaigns on social media. The expected results are identification of key customer parameters, predictive models to increase conversion rates, and insights to improve targeted advertisements.
Technology is quickly changing the face of retail delivery. The customer experience is increasingly remote. In this new environment how are financial institutions going to establish meaningful personal relationships that are so important to cross selling? How are they going to build the emotional connections that drive customers to them for future needs?
Retail Sector Analysis PowerPoint Presentation Slides arrange insightful content using high-quality design. This PowerPoint slideshow is specially-developed for retail management professionals around the globe. Demonstrate the types of retail formats such as store-based, non-store based, and service-based with visual support. Use our retail industry assessment PPT presentation to represent the key growth drivers within the retail industry. Employ this retail market analysis PowerPoint theme to educate your audience about global, and environmental trends. Easily illustrate types of retail applications like supply chain systems, enterprise retail system, and store operation system. Advanced tools are utilized to visualize data featured in this retail business analysis PPT layout. Elucidate the multi-channel retailing trends with the help of infographic-style formats. Represent your organization’s retailing strategy. Walk your audience through the operations, promotion, and marketing communications in retailing. Showcase merchandise management, inventory management, and control. So, hit the download button now and begin personalization instantly. Our Retail Sector Analysis PowerPoint Presentation Slides are topically designed to provide an attractive backdrop to any subject. Use them to look like a presentation pro. https://bit.ly/2Lr5Zze
Uncovering an Innovative Monetization Strategy to Keep Your Organization Rele...RocketSource
This document discusses innovative monetization strategies for organizations. It notes that focusing solely on customer acquisition is insufficient, and that retention must also be emphasized through innovative revenue models, pricing strategies, and business models aligned with the customer journey. Examples are provided of companies innovating their monetization approaches through various strategies like freemium, value-based, subscription-based, and pay-per-use models. The importance of data-driven optimization of pricing and understanding customer willingness to pay is also highlighted.
Measuring the overall effectiveness of offers is often a struggle.
Whether assessing in-store circulars, digital coupons, direct mailers or other vehicles, the key question is how to ensure promotions are effectively driving total value for a pharmacy.
https://youtu.be/57ghR94SYXM
2014 Customer Loyalty ASEAN Conference: Loyalty PrimeJim D Griffin
Kunal Mohiuddin presents an elegant three-step approach for building a future-ready loyalty program capability. Kunal has more than fifteen years in design and execution of loyalty programs and solutions. Based in India, he has been the architect of numerous enterprise-scale programs, located in over 85 countries and powering over 65 brands. Lassu (lassuloyalty.com) is the ASEAN distributor and reseller of Loyalty Prime – a complete enterprise-class loyalty platform that offers full CRM and loyalty management, and excellent integration to backend systems, like POS, reservations, and ERP. With the Loyalty Prime platform, marketers can easily segment their customers, and then build engagement using social, mobile, website, email, SMS and marketing campaign automation.
Direct marketing is a form of advertising that allows businesses to communicate directly with customers through various channels like email, mobile, online display ads, and direct mail. It emphasizes targeting customers, measuring responses, and accountability. Some key characteristics include using customer databases to target messages, addressing customers directly, and including a clear call to action. Direct marketing is used by businesses of all sizes and can be effective due to its measurability. Common channels include email, search, display ads, mobile apps, telemarketing, radio, and direct mail.
This document discusses the experiences of Asian Americans struggling with their racial identity and assimilation. It describes the pressure some Asian Americans feel to assimilate into white American culture by abandoning their heritage. This is exemplified through stories of feeling like a "banana" - yellow on the outside and white on the inside. The document also examines how class and education levels have impacted rates of intermarriage between Asian Americans and white Americans over time. It notes the challenges Asian American youth face in developing their identity when their heritage is devalued by the dominant culture, and how finding a role in either white or Asian communities has been part of that identity formation process.
Our Shopper Marketing Methodology is a planning methodology that highlights our premium tool-kit of tools & templates to help you develop and implement a shopper marketing strategy that increases sales, builds shopper insights, and grows brand awareness.
Demand Metric methodologies are step-by-step guides that help you build strategic processes using "Best Practices" and other Demand Metric tools & templates.
Stages of this methodology include:
Learn About Shopper
Analyze Opportunities
Strategic Planning
Technology Selection
Campaign Execution
Measure Results
Marketing must evolve to keep up with today's customer who is in control of their buying journey. While most marketers use marketing automation to standardize processes, the most successful are using it to transform their practices with a focus on customer behavior across channels. Those marketers who have adopted behavioral marketing saw benefits like higher revenue growth and larger contributions to sales pipelines. Behavioral marketers have more fully implemented automation, run more and a greater variety of campaigns, and have more triggers based on customer behavior. Overall marketing automation adoption is widespread but execution remains basic for many, indicating room for improved strategies focused on the customer experience.
Defining Target Market for Telemarketing CampaignsMelody Ucros
IE Business School MBD Program
Retail Analytics Project O1 Group C:
Annie Pi – Anchal Jaiswal – Cedric Viret – Melody Ucros – Miguel Martin Romero – Pablo Dosal - Victor Kausch
Our Shopper Marketing Methodology is a planning methodology that highlights our premium tool-kit of tools & templates to help you develop and implement a shopper marketing strategy that increases sales, builds shopper insights, and grows brand awareness.
Demand Metric methodologies are step-by-step guides that help you build strategic processes using "Best Practices" and other Demand Metric tools & templates. For background info on Demand Metric methodologies, read our blog post: Much Ado About Methodologies.
Stages of this methodology include:
Learn About Shopper
Analyze Opportunities
Strategic Planning
Technology Selection
Campaign Execution
Measure Results
1. The document discusses how the classic economic model of consumer behavior as rational actors seeking to maximize benefits is an oversimplification and does not account for variability and irrationality in consumer decision making.
2. It then outlines the traditional linear consumer purchase process model involving problem recognition, information search, evaluation of alternatives, purchase, and post-purchase evaluation.
3. However, it notes that the modern consumer decision journey is non-linear with multiple touchpoints of influence from various sources, requiring marketers to engage consumers throughout the process through two-way conversations to build loyalty.
This document summarizes the key findings of a Forrester Consulting research study on multichannel marketing:
- Marketers have widely adopted multichannel marketing practices to engage customers across digital and offline channels. 40% of respondents considered themselves mature practitioners.
- Mature multichannel marketers reported significant business gains, including improved campaign performance and higher marketing ROI.
- However, even mature practitioners still have disjointed processes and opportunities to better integrate technologies to drive more benefits from their multichannel efforts.
This document discusses strategies for fashion retailers to minimize margin erosion through data-driven optimization of their product, promotion, placement, people, and price strategies. It provides details on how retailers can focus on assortment and inventory management, promotional ROI, geographic placement of inventory, labor management, and targeted markdown pricing to arrest inevitable margin erosion in the multi-channel retail environment.
For more classes visit
www.snaptutorial.com
1. The term “receivables” refers to
cash to be paid to debtors.
merchandise to be collected from individuals or companies.
cash to be paid to creditors.
amounts due from individuals or companies.
Retail Displays - Front End Merchandising Trend 2011richltd
The document discusses the opportunity for retailers to revolutionize front-end merchandising. It states that front-end merchandising represents the greatest opportunity for performance improvement in retailing today. While front-ends have traditionally played a modest role, they impact customer satisfaction and loyalty more than any other store area. Emerging forces like declining magazine sales, health concerns with confections, and environmental sustainability are changing the traditional product mix and creating conditions for innovation. Retailers who make revitalizing their front-ends a strategic priority will be best positioned to improve performance and enhance their competitive positions.
1. There is widespread debate in the industry around defining shopper marketing, with various definitions focusing on different aspects such as reach, activities, and program initiator.
2. The most encompassing definition is "shopper-centric marketing," which focuses on satisfying shoppers' needs through relevant information, store experiences, and ease of purchase, regardless of the specific marketing stimulus or who funds it.
3. Shopper marketing should aim to reach shoppers through in-store and out-of-store activities designed to influence purchase decisions at any point when shoppers are considering a product category.
This document outlines a proposal to analyze customer relationship management (CRM) data to predict young female customers' propensity to apply for a debit card. The objective is to test hypotheses about factors that influence application rates. The analysis would involve segmenting customers, predictive modeling using logistic regression, and multivariate testing of marketing campaigns on social media. The expected results are identification of key customer parameters, predictive models to increase conversion rates, and insights to improve targeted advertisements.
Technology is quickly changing the face of retail delivery. The customer experience is increasingly remote. In this new environment how are financial institutions going to establish meaningful personal relationships that are so important to cross selling? How are they going to build the emotional connections that drive customers to them for future needs?
Retail Sector Analysis PowerPoint Presentation Slides arrange insightful content using high-quality design. This PowerPoint slideshow is specially-developed for retail management professionals around the globe. Demonstrate the types of retail formats such as store-based, non-store based, and service-based with visual support. Use our retail industry assessment PPT presentation to represent the key growth drivers within the retail industry. Employ this retail market analysis PowerPoint theme to educate your audience about global, and environmental trends. Easily illustrate types of retail applications like supply chain systems, enterprise retail system, and store operation system. Advanced tools are utilized to visualize data featured in this retail business analysis PPT layout. Elucidate the multi-channel retailing trends with the help of infographic-style formats. Represent your organization’s retailing strategy. Walk your audience through the operations, promotion, and marketing communications in retailing. Showcase merchandise management, inventory management, and control. So, hit the download button now and begin personalization instantly. Our Retail Sector Analysis PowerPoint Presentation Slides are topically designed to provide an attractive backdrop to any subject. Use them to look like a presentation pro. https://bit.ly/2Lr5Zze
Uncovering an Innovative Monetization Strategy to Keep Your Organization Rele...RocketSource
This document discusses innovative monetization strategies for organizations. It notes that focusing solely on customer acquisition is insufficient, and that retention must also be emphasized through innovative revenue models, pricing strategies, and business models aligned with the customer journey. Examples are provided of companies innovating their monetization approaches through various strategies like freemium, value-based, subscription-based, and pay-per-use models. The importance of data-driven optimization of pricing and understanding customer willingness to pay is also highlighted.
Measuring the overall effectiveness of offers is often a struggle.
Whether assessing in-store circulars, digital coupons, direct mailers or other vehicles, the key question is how to ensure promotions are effectively driving total value for a pharmacy.
https://youtu.be/57ghR94SYXM
2014 Customer Loyalty ASEAN Conference: Loyalty PrimeJim D Griffin
Kunal Mohiuddin presents an elegant three-step approach for building a future-ready loyalty program capability. Kunal has more than fifteen years in design and execution of loyalty programs and solutions. Based in India, he has been the architect of numerous enterprise-scale programs, located in over 85 countries and powering over 65 brands. Lassu (lassuloyalty.com) is the ASEAN distributor and reseller of Loyalty Prime – a complete enterprise-class loyalty platform that offers full CRM and loyalty management, and excellent integration to backend systems, like POS, reservations, and ERP. With the Loyalty Prime platform, marketers can easily segment their customers, and then build engagement using social, mobile, website, email, SMS and marketing campaign automation.
Direct marketing is a form of advertising that allows businesses to communicate directly with customers through various channels like email, mobile, online display ads, and direct mail. It emphasizes targeting customers, measuring responses, and accountability. Some key characteristics include using customer databases to target messages, addressing customers directly, and including a clear call to action. Direct marketing is used by businesses of all sizes and can be effective due to its measurability. Common channels include email, search, display ads, mobile apps, telemarketing, radio, and direct mail.
This document discusses the experiences of Asian Americans struggling with their racial identity and assimilation. It describes the pressure some Asian Americans feel to assimilate into white American culture by abandoning their heritage. This is exemplified through stories of feeling like a "banana" - yellow on the outside and white on the inside. The document also examines how class and education levels have impacted rates of intermarriage between Asian Americans and white Americans over time. It notes the challenges Asian American youth face in developing their identity when their heritage is devalued by the dominant culture, and how finding a role in either white or Asian communities has been part of that identity formation process.
Los antivirus son programas que se desarrollaron en la década de 1980 para detectar y eliminar virus informáticos y otros programas maliciosos como malware. Cumplen funciones como vacunar sistemas en tiempo real, examinar archivos en busca de virus, y eliminar virus para reconstruir archivos afectados. Los antivirus monitorean actividades, detectan diversos tipos de amenazas como spam y spyware, y verifican la integridad de sectores críticos para optimizar el rendimiento.
Este documento describe un cronómetro para cubo de Rubik desarrollado en Java. El cronómetro permite a los usuarios registrar y analizar sus tiempos de resolución en sesiones de práctica, generar estadísticas y gráficos, y guardar/cargar datos de sesiones. El proyecto usa estructuras de datos como listas enlazadas, librerías como Timer, KeyListener y JFreeChart, y sigue un diseño de capas con interfaces, lógica y datos.
This document summarizes research on the impact of early motherhood on educational attainment. It finds that teenage mothers typically complete 1-3 fewer years of education than their peers who did not have early children. Sociological theories of critical theory are applied. Programs that provide support for teenage mothers, such as second chance homes, show promise in helping teenage mothers achieve higher educational outcomes. The document advocates for policy changes and programs to support educational attainment among teenage mothers.
Mahesh Kumar Yadav is seeking a career opportunity in mechanical engineering. He has a Diploma in Industrial and Production Engineering from SLIET University with 65% marks. He has skills in operating lathes, drilling machines, shapers, grinders, and CNC machines. He enjoys singing, playing cricket, and reading newspapers.
Valuation Services Practice Brochure_100516Andre Nagel
The document discusses Marsh Valuation Services Practice (VSP) and the benefits of regular asset valuation. VSP provides accurate asset valuations to help clients avoid misaligned insurance premiums and unnecessary exposure to risk due to inaccurate asset values. Regular valuations ensure insurance coverage aligns with current asset values, preventing over- or under-insurance that leads to unnecessary costs or risks.
Un documento sobre alimentación saludable define este término como aquella que proporciona todos los nutrientes esenciales necesarios para mantener la salud. Explica que estos nutrientes incluyen proteínas, carbohidratos, grasas, vitaminas y minerales. Además, señala que las necesidades nutricionales varían según factores como la edad, el sexo y el nivel de actividad física, y propone siete pasos clave para lograr una alimentación balanceada y saludable.
Mahesh Kumar Yadav is seeking a career opportunity in mechanical engineering. He has a Diploma in Industrial and Production Engineering from SLIET University with 65% marks. He has skills in operating lathes, drilling machines, shapers, grinders, and CNC machines. He enjoys singing, playing cricket, and reading newspapers.
The document is a resume for Jamie O'Neill summarizing their experience as a senior IT leader with over 20 years of experience managing quality assurance, software development teams, and IT service delivery across multiple industries. They have a proven track record of leading teams, implementing process improvements, and successfully delivering complex projects on-time and within budget. Currently, they are a Vice President of Business Analyst Managers at Fifth Third Bank leading teams supporting commercial credit and risk businesses.
Oracle Log Analytics Cloud Services solution monitors, aggregates, indexes, and analyzes all log data from your applications and infrastructure (running on-premises or in the cloud). It enables users to search, explore, and correlate this data to troubleshoot problems faster and derive operational insight to make better decisions.
What Is the Value of a Retail Scorecard? - 21 OCT 2014Lora Cecere
This document summarizes the results of a study on the use of retail scorecards by 65 retailers and suppliers. Key findings include:
1. Scorecards have primarily improved on-time shipping performance but have more potential to impact assortment and costs. Both parties see opportunities for improvement that are not yet realized.
2. Retailers and suppliers have different needs and perspectives in using scorecards. Greater alignment is needed to improve areas like assortment.
3. Data sharing practices are still developing, with room for retailers to share more useful data like point-of-sale and inventory data.
4. Scorecards currently focus more on penalties than incentives, though a balanced approach could drive better
Coupon usage has increased in recent years due to the recession, but marketers need better ways to measure coupon effectiveness beyond just redemption rates. Traditional marketing mix modeling has limitations and cannot provide insights on how individual coupons impact consumer behavior. Spire has developed an approach using transaction data from 15 million households to analyze how specific coupons influence purchase behavior of redeemers. This identifies the "consumer role" of each coupon and allows marketers to optimize coupon design to better meet promotional objectives around trial, cross-selling, or blunting competition. Clients have used these insights to guide decisions around coupon face values, expiration dates, and purchase requirements.
Progressive Grocer February 2015 - Grocery Loyalty ArticleGraeme McVie
While some retailers have abandoned loyalty card programs, analysts argue rumors of their death are exaggerated. Retailers that mine customer data through loyalty programs can target promotions, merchandise, and pricing strategies to best satisfy customer needs. Kroger has seen great success through its partnership with Dunnhumby, which uses shopper data to provide personalized offers, drive merchandising decisions, and generate revenue by sharing insights with manufacturers. Technology is now enabling more holistic loyalty programs through mobile apps and wireless identification, allowing retailers to maintain loyalty through rewards and personalized engagement.
The document discusses the importance of retention marketing and focusing on existing customers rather than solely pursuing new customer acquisition. It notes that existing customers typically represent a significant portion of annual sales and spend more over time than new customers. However, many marketers struggle with customer retention due to issues like a lack of integrated customer data. The document advocates using predictive analytics to better understand customer behavior and integrate data to improve targeted, personalized retention campaigns. This can increase sales, optimize discounts, and engage at-risk customers to improve retention rates.
The document discusses how analytics can be used to solve business problems in the retail banking industry. It describes how analytics can be applied to various areas of a bank's profit and loss statement, including acquiring new customers, reducing customer attrition, improving account activation rates, and maximizing revenue from interest, fees, and cross-selling. It also discusses how strategic reporting, marketing analytics, and data-driven insights can be used for segmentation, customer lifetime value analysis, profitability and loyalty analysis, cross-selling strategies, and customer retention programs. The overall aim is to provide a top-down analytical approach to optimize all areas of a bank's operations and financial performance.
This document discusses the symptoms that indicate a company may have problems with its billing and payment processes. It identifies four main symptoms: 1) average interchange fees of 2.5% or higher, 2) inability to identify or quantify best customers, 3) lack of central management of most important accounts, and 4) little to no control over customers' sales experiences. The document argues that implementing a new billing and payment solution can help businesses by decreasing fees, standardizing processes, personalizing customer experiences, and driving new revenue.
Symptoms of a Billings and Payment Problemjwchitwood
This document discusses the symptoms that indicate a company may have problems with its billing and payment processes. It identifies four main symptoms: 1) average interchange fees of 2.5% or higher, 2) inability to identify or quantify best customers, 3) lack of central management of most important accounts, and 4) little control over customers' sales experiences. Implementing a strategic billing and payments solution can help address these problems by decreasing fees, standardizing processes, personalizing the customer experience, and driving new revenue.
Symptoms of a Billings and Payment Payment Problemmarkmoconnell
This document discusses the symptoms that indicate a company may have problems with its billing and payment processes. It identifies four main symptoms: 1) average interchange fees of 2.5% or higher, 2) inability to identify or quantify best customers, 3) lack of central management of most important accounts, and 4) little control over customers' sales experiences. Implementing a strategic billing and payments solution can help address these problems by decreasing fees, standardizing processes, personalizing customer experiences, and driving new revenue.
Symptoms of a Billings and Payment ProblemRutger Gassner
This document discusses the symptoms that indicate a company may have problems with its billing and payment processes. It identifies four main symptoms: 1) average interchange fees of 2.5% or higher, 2) inability to identify or quantify best customers, 3) lack of central management of most important accounts, and 4) little control over customers' sales experiences. Implementing a strategic billing and payments solution can help address these problems by decreasing fees, standardizing processes, personalizing customer experiences, and driving new revenue.
This document discusses the symptoms that indicate a company may have problems with its billing and payment processes. It identifies four main symptoms: 1) average interchange fees of 2.5% or higher, 2) inability to identify or quantify best customers, 3) lack of central management of most important accounts, and 4) little control over customers' sales experiences. Implementing a strategic billing and payments solution can help address these problems by decreasing fees, standardizing processes, personalizing the customer experience, and driving new revenue.
This document discusses the symptoms that indicate a company may have problems with its billing and payment processes. It identifies four main symptoms: 1) average interchange fees of 2.5% or higher, 2) inability to identify or quantify best customers, 3) lack of central management of most important accounts, and 4) little control over customers' sales experiences. Implementing a strategic billing and payments solution can help address these problems by decreasing fees, standardizing processes, personalizing customer experiences, and driving new revenue.
Symptoms of a Billings and Payment Problemmehundley
This document discusses the symptoms that indicate a company may have problems with its billing and payment processes. It identifies four main symptoms: 1) average interchange fees of 2.5% or higher, 2) inability to identify or quantify best customers, 3) lack of central management of most important accounts, and 4) little control over customers' sales experiences. Implementing a strategic billing and payments solution can help address these problems by decreasing fees, standardizing processes, personalizing the customer experience, and driving new revenue.
Symptoms of a Billing and Payments ProblemMSCbcwagner
This document discusses the symptoms that indicate a company may have problems with its billing and payment processes. It identifies four main symptoms: 1) average interchange fees of 2.5% or higher, 2) inability to identify or quantify best customers, 3) lack of central management of most important accounts, and 4) little control over customers' sales experiences. Implementing a strategic billing and payments solution can help address these problems by decreasing fees, standardizing processes, personalizing the customer experience, and driving new revenue.
Customers are becoming less loyal and increasingly likely to use multiple banks. The proportion of customers planning to switch banks has risen from 7% to 12% globally since 2011. Dissatisfaction with high fees is the primary driver of increased attrition rates in several major markets. Additionally, customers are intensifying their search for the best rates and products by using more banks - the number with only one bank has dropped from 41% to 31%, while those with three or more banks has increased from 21% to 32%. This trend towards "multi-banking" is being seen in mature markets and is even higher in emerging markets.
- Shopper marketing spending by CPG manufacturers has more than doubled from 2012 to 2014, increasing from 6% to 13.5% of total marketing budgets. However, some of this increase may have come from reductions in other marketing spending areas like trade promotion.
- Retailers find in-store events, retailer-specific coupons, and digital/mobile promotions to be the most effective shopper marketing vehicles for generating sales. However, many shoppers report that shopper marketing has little impact on their awareness and purchase decisions.
- There is a question of whether the large growth in shopper marketing spending is true incremental investment, or simply a relabeling of existing trade promotion and account-specific marketing budgets and
The document discusses how credit card issuers can leverage customer transaction data to optimize profits through targeted customer engagement initiatives. It recommends a 7 step approach: 1) Implement customer analytics to understand purchase trends, 2) Design reports on spending patterns and profitability, 3) Customize campaigns based on customer insights, 4) Identify upselling/cross-selling opportunities, 5) Enhance individual customer profitability, 6) Improve retention through incentives, 7) Redesign value propositions for customer segments. Implementing this approach can potentially triple customer profitability through higher spend and superior retention.
The document discusses applying decision science techniques to solve various business problems in customer relationship management. It covers topics like prospect targeting and acquisition, customer segmentation, profitability and loyalty analysis, cross-selling and upselling strategies, campaign management, customer lifetime value analysis, and customer retention through churn management. Decision science helps businesses make targeted decisions at each customer lifecycle stage to optimize acquisition, usage, retention, and customer lifetime value.
1. GE Capital Retail Bank
Value of Credit
and Growing
Share of Wallet
Case studies on how Retailer-Branded Credit Programs
affect sales, loyalty, attrition, and share of wallet.
Why Retailer-Branded Credit is critical to retail growth strategy.
shareofwallet6
profit 6
2. Contents
Introduction1
Retail internal view 2
Sales and foot traffic
Case study on annualized sales
Case study on attrition
Case study on tender shift
Retail external view 5
Methodology
Share of wallet
Shifting share
Opportunity to drive additional 7
retail sales with analytics
Elements of a successful credit program 8
Conclusion9
Bibliography10
3. 1
Introduction
In the U.S. retail market, retailers have found that in
a given year, on average, one in five shoppers will not
shop at their stores the following year (i.e., customer
attrition is nearly 22% per year). In an ever-challenging
retail environment, retailers of all sizes are constantly
competing to increase customer satisfaction and
engagement, gain wallet share, and grow incremental
sales. Retailers must provide increased value to
customers while maintaining profit margins.
The question of profitably satisfying customers
often comes down to:
1. Acquiring customer insights through data.
2. Building a unique customer experience across all
channels and touchpoints.
3. Developing tailored offers by leveraging customer
insights to attract and retain customers.
4. Leveraging a retail store card as an opportunity
to maximize loyalty.
Retailers that employ all four strategies have the
best chance of growing customer loyalty and
retaining customers
One approach that has proven effective at increasing
overall customer loyalty is investment in retail credit
card programs. Many case studies have found that
customers who acquire retail store credit cards shop
more often and spend more than customers who pay
with other methods. Retail credit cardholders stay
more engaged, resulting in higher customer lifetime
value and lower customer attrition. Additionally,
retailer card programs save retailers about 2% to 4%
in interchange fees on every transaction processed on
their store cards. This value alone can aid profitability.
Highlights
Retail credit customers have:
• Higher lifetime value
• Lower annual attrition
• More frequent store visits
This paper examines the value of credit from
two perspectives:
1. Retail internal view: Measures the distribution
of sales across payment tender types, analyzing
the percent of sales on credit to total retail
sales; provides an internal share of wallet and
penetration view.
2. Retail external view: Measures how much of
the competitive pie an individual retailer
captures vis-à-vis other competing retailers;
provides an external share of wallet and overall
market penetration.
Retailers’ benefits:
“Do credit programs
lead to higher revenues
in terms of sales and
foot traffic?”
4. 2
Retail internal view
1,2
GE Capital Study: Winter 2010 (data refreshed December 2011)
Sales and foot traffic:
In looking at the retailers’ holistic view of sales across all
payment tenders, case studies have shown that store
cardholders are more engaged. This is reflected in higher
average monthly sales and lower attrition rates. A 2011
study for a large regional department store showed
that store cardholders outspent non-cardholders by
an average of 29%. During the card acquisition period,
sales spiked from initial purchases. When those sales
are included, the average of 29% rises to 43%.
Figure 1: This chart compares two groups (test and
control) where both had identical pre-period purchase
behavior and only differ by customers who obtained a
store card and those who did not.
What is the primary driver of the continued
performance difference in the test group when
both test and control had similar spends in the
pre-period?
Available credit is one factor that led to the initial spike
in larger ticket purchases at the time the customers
acquired a store card, but note the continued separation
in the eight-month-post window between test and
control.1
The monthly spends show that, after the
acquisition spike, the remaining months’ separation is
primarily driven by an increase in foot traffic or average
trip frequency (ATF).
Store visits increase because store cards are typically
designed with compelling value propositions in the form
of exclusive cardholder benefits/discounts and point
programs that offer regular and accelerated points
accumulation. It is this increased foot traffic and the
increase in average ticket size that drive sales lift.
Figure 2b: The Average Ticket Value chart shows
that consumers typically return to the average ticket
amounts observed before the acquisition of a store
card. After the larger initial purchase, consumer
transactions fall back to an average basket size of $55.
However, store visits increase from 1.4 per month to 1.7
per month (nearly four extra trips per year2
). The higher
traffic continues through normal retail and seasonal
cycles. Thus store cards provide value to retailers in
multiple ways:
$160
$120
$80
$40
$0
jan–10
apr–10
jul–10
oct–10
jan–11
apr–11
oct–11
Figure 1: Avg. sales/month per customers
Before Retail Card
After Retail Card
control
test
1.8
1.2
0.6
0.0 jan–10
apr–10
jul–10
jul–11
oct–10
jan–11
apr–11
oct–11
Figure 2a: Avg. trip frequency per month
control
test
$100
$50
$0
jan–10
apr–10
jul–10
jul–11
oct–10
jan–11
apr–11
oct–11
Figure 2b: Avg. ticket value per month
control
test
5. 3
1. Provide a mechanism for retailers to capture sales
on high-ticket special purchases.
2. Generate repeat store visits through increased
value-added card benefits.
3. Provide traceable sales that can capture loyalty
and behavioral data of customers.
4. Increase customer retention over the long term.
In addition, retailers with competitive value
propositions on a store card build incremental
brand affinity and win share from competitors
Higher profitability and
customer lifetime value
Case study on annualized sales:
Higher sales were demonstrated at three different
retailers by measuring customers who shopped with
other tenders in their first year before opening a store
card in their second year. A comparable “look-alike”
control group was selected that matched the test
group in terms of sales and store visits during the
one-year pre-period. Customers in the test group—new
cardholders—had retail spend that ranged from 39% to
86% higher than the comparable control groups. The
higher sales were not due to tender shift, but represent
higher retail sales at each retailer (conclusion based on
full tender data including cash). Not only did the new
cardholders spend more at these retailers, they were
also less likely to leave the retail brand, leading to higher
profitability and higher customer lifetime value.
Case study on attrition:3
A retail credit program drives greater initial
customer engagement in the retail brand. But
what are the longer term effects on attrition? Case
studies show a marked decrease in attrition rates
for store cardholders, who are, on average, 75%
less likely to stop shopping at each retailer.
Cardholder vs. non-cardholder attrition rates
Figure 4: This chart shows comparisons between store
cardholders and non-cardholders over a 12-month
window and across three retail segments: Online,
Specialty, and Department stores. Based on pre-period
purchasing levels, non-cardholders attrite at 28% on
average, whereas customers with store cards attrite
at 6.7%. In the short run, the study found attrition
accounts for a 25% drop in sales. More importantly,
in the long run, the lifetime value of customer attrition
demonstrates even higher losses in customers
and sales.
Case study on tender shift:
When analyzing the lifetime value of customers,
a natural question arises
“How much of the
monthly sales increase
is really an exercise in
‘tender shift’?”
3
GE Capital Study: Attrition Lifetime Value Across Retail Segments, Summer 2011
$1,600
$1,200
$800
$400
$0
Averagesalesupby
59%6
Retailer A Retailer CRetailer B
CardholderNon-cardholder
52% 3
39% 3
86% 3
Figure 3: Annualized retail sales
cardholder vs non-cardholder
50%
40%
30%
20%
10%
0%
Figure 4: Attrition rate
Retailer A Retailer CRetailer B
CardholderNon-cardholder
76% 4
63% 4
88% 4
Cardholdervsnon-cardholder
averageattritionrate
75%5
6. 4
The hypothesis is that store cardholders do not spend
more at the retailer, but instead engage in a “transfer
game” where sales are shuffled from one tender (cash
or debit) to another (the store card itself).
The idea is readily disproved on two points. First, store
cardholders spend more on average after acquiring a
card, and there is a gain in their total wallet size. Second,
modern POS systems coupled with Multi-tender Loyalty
Cards (Frequent Shopper Cards) can capture total retail
sales at an individual or household level.
The store card spend is greater than pre-period spend
across all tenders combined
Examining household payment types on all transactions
demonstrates that spending for retail cardholders
diminishes by roughly 50% across the board for credit
and cash equivalents (including debit cards).4
Figure 5: This chart shows that store card
spending increases overall by 57%. In fact, the
store card spend is greater than pre-period
spend across all tenders combined.
Figure 6: This chart shows there is relatively flat
utilization across all tenders, except an 11% rise
in debit usage, and only a moderate 5% uptick
in year-over-year sales in the control group.
Providing significant economic value to retailers
From an internal perspective, the value of credit is
clearly demonstrated. Retailers gain from higher
incremental spend coupled with lower customer
attrition. Another financial benefit is the gain in
royalties and interchange savings. Store card issuers
typically offer a percentage of sales (“royalty”) back to
the retailer for all sales made on the store card. Retailers
gain royalties on sales and avoid interchange fees as
significant portions of in-store purchases (as much as
60% at some retailers) are processed through store
cards. The combination of royalties and interchange
savings can range from 3% to 5% of the store card
sales—that’s a significant economic value to retailers.
$120
$80
$40
$0
Figure 6: Year-over-year monthly non-cardholder
spend and tender shift
Credit DebitCash
Before-control After-control
11% 3
3% 3
3% 4
+5%
YOY
3
$120
$80
$40
$0
Figure 5: Year-over-year monthly cardholder
spend and tender shift
Before-test
Credit Debit Store cardCash
After-test
+57%
YOY
3
4
GE Capital Study: Tender Shift Through the Lens of Multi-Tender Loyalty Program, Fall 2011
7. 5
Retail external view
Methodology:
While most retailers can determine the distribution of
spend over different tenders for individual shoppers
using their internal data, they are also very interested
in knowing their customers’ spend at competitors.
Using third-party data, it is possible to analyze (on an
anonymous basis) the credit portion of the customer’s
total wallet.
Total credit wallet data can answer the
following key questions:
1. What is the retailer’s share of wallet versus key
competitors?
2. Does the retailer have higher share of
wallet among store cardholders versus
non-cardholders?
3. How does the share and size of wallet change
when a customer opens a retail card?
4. What impact do retailers’ or competitors’
marketing programs have on share of wallet?
In three different studies, consumers who acquired a
store card (test) were compared with a similar group
of customers who did not acquire a card (control). A
clear lift in share of wallet is visible over a period of time
ranging from 16 to 23 months in the test group. Like the
internal example above, test and control populations
were matched on a 6-12 month pre-period, using trips,
spend, geographic distribution, and creditworthiness.
Once consumers were placed into test and control
groups, spending and trips were measured across all
credit cards in the shoppers’ wallets for the 11 months
after the card was issued for the primary retailer and its
self-identified competitive retail set.
Highlights
Store cardholders:
• Have higher sustained lift in store
• Spend 39%-86% more
• After opening a store card, are 75% less likely
to attrite
Higher trip frequency after opening a store card
Figure 7: The test group showed a similar pattern
of lift as observed in the internal example. Shoppers
with retail store cards had higher sustained lift.
This lift was driven by a higher trip frequency that
continued after consumers opened a store card. The
rise in Average Monthly Sales is contrasted against
the flat negative trend in Average Monthly Sales at
corresponding competitors.
Note the slight negative trend observed in the control
group, which emphasizes the importance of a store
card program. The post-acquisition gap between test
and control represents roughly $16 per customer per
month ($192 annually) in favor of the test group. The
introduction of credit and increased spending power
appears to greatly benefit the retailer.
$160
$120
$80
$40
$0
jan–09
Figure 7: Avg. monthly sales at competitors
oct–09
jan–10
apr–10
jul–10
oct–10
apr–11
jan–11
control
test
8. 6
Share of wallet
In another case study, the annualized wallet size of
the control vs. test is $1,360 and $2,120 respectively.
Store cardholders outspent non-cardholders
by $760 or 56%. The control group at the retailer
accounted for 17% of all credit sales versus its
predefined competitors. However, for the cardholder
group, retailers benefited from an increase in total
wallet size and grew wallet share to 38%.5
Shifting share
All things being equal, we would expect the test group
portion of the retailer’s sales to remain steady and
maintain roughly the 17% share of wallet, as seen in
the control group.
However, in the test group, the retailer’s share increased
to 38%. That means roughly $136, or 17% of the $563
increase in spend is attributable to maintaining a base
share of 17% of the larger wallet, while the remaining
$427 comes from the competitors’ share.
As observed in the case studies (above and previous
page), the key driver is a higher number of store visits.
Consumers tend to have slightly greater ticket sizes
than during the pre-card acquisition time period, but
through credit availability and card-based events and
promotions, trip frequency rises.
Although one might attribute a retailer’s overall
marketing and promotions as a key driver of increased
sales, it is important to remember that both test
and control groups were selected from similar
geographies. So both test and control groups were
exposed to the same retail marketing offers and
advertising, right down to in-store promotions and
communications. However, cardholders received
additional offers and maintained greater awareness
through cardholder communications and card usage.
Shifting share: Composition of $563 sales increase
$235
$798$427
Attributed to
share shift
Expected
17% share of
larger wallet
$136
Shopper Larger
wallet
Share
shift
Cardholder
Retailer shareCompetitor share
83%
17%
62%
38%
Share of wallet
Control Test
5
Argus Information and Advisory Services and internal GE analysis: Share Of Wallet and Demographic Segments, Winter 2011
9. 7
One of the primary benefits of having a retail card
program is the ability to capture a robust set of data on
your customers. While a Multi-tender Loyalty program
captures some of this data, some retailers have limited
success in tracking individual customer purchases and
preferences on most tenders, and the program can be
expensive to manage.
The store card becomes a traceable tender that allows
retailers to determine 1) how much customers spend;
2) how often and what time of the day or month they
shop; 3) what they buy; and 4) the promotions and
channels they are more likely to respond to. This allows
retailers to develop a data-driven strategy to optimize
their marketing dollars and increase ROI.
The full value of credit is not achieved without a
competitively designed and well-managed program.
Successful programs can have a significant financial
impact, but require organizational commitment. Next
we turn our attention to how retailers can establish
a world-class credit program, leading to incremental
sales, higher retailer brand loyalty, increased customer
satisfaction, and higher lifetime retention.
Highlights
Developing a strong credit program:
• Associate training
• Store signage and online visibility
• Card promotions and offers
• Store/District accountability
• Best customer program
• Best value props on the card
Opportunity to drive
additional retail sales
with analytics
store card
other credit cards
debit cards
check and cash
equivalents
100%
60%
12%
10%
Tender traceability
% of traceable sales by tender
10. 8
Offering credit by itself can yield strong benefits, but
offering credit with a compelling value proposition
magnifies the impact. Successful programs focus on
engagement at both the customer and store level.
Signage is a key component to attracting customers
and building awareness of the program. Associates
need training and should ask each customer if they
want to open a store card, and be able to discuss
the benefits. Whether sales are primarily brick and
mortar or online, it is important to leverage online
branding and marketing methods. Prominent banner
ads and well-placed interstitials at checkout offer
opportunities to grow loyalty and incremental spend.
Best-in-class programs engage associates in offering
credit. New hires are coached in core values of the
program, including customer benefits, saving the retailer
interchange fees, and building brand loyalty. Associates
train with role playing to be certain they express card
benefits appropriately during all customer interactions.
Store and District managers need to play a strong role in
driving associate accountability and creating a credit-
based culture to promote a successful card program.
Additionally, repeated studies show that,
on average, store cardholders shopped
more frequently and spent 30% more than
non-cardholders
Up to 50% of all retail transactions might be placed on
the store-branded card, saving the company roughly
2%-4% in third-party interchange fees, and often earn
retailers royalties over competing forms of payment.
Interchange fees are the network and banking transfer
fees between the financial institutions that underwrite
and process credit card transactions. Royalties or
participation fees are incentives that a retailer receives
from card issuers for processing store card transactions.
Best-in-class store card programs offer strong value
propositions on the store card. This is because the
retailer knows how the program drives customer
engagement, and increasing the store card share of
retail sales provides economic value back to the retailer.
A branded retail card is not merely a loyalty
program; it is the foundation of a successful
loyalty program
Rewarding customers with relevant and timely
offers that they deem valuable will increase overall
brand engagement and retention. Acquiring deep
customer insights through data mining is the key to the
development of a customer segmentation strategy. This
will allow a retailer to identify its most valuable customers
and, therefore, maximize return on investment in the most
productive segments. Tiered credit programs offer an
opportunity to differentiate how segments of customers
are treated based on reaching desired spending
thresholds. This allows retailers to create a unique
customer experience, adding to overall customer value
and satisfaction.
Elements of a successful
credit program
11. 9
Well-managed, retailer-branded credit programs can
increase customer satisfaction, engagement, and
long-term retention. Retailers that utilize branded cards
combined with targeting techniques increase foot
traffic, drive incremental sales, and save on interchange
fees. By providing customers with strong value
propositions and a means of purchase, retailers can
decrease attrition, increase customer lifetime value,
and shift share from competitors.
Authors:
Irving Turner, Mgr. Retail Marketing Analytics, GECRB,
irving.turner@ge.com
David Liebskind, Retail Analytics Leader, GECRB,
david.liebskind@ge.com
Sanjay Sidhwani, VP Marketing Analytics, GECRB,
sanjay.sidhwani@ge.com
Contributors:
Dori Abel, Gautam Borooah, Muhammad Haider,
Rob A. Hengelbrok, Doug R. Hooper, Dilip John, Ann Lindsay,
Valerie Thomas, Jennifer Vinas, Nilesh Yagnik, Sarah Zupnick
Conclusion