Download as PDF, PPTX
![OCEANOGRAPHIC SETTING
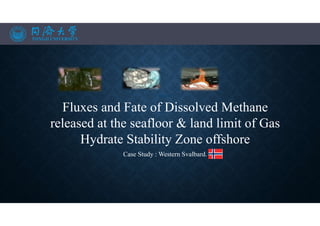
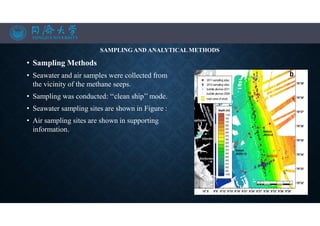
Map of the study area and water column sampling sites. Bathymetry in Figure
1a is from the GEBCO_08 Grid version 20100927 (http://gebco.net), contour
interval is 100 m; light blue indicates He-386 cruise track, and yellow
rectangle indicates the area expanded in Figure 1b, showing shipboard
bathymetry from cruise JR253. Red circles show positions of
cruise JR253 sampling stations; red lines indicate sampling transects T1–T4.
Blue diamonds show sampling stations from cruise MSM21/4. Locations of
seafloor bubble seeps identified by shipboard sonar during sampling are
indicated by crosses. (c) The dominant direction of the main ocean currents in
this region: the West Spitsbergen Current (WSC) in red, and the
East Spitsbergen Current (ESC) in blue, modified from Saloranta and
Svendsen [2001].](https://image.slidesharecdn.com/marineresourcesandexploration-201219080636/85/Gas-hydrates-13-320.jpg)
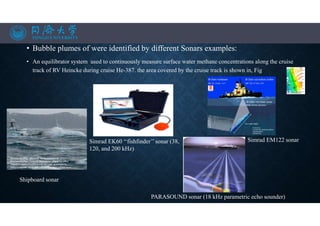
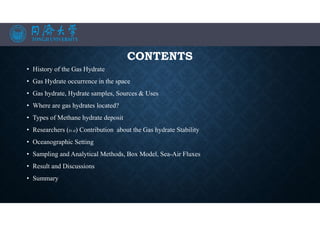
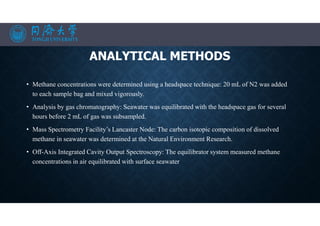
![• Samples for methane isotopes were taken into 125 mL glass vials with crimp
seal tops, and poisoned
with 2 mL saturated mercuric chloride solution (MSM21/4, MASOX site only.
• Quadruplicate samples for methane oxidation rate measurements were
collected in 20 mL crimp-top vials, and filled bubble free (MSM21/4 only).
• Air samples were collected as described in Fisher et al. [2011], from the
ship’s bridge (16 and 29 m above sea level for JR253 and MSM21/4,
respectively) by directing a hose into the direction of incoming wind and
pumping into 5 L Tedlar bags.
Glass vials with crimp seal tops
Tedlar bags.](https://image.slidesharecdn.com/marineresourcesandexploration-201219080636/85/Gas-hydrates-18-320.jpg)
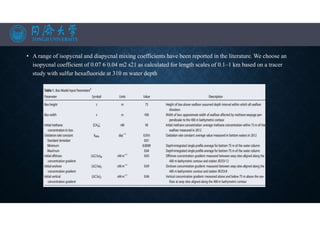
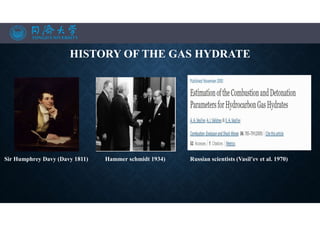
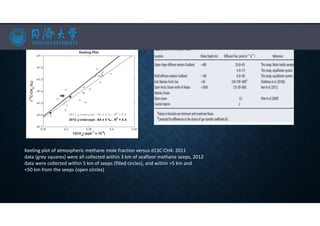
![SEA-AIR FLUXES
• The flux of methane from surface waters to the atmosphere is given by:
• Where k is the gas transfer velocity and [CH4]surface and [CH4]equilibrium are, respectively, the
measured concentration of methane in surface seawater and the calculated concentration of methane in
surface seawater at equilibrium with the atmosphere.
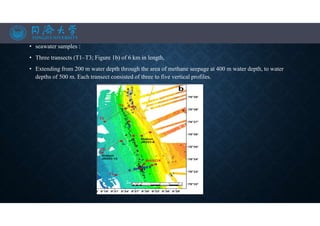
Distribution of methane along east-west transects T1–T3, and north to south along transect T4 for transect locations).
Sampling points are shown by the open circles. Contours show the density anomaly (rh; kg/m3).](https://image.slidesharecdn.com/marineresourcesandexploration-201219080636/85/Gas-hydrates-22-320.jpg)

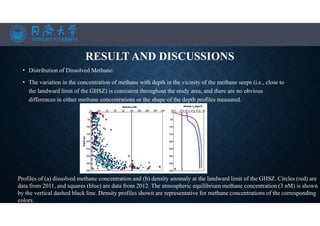
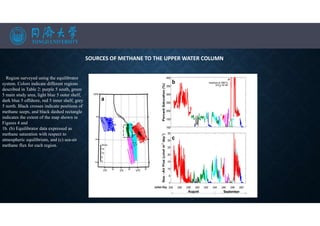
![FLUXES, SOURCES, AND FATE OF DISSOLVED METHANE IN THE WATER COLUMN
OFFSHORE SVALBARD
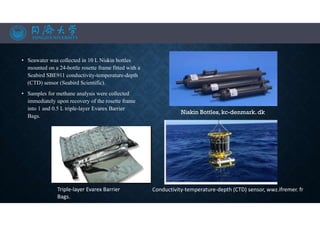
Methane concentration in surface seawater measured using the equilibrator system during RV Heincke cruise He-387.
Black crosses show the location of seafloor methane seeps mapped during the cruise [Sahling et al., 2012, 2014]. Yellow
star indicates the position of the depth profile sampling station (cruise MSM 21/4) to the south of the main study area.](https://image.slidesharecdn.com/marineresourcesandexploration-201219080636/85/Gas-hydrates-25-320.jpg)
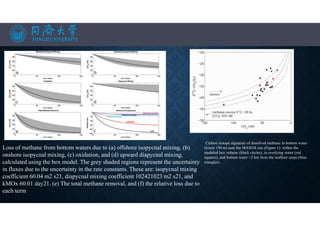


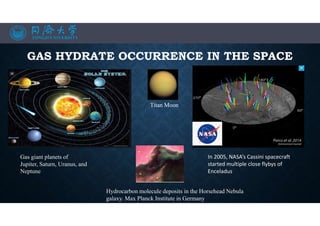
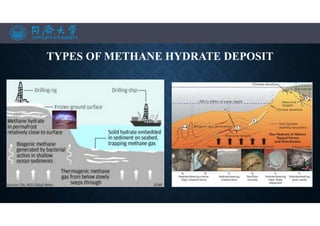
The document discusses the fate of methane released at the seafloor and the stability of gas hydrates offshore Western Svalbard. It highlights that high concentrations of dissolved methane are primarily lost through oxidation and advection by strong bottom water currents, while vertical mixing may contribute to methane escape into the atmosphere. The findings suggest that aerobic methanotrophy serves as a barrier to substantial methane release from gas hydrates to the atmosphere.


