
Recommended
More Related Content
What's hot
What's hot (19)
Similar to GAP Statistical Analysis Report
Similar to GAP Statistical Analysis Report (17)
GAP Statistical Analysis Report
- 1. *This denotes that there were respondents in the data who did not respond and the inference procedure was performed without the respondents accounted for. July5, 2016 To: GrameenAustraliaPhilippines From: AlexandraNolan;EducationandCapacityBuildingIntern RE: Analysisof Rise inHouseholdIncome of Centers 1. Project Description:This report will show the impact on household income of beneficiaries in the past 6 months that Grameen Australia Philippines has made via microfinance loans. The first tests which will be run are correlations and linear regression analyses, and the results will determine if any statistically significant augmentation in average household income of each center exists. These tests will also determine what specific variables contribute to the augmentation, should one exist. The second test will be a chi-squared test for goodness of fit, which will determine if there is a difference in the success rates of the loans in augmenting household income amongst the centers. If there is a difference, this test will show which center(s) is (are) yielding higher results and which is (are) yielding a lower income augmentation. The final tests will be a T test for means and a T confidence interval for means, which will determine if the change in average household income of the beneficiaries is different from the national average change in household income. It will also determine if the average household income of the beneficiaries is growing at a faster or slower rate than the national average, if in fact there is a difference. This will provide a wider scope of analysis of Grameen Australia Philippines’ impact. 2. Recommendations 2.1.1 Question1: Are the loans of Grameen Australia Philippines providing a statistically significant augmentation in household income in the centers? 2.1.2 Exploratory DataAnalysis: To precisely and accurately answer the proposed research question, it is important to analyze the descriptive statistics, along with the visual of a box plot comparison. Both box plots are skewed right, however the “Average Income After 6 Months” is much higher on the scale than the box plot of “Average Baseline Income”. Perhaps the most important indication of the augmentation in average household income of beneficiaries is the values from the descriptive statistics in comparison to each other. The “Average Baseline Income” box plot has a MEDIAN income of just 12,200 PHP, whereas 12,000 PHP is the MINIMUM value of “Average Household Income After 6 Months”. This means the previous average amount that the beneficiary could earn, has become the minimum amount of household income a beneficiary could earn; thus representing the overall shift from one equilibria to the next. The maximum value of average
- 2. *This denotes that there were respondents in the data who did not respond and the inference procedure was performed without the respondents accounted for. household income also augmented from 27,418 PHP to 32,977 PHP in just 6 months. That is an impressive growth rate of 20%. Based on this information, we may predict that the inference procedures of correlation and regression will be statistically significant. Descriptive Statistics: Average Baseline Income, Average Income After 6 Months Variable N N* Mean SE Mean StDev Minimum Q1 Median Q3 Average Baseline Income 5 0 14769 3734 8349 7467 7800 12200 23022 Average Income After 6 M 5 0 19043 4098 9164 12000 12485 13391 28426 Variable Maximum Average Baseline Income 27418 Average Income After 6 M 32977 2.1.3 Inference Procedures: To precisely and accurately answer the research question, the correlation tests as well as linear regression analyses were run. Part A consists of tests run on Average Household Incomes and Average PHP of donations, whereas Part B explores the Overall Household Incomes as well as the Total Amount of PHP loaned. For these tests, the alpha level of significance will be 0.05, or 5%. The “moderately significant” alpha level of significance will be
- 3. *This denotes that there were respondents in the data who did not respond and the inference procedure was performed without the respondents accounted for. 0.10, or 10%. If the P-Value, which stands for probability, is less than these alpha values, it is significant data. For the correlation analyses, a strong correlation is one that is closer to the absolute value of 1. A weak correlation is closer to 0. A strong correlation will be defined as |0.9| or |0.8|. A fairly strong correlation will be defined as |0.7| or |0.6|. A medium strength correlation will be defined as |0.5|, and a weak correlation will be defined as |0.4| or |0.3|. Part A: Averages Correlation: Average Baseline Income, Average Income After 6 Months Pearson correlation of Average Baseline Income and Average Income After 6 Months = 0.984 P-Value = 0.002 Correlation: Avg PHP/Person Loaned Cycle 1, Average Income After 6 Months Pearson correlation of Avg PHP/Person Loaned Cycle 1 and Average Income After 6 Months = -0.037 P-Value = 0.952 Above are the results of the correlation analyses ran on average incomes. The first test shows the strength of the correlation between the variables “Average Baseline Income” and “Average Income After 6 Months”. The Null Hypothesis here would be that there is no correlation between the two variables. The Alternative Hypothesis would be that there is a correlation between the two variables. Based on the results, the P-Value is 0.002, which is much less than the 0.05 alpha significance level. The correlation is a positive direction of 0.984, which is very close to 1 and therefore very strong. Thus, we may conclude that the data is significant. We may reject the Null hypothesis in favor of the Alternative hypothesis. There is a strong correlation between “Average Baseline Income” and “Average Income After 6 Months”. In other words, the “Average Baseline Income” heavily determines the “Average Income After 6 Months”. The second test shows the strength of the correlation between the variables “Average PHP/Person Loaned in Cycle 1” and “Average Income After 6 Months”. The Null Hypothesis here would be that there is no correlation between the two variables. The Alternative Hypothesis would be that there is a correlation between the two variables. Based on the results, the P-Value is 0.952, which is much higher than both the 0.10 and the 0.05 alpha significance levels. The correlation is in the negative direction, with a very weak correlation of 0.037. Thus we may conclude that the data is insignificant. We may not reject the null hypothesis that there is no correlation. There is no statistically significant correlation between the two variables, suggesting that the “Average PHP/Person Loaned in Cycle 1” does not have a
- 4. *This denotes that there were respondents in the data who did not respond and the inference procedure was performed without the respondents accounted for. statistically significant impact on “Average Income After 6 Months”. However, there may be a weak negative correlation which has potential to grow stronger. Regression Analysis: Average Income A versus Avg PHP/Person L, Average Baseline Analysis of Variance Source DF Adj SS Adj MS F-Value P-Value Regression 2 327834045 163917023 40.40 0.024 Avg PHP/Person Loaned Cycle 1 1 2592347 2592347 0.64 0.508 Average Baseline Income 1 327366012 327366012 80.69 0.012 Error 2 8113836 4056918 Total 4 335947882 Model Summary S R-sq R-sq(adj) R-sq(pred) 2014.18 97.58% 95.17% 87.35% Coefficients Term Coef SE Coef T-Value P-Value VIF Constant -386 4787 -0.08 0.943 Avg PHP/Person Loaned Cycle 1 0.541 0.677 0.80 0.508 1.02 Average Baseline Income 1.092 0.122 8.98 0.012 1.02 Regression Equation Average Income After 6 Months = -386 + 0.541 Avg PHP/Person Loaned Cycle 1 + 1.092 Average Baseline Income Above is the linear regression analysis result of average income values. This test determines the “Y” dependent variable of “Average Income After 6 Months”. The independent variables used to determine the Y variable are “Average PHP/Person Loaned in Cycle 1” and “Average Baseline Income”. As represented above, the only significant P-Value is that of “Average Baseline Income”, which would mean that is the only independent variable which significantly contributes to the outcome of “Average Income After 6 Months.” However, as represented by the equation we can see that the “Average PHP/Person Loaned in Cycle 1” does augment the “Average Income After 6 Months”; just not at a statistically significant level. In other words, for every 1 additional PHP loaned, the beneficiary’s “Average Income After 6 Months” will increase by 0.541. For every 1 additional PHP the beneficiary already had in their “Average Baseline Income”, their “Average Income After 6 Months” will increase by 1.092. Therefore, we may conclude that “Average Baseline Income” plays a larger role in determining “Average Income After 6 Months” than “Average PHP/Person Loaned in Cycle 1”…however both independent variables do positively contribute to the dependent variable of “Average Income After 6 Months”.
- 5. *This denotes that there were respondents in the data who did not respond and the inference procedure was performed without the respondents accounted for. Part B: Overall Correlation: Overall Income After 6 Months, Overall Baseline Income Pearson correlation of Overall Income After 6 Months and Overall Baseline Income = 0.983 P-Value = 0.003 Correlation: Total PHP Loaned Cycle 1, Overall Income After 6 Months Pearson correlation of Total PHP Loaned Cycle 1 and Overall Income After 6 Months = 0.496 P-Value = 0.395 Above are the results of the correlation analyses on overall incomes. The first test results show the correlation between the two variables “Overall Baseline Income” and “Overall Income After 6 Months”. The Null Hypothesis here would be that there is no correlation between the two variables. The Alternative Hypothesis would be that there is a correlation between the two variables. The P-Value here is 0.003, which is much less than the 0.05 alpha significance level. The correlation value is a positive 0.983, which is very close to the value 1. Based on these results, we may conclude that the data is significant. We may reject the Null Hypothesis in favor of the Alternative hypothesis. There is a strong correlation between the two variables, meaning that the “Overall Income After 6 Months” is very dependent on the “Overall Baseline Income”. The second test results show the correlation between the variables “Total PHP Loaned in Cycle 1” and “Overall Income After 6 Months”. The Null Hypothesis here would be that there is no correlation between the two variables. The Alternative Hypothesis would be that there is a correlation between the two variables. The P-Value is 0.395, which is much higher than both the 0.10 and 0.05 alpha levels of significance. The correlation is a positive direction with a value of 0.496, which is a weak correlation. Based on these results, the data is not significant. This means we may not reject the null hypothesis. There is no statistically significant correlation between the two variables, meaning there is no significant impact on “Overall Income After 6 Months” from “Total PHP Loaned in Cycle 1”. However, there may be a weak positive correlation which has potential to grow stronger. Regression Analysis: Overall Income A versus Overall Baseline, Total PHP Loaned Analysis of Variance Source DF Adj SS Adj MS F-Value P-Value Regression 2 2.58244E+11 1.29122E+11 150.02 0.007 Overall Baseline Income 1 1.94162E+11 1.94162E+11 225.58 0.004 Total PHP Loaned Cycle 1 1 7087282331 7087282331 8.23 0.103 Error 2 1721418732 860709366
- 6. *This denotes that there were respondents in the data who did not respond and the inference procedure was performed without the respondents accounted for. Total 4 2.59965E+11 Model Summary S R-sq R-sq(adj) R-sq(pred) 29337.8 99.34% 98.68% 52.43% Coefficients Term Coef SE Coef T-Value P-Value VIF Constant -10602 25443 -0.42 0.717 Overall Baseline Income 1.1110 0.0740 15.02 0.004 1.14 Total PHP Loaned Cycle 1 0.515 0.179 2.87 0.103 1.14 Regression Equation Overall Income After 6 Months = -10602 + 1.1110 Overall Baseline Income + 0.515 Total PHP Loaned Cycle 1 Above are the results of the regression analysis on overall values. This test determines the result of the “Y” value of the dependent variable “Overall Income After 6 Months”. The independent variables used to determine this “Y” dependent variable are “Overall Baseline Income” and “Total PHP Loaned in Cycle 1”. Here we see that the only significant P-Value is that of the “Overall Baseline Income”, suggesting it is the only statistically significant variable which contributes to the dependent variable value. Despite this, both independent variables contribute positively to the “Overall Income After 6 Months”. When analyzing the regression equation, we see that for every 1 additional PHP loaned, the “Overall Income After 6 Months” increases by 0.515. For every additional PHP of “Overall Baseline Income”, the “Overall Income After 6 Months” increases by 1.11. Both variables have the potential to significantly increase “Overall Income” in the future. 2.1.4 Summary: While the loans of Grameen Australia Philippines in the first 6-month cycle have not directly impacted the augmentation of average household income or overall income of a center in a statistically significant value, the loans of Grameen Australia Philippines in the first 6-month cycle have contributed at a statistically insignificant value to the augmentation of average household income as well as overall center income; with the potential to grow into a statistically significant impact in income augmentation. Based on the result that baseline incomes are very highly correlated to incomes after 6 months, every small augmentation in income that Grameen Australia Philippines contributes to will have a ripple effect:
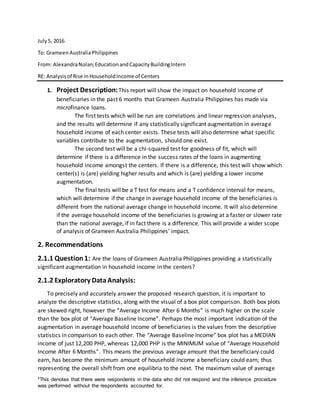
- 7. *This denotes that there were respondents in the data who did not respond and the inference procedure was performed without the respondents accounted for. 1) Grameen Australia Philippines loans 2) augment baseline income after 6 months by a small value- 3) new, larger baseline income to contribute to the next 6 months at a significant value level. 4) Eventually, with enough funds from donors and growth amongst PHP values in loans and members of Grameen Australia Philippines, the loans will provide a statistically significant impact on growth in incomes of the beneficiaries. Therefore, we may conclude that currently the loans of Grameen Australia Philippines are in fact contributing to growth of household incomes of the beneficiaries, just not at a statistically significant level as of yet. The incomes certainly grew, as we can see in the exploratory data analysis section. Based on the regression analyses, we certainly see the loans as an important factor to the positive contribution to incomes. We may safely predict that will additional members and additional donor funds, the loans of Grameen Australia Philippines will very soon reach a statistically significant level of impact on household income augmentation of beneficiaries. 2.2.1 Question2: Is there a statistically significant difference in the average household income and/ or the overall income change amongst centers which received loans from GAP? 2.2.2 Exploratory DataAnalysis: To accurately predict the outcomes of inference procedures which will be run, it is important to analyze the income growth in PHP of the centers compared to each other in a bar graph format. As we can see based on the graphs of observed values, the centers all grew in both average and overall incomes. The growth in average incomes (per member) are greater than the overall incomes (per center), although Bagbag and Taytay exceled in both scenarios. It seems Payatas grew the least in each category. Based on these graphs, there appears to be a significant difference in growth amongst the centers in both average incomes and overall incomes. There could be many factors contributing to the differences in growth. The differences could be due to baseline income amount, internal challenges a center faces, external challenges, or due to the amount of aid the center received. The apparent difference in growth amongst the centers will be statistically tested in the next section.
- 8. *This denotes that there were respondents in the data who did not respond and the inference procedure was performed without the respondents accounted for. A) Average Incomes
- 9. *This denotes that there were respondents in the data who did not respond and the inference procedure was performed without the respondents accounted for. B) Overall Incomes 2.2.3 A) Inference Procedure: Chi- Squared Tests for Goodness of Fit To more precisely and accurately answer the second research question, two separate Chi-Squared Tests for Goodness of Fit will be run. From the results of the inference procedures carried out in section 1, we know that the centers are growing in household incomes. These tests are used to determine if the centers are growing at an equal rate. If the centers are growing at an unequal rate, the tests will also tell us which centers are doing better and which are doing worse. The alpha levels of significance will remain the same, with 0.10 being the “moderately significant” level, and the 0.05 at the “very significant” level. The variable used in the first Chi-Squared Test was the “Change in Average Income PHP” variable. The variable used in the second Chi-Squared Test was the “Change in Overall Income PHP” variable.
- 10. *This denotes that there were respondents in the data who did not respond and the inference procedure was performed without the respondents accounted for. Part A: Averages (Incomes Per Member) Chi-Square Goodness-of-Fit Test for Observed Counts in Variable: Change in Average Income PHP Using category names in Center Name Test Contribution Category Observed Proportion Expected to Chi-Sq Taytay 4836.6 0.2 4274.04 74.05 Caloocan 5250.0 0.2 4274.04 222.86 Payatas 1191.2 0.2 4274.04 2223.63 Montalban 4533.3 0.2 4274.04 15.73 Bagbag 5559.1 0.2 4274.04 386.37 N DF Chi-Sq P-Value 21370.2 4 2922.64 0.000
- 11. *This denotes that there were respondents in the data who did not respond and the inference procedure was performed without the respondents accounted for. Above are the results of the Chi-Squared Test for Goodness of Fit run on the variable “Change in Average Income PHP”. The expected values would all be equal dividends of 4,274.04 PHP raised of average income of a center. The Null hypothesis here would be that all the means are equal, in other words, μ1=μ2=μ3=μ4=μ5. The Alternative hypothesis here would be that the mean growth in average incomes are not all equal; at least one, or all of them are not different. In other words, μ1≠μ2≠μ3≠μ4≠μ5. The P-Value was 0.00, which is very highly significant. This means we may reject the Null hypothesis in favor of the Alternative hypothesis and say that the average growth in income in PHP is not equal amongst the centers. Some centers are growing at a faster rate than others. More specifically, we can see that 4/5 centers had observed values larger than the expected values, meaning they grew more than expected. That’s great news! The only center which grew much less than expected was Payatas, with only a 1,191.20 PHP raise in average income. The centers which grew more than expected are listed here in order from the most growth in average income after 6 months to the least growth in average income after 6 months: 1) Bagbag 2) Caloocan 3) Taytay 4) Montalban The fact that the centers grew at different rates in average incomes may be due to a variety of factors such as loan amounts, participation by members (both qualitative and quantitative), location, or social business type.
- 12. *This denotes that there were respondents in the data who did not respond and the inference procedure was performed without the respondents accounted for. Part B: Overall (Income of Entire Center) Chi-Square Goodness-of-Fit Test for Observed Counts in Variable: Change in Overall Income PHP Using category names in Center Name Test Contribution Category Observed Proportion Expected to Chi-Sq Taytay 154450 0.2 73261 89974.9 Caloocan 42000 0.2 73261 13339.3 Payatas 20250 0.2 73261 38358.3 Montalban 27200 0.2 73261 28959.7 Bagbag 122405 0.2 73261 32966.1 N DF Chi-Sq P-Value 366305 4 203598 0.000
- 13. *This denotes that there were respondents in the data who did not respond and the inference procedure was performed without the respondents accounted for. Above are the results of the Chi-Square Test for Goodness of Fit run on the variable “Overall Change in Income PHP”. The expected values of equality are all set at 73,261 PHP in overall income augmentation per center. The Null hypothesis would be that the means of overall income augmentation of the centers are all equal, in other words μ1=μ2=μ3=μ4=μ5. The Alternative hypothesis would be that the means of the overall income augmentation of the centers are not equal; there are one or more differences amongst them. In other words, μ1≠μ2≠μ3≠μ4≠μ5. The P-Value here is 0.00 which is very significant. This means that the means are not equal amongst the centers. Some centers are growing faster than others in terms of overall income augmentation of the center. More specifically, in terms of overall income augmentation of the center, 3/5 centers have observed values lower than the expected values. This means these 3 centers, namely Payatas, Montalban, and Caloocan, have not met the expectation of income growth of the center as a whole. On the other hand, Taytay and Bagbag have observed values which greatly surpass the expected values, suggesting they are thriving in terms of overall income augmentation. The centers are listed here in order from most growth in overall income to least growth: 1) Taytay 2) Bagbag 3) Caloocan 4) Montalban 5) Payatas Again; the fact that the centers grew at different rates in overall incomes may be due to a variety of factors such as loan amounts, participation by members (both qualitative and quantitative), location, or social business type. 2.2.4 Summary Based on the descriptive statistics and the results from both Chi-Squared Tests for Goodness of Fit we may conclude that the centers are growing in both terms of average income augmentation (income per member within a center) and overall income augmentation (the center as a whole). The tests yielded P-Values of 0.00, meaning that the centers are in fact growing at different rates in both terms of average income augmentation and overall income augmentation. The results of average income augmentation differ from those of overall income augmentation. The one similarity between the tests was witnessed in the case of Payatas, which had the lowest growth rates in both tests. Although the average incomes and overall
- 14. *This denotes that there were respondents in the data who did not respond and the inference procedure was performed without the respondents accounted for. incomes of Payatas did increase, Payatas did not meet the requirement of expected values in either test. Therefore, it is safe to say Payatas has experienced the least amount of success from the Grameen Australia Philippines Loan cycle. Bagbag and Taytay are the only two centers which met their respective expected values; in fact surpassed them. It is safe to say that Bagbag and Taytay have been the most successful in the Grameen Australia Philippines loan cycle, however Montalban and Caloocan have also performed well. Based on this information, we may speculate that outside factors may be impacting the success rates in the centers. These outside factors may include (but are not limited to) loan amounts, willingness and participation/attendance of members, number of members in a center, the location, the weather, or the social business type. With this information, we may explore the factors causing the unequal growth rates to provide a solution for each unique challenge faced by a specific center. 2.3.1 Question3: Is the average household income change different than the average household income change of the Philippines as a nation? 2.3.2 Exploratory DataAnalysis To accurately interpret the inference procedure results below, first it is crucial to analyze the growth rates of average and overall incomes amongst centers as a percentage in a bar graph comparison format. Growth rates differ from PHP analysis because growth rates standardize the comparison to an equal playing field. In this analysis, it is clear which center(s) is (are) actually thriving and which is (are) not. Taytay remains a strong center even in growth rates, while Bagbag has proven to be a lower growth rate than in PHP terms and Montalban has surpassed the mediocrity of PHP measures in terms of percentage growth rate. A) Average Growth Rate
- 15. *This denotes that there were respondents in the data who did not respond and the inference procedure was performed without the respondents accounted for. B) Overall GrowthRate 2.3.3 Inference Procedure: T testformeans To more preciselyandaccuratelyanswerthe question,aseriesof One-SampleT-Testswill be run. The firstOne-SampleT-Testwillbe runusinganoverall rate of growth of the centerscombined, comparedto the national average growthrate.The following5 testswill be runon the individualcenter growthrates comparedtothe national average growthrate. The alphalevelsof significance will againbe 0.10 for “moderatelysignificant”and0.05 for“verysignificant”. A) Overall Beneficiary Average Income: One-Sample T: Change in Average Income as a % Test of μ = 0.0479 vs > 0.0479 Variable N Mean StDev SE Mean 95% Lower Bound T P Change in Average Income 5 0.356 0.232 0.104 0.135 2.97 0.021 Above are the results of the One-Sample T-Test run on “Change in Average Income as a %” of the centers combined as a whole. The Null hypothesis here would be that there is not a statistically significant difference between the average growth rate of beneficiaries of Grameen Australia Philippines and the national average growth rate of the Philippines, which is 0.0479 or 4.79%. More specifically, this test was tailored so that the Null hypothesis states that the means are equal in other words, μ=μ when “1” represents Grameen Australia Philippines and “2”
- 16. *This denotes that there were respondents in the data who did not respond and the inference procedure was performed without the respondents accounted for. represents the national average. The Alternative hypothesis would state that the growth rate of the beneficiaries’ household income of Grameen Australia Philippines is faster than that of the national average growth rate of household income, in other words μ1>μ2 when “1” represents Grameen Australia Philippines and “2” represents the national average. The P-Value here is 0.021, which is much less than the 0.05 “very significant” alpha level. Since the data is significant, we may reject the Null hypothesis in favor of the Alternative hypothesis that Grameen Austraia Philippines is providing a faster household income growth rate than the national average. The national average growth rate, as calculated from the growth in GNI per capita information between 2013 and 2014 from the World Bank, is 0.0479, or 4.79%. The growth rate of the household income of Grameen Australia Philippines centers combined is 0.356, or 35.6%. This means that at a holistic level, Grameen Australia Philippines is significantly impacting household income growth more than the national augmentation rate. B) The following One-Sample T-Tests were carried out by hand due to the nature of the data; the following equation was used: t= (x̄-μ)/s/√n Where: x̄= the sample mean (average growthrate of center) μ is the populationmean(national average growthrate) s= the sample standarddeviation n= sample size df= “degreesof freedom”=n-1 The Null hypothesesforeachwill be:The sample meanisequal tothe populationmean. (μ=0.0479) The Alternative hypothesesforeachwill be:The sample meanisgreaterthanthe population mean.(μ>0.0479). The alpha level of significance is0.05 or 5%. Taytay: μ= 0.0479 x̄ = 0.347 s= 0.325
- 17. *This denotes that there were respondents in the data who did not respond and the inference procedure was performed without the respondents accounted for. n= 32 df= 31 (so 30) T-Value= 5.35 P-Value= 0.00 The P-Value<alphalevel.The dataissignificant.We rejectthe Null hypothesisinfavorof the Alternativehypothesis.Taytay’shouseholdincome perpersonisgrowingata statisticallysignificant fasterrate thanthe national average growthrate due to GrameenAustraliaPhilippinesloans. Caloocan: μ= 0.0479 x̄ = 0.314 s= 0.193 n= 8 df= 7 T-Value= 3.902 P-Value= 0.0029 The P-Value<alphalevel.The dataissignificant.We rejectthe Null hypothesisinfavorof the Alternativehypothesis.Caloocan’shouseholdincome perpersonisgrowingatastatisticallysignificant fasterrate thanthe national average growthrate due to GrameenAustraliaPhilippinesloans. *Payatas: μ= 0.0479 x̄ = 0.3 s= 0.245 n= 15 df= 14 T-Value= 4.0 P-Value= 0.0007
- 18. *This denotes that there were respondents in the data who did not respond and the inference procedure was performed without the respondents accounted for. The P-Value<alphalevel.The dataissignificant.We rejectthe Null hypothesisinfavorof the Alternativehypothesis. Payatas’ householdincomeperpersonisgrowingata statisticallysignificant fasterrate thanthe national average growthrate due to GrameenAustraliaPhilippinesloans. Montalban: μ= 0.0479 x̄ = 0.812 s= 0.1.14 n= 6 df= 5 T-Value= 3.069 P-Value= 0.0139 The P-Value<alphalevel.The dataissignificant.We rejectthe Null hypothesisinfavorof the Alternativehypothesis. Montalban’shouseholdincome perpersonisgrowingata statisticallysignificant fasterrate thanthe national average growthrate due to GrameenAustraliaPhilippinesloans. *Bagbag: μ= 0.0479 x̄ = 0.196 s= 0.255 n= 21 df= 20 T-Value= 2.68 P-Value= 0.0072 The P-Value<alphalevel.The dataissignificant.We rejectthe Null hypothesisinfavorof the Alternativehypothesis. Bagbag’shouseholdincome perpersonisgrowingatastatisticallysignificant fasterrate thanthe national average growthrate due to GrameenAustraliaPhilippinesloans. 2.3.4 Summary Based on the exploratory data analysis and the inference procedures which were carried out, we may conclude that the centers of Grameen Australia Philippines beneficiaries are all growing at a much faster rate in average household income than the nationalaverage growth rate of the Philippines. Each test resulted in a statistically significant P-Value, including the overall test and the individual center tests. The centers with the most significant growth rate to the least significant growth rate are listed here:
- 19. *This denotes that there were respondents in the data who did not respond and the inference procedure was performed without the respondents accounted for. 1) Taytay: P-Value= 0.00 and 34.7% growth rate 2) *Payatas:P-Value= 0.0007 and a growth rate of 30% 3) Caloocan:P-Value=0.0029 and 31.4% growth rate 4) *Bagbag: P-Value=0.0072 and growth rate of 19.6% 5) Montalban:P-Value=0.0139 and 81.2% growth rate Unfortunately, the data is somewhat tainted because some respondents chose not to disclosecertain information regardingincome. For example, we know based on past inference procedures that Payatas grew the leastin household income, however in this particular procedureitis regarded as the second most growth in household income because of a lack of respondent data. This also shows the influenceone or two data points have on the entire data set. The removal of these respondents’ data points dramatically increased the significance level of the growth of Payatas. 3. Conclusions andDiscussions In the analysis of the change in average and overall household incomes of beneficiaries of Grameen Australia Philippines over the course of 6 months, we may conclude three main points: 1) Each center is growing in average and overall income levels, though not yet at a statistically correlated rate to the loans from Grameen Australia Philippines. However, the correlation may become statistically significant with larger donor funds and larger loan amounts given to beneficiaries. 2) Each center is growing at a different rate. These rates are different between average income augmentation and overall income augmentation amongst the centers. Payatas consistently performed the worst in income augmentation, meeting neither of the expected value requirements. Meanwhile, Bagbag and Taytay consistently performed well in augmentation of both types of income. Almost all expected values were met in terms of average income augmentation, however the overall income augmentation experienced more challenges in meeting the expected values. 3) Each centers’ average income (per member) is growing at a significantly faster rate than the national average growth rate in GNI per capita of the Philippines. This is crucial because it shows the standardized growth of each center to compare their successes. Using this information, Grameen Australia Philippines may A) Seek more and larger funds from donors to loan out to beneficiaries and meet targeted amounts of income augmentations B) Explore outside factors which impact the success of centers and members within centers. For instance: willingness/effort of a member and/or center, education levels,
- 20. *This denotes that there were respondents in the data who did not respond and the inference procedure was performed without the respondents accounted for. location, climate, access to technology, type of social business, marketing techniques, savings habits, etc. The identification of these outside contributing factors will allow Grameen Australia Philippines to aid in overcoming center and/or member weaknesses and highlighting center and/or member strengths. It will also enable Grameen Australia Philippines, as well as the donors, to safely predict the return on their investment will be rewarding both financially and socially. This will ensure a prosperous future full of growth and expansion for Grameen Australia Philippines, its donors, and its beneficiaries. If you have any further questions regarding this analysis, please do not hesitate to contact me. Thank you for choosing to work with me in analyzing the impact of Grameen Australia Philippines.