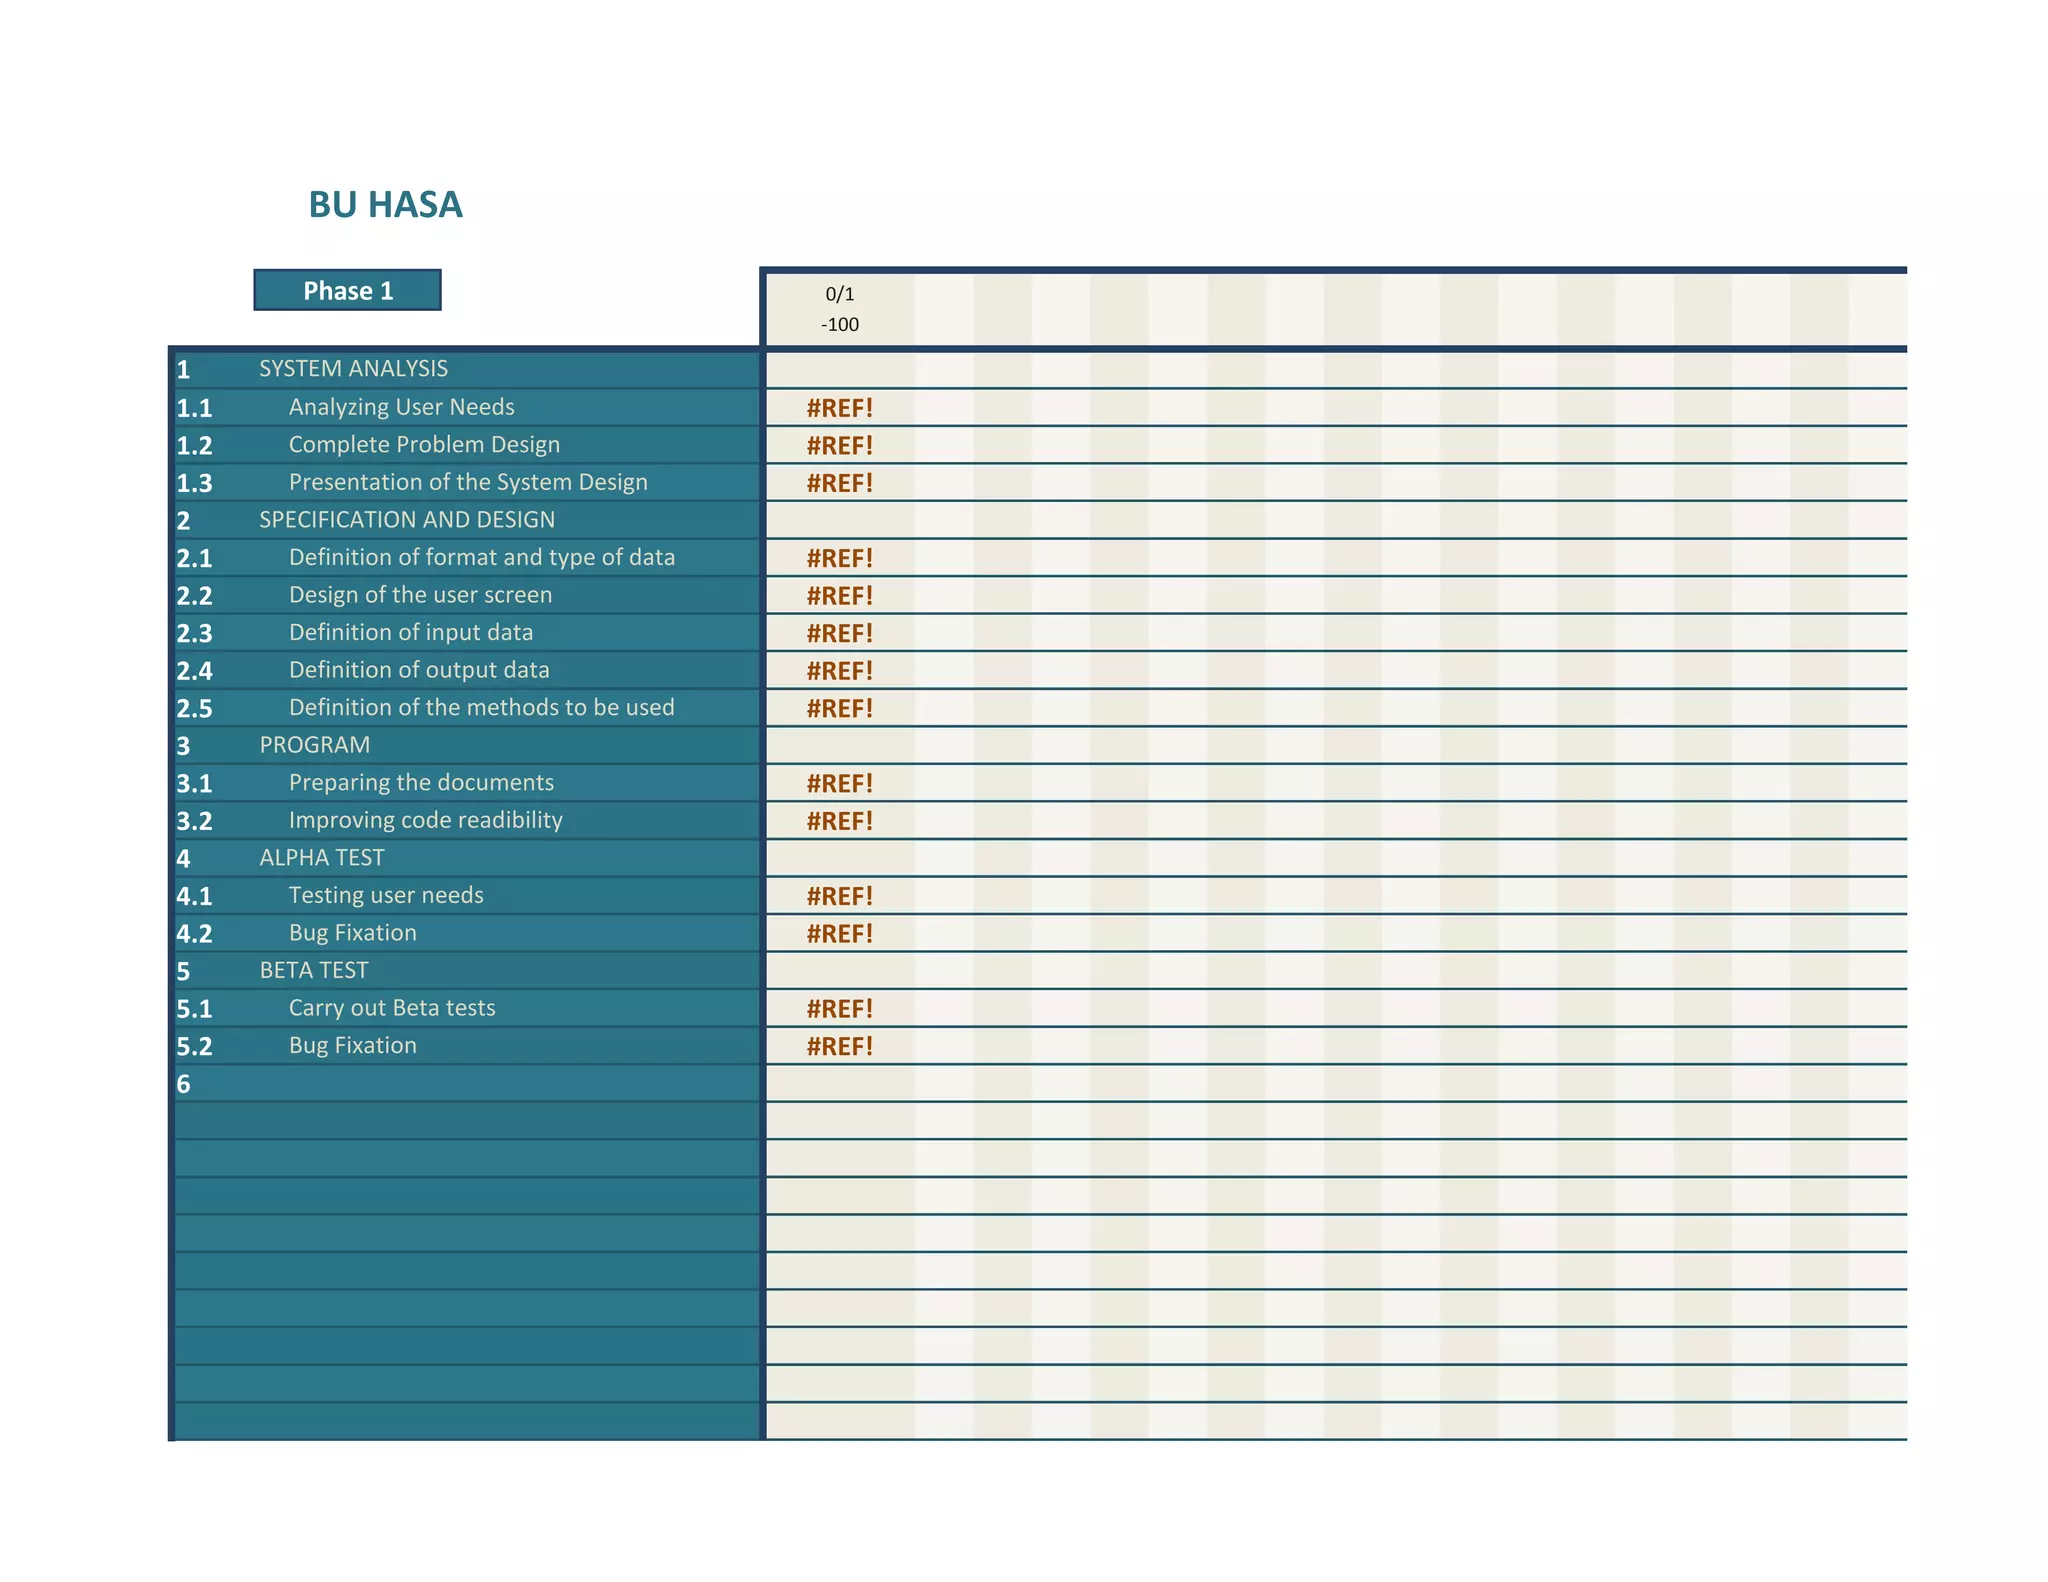
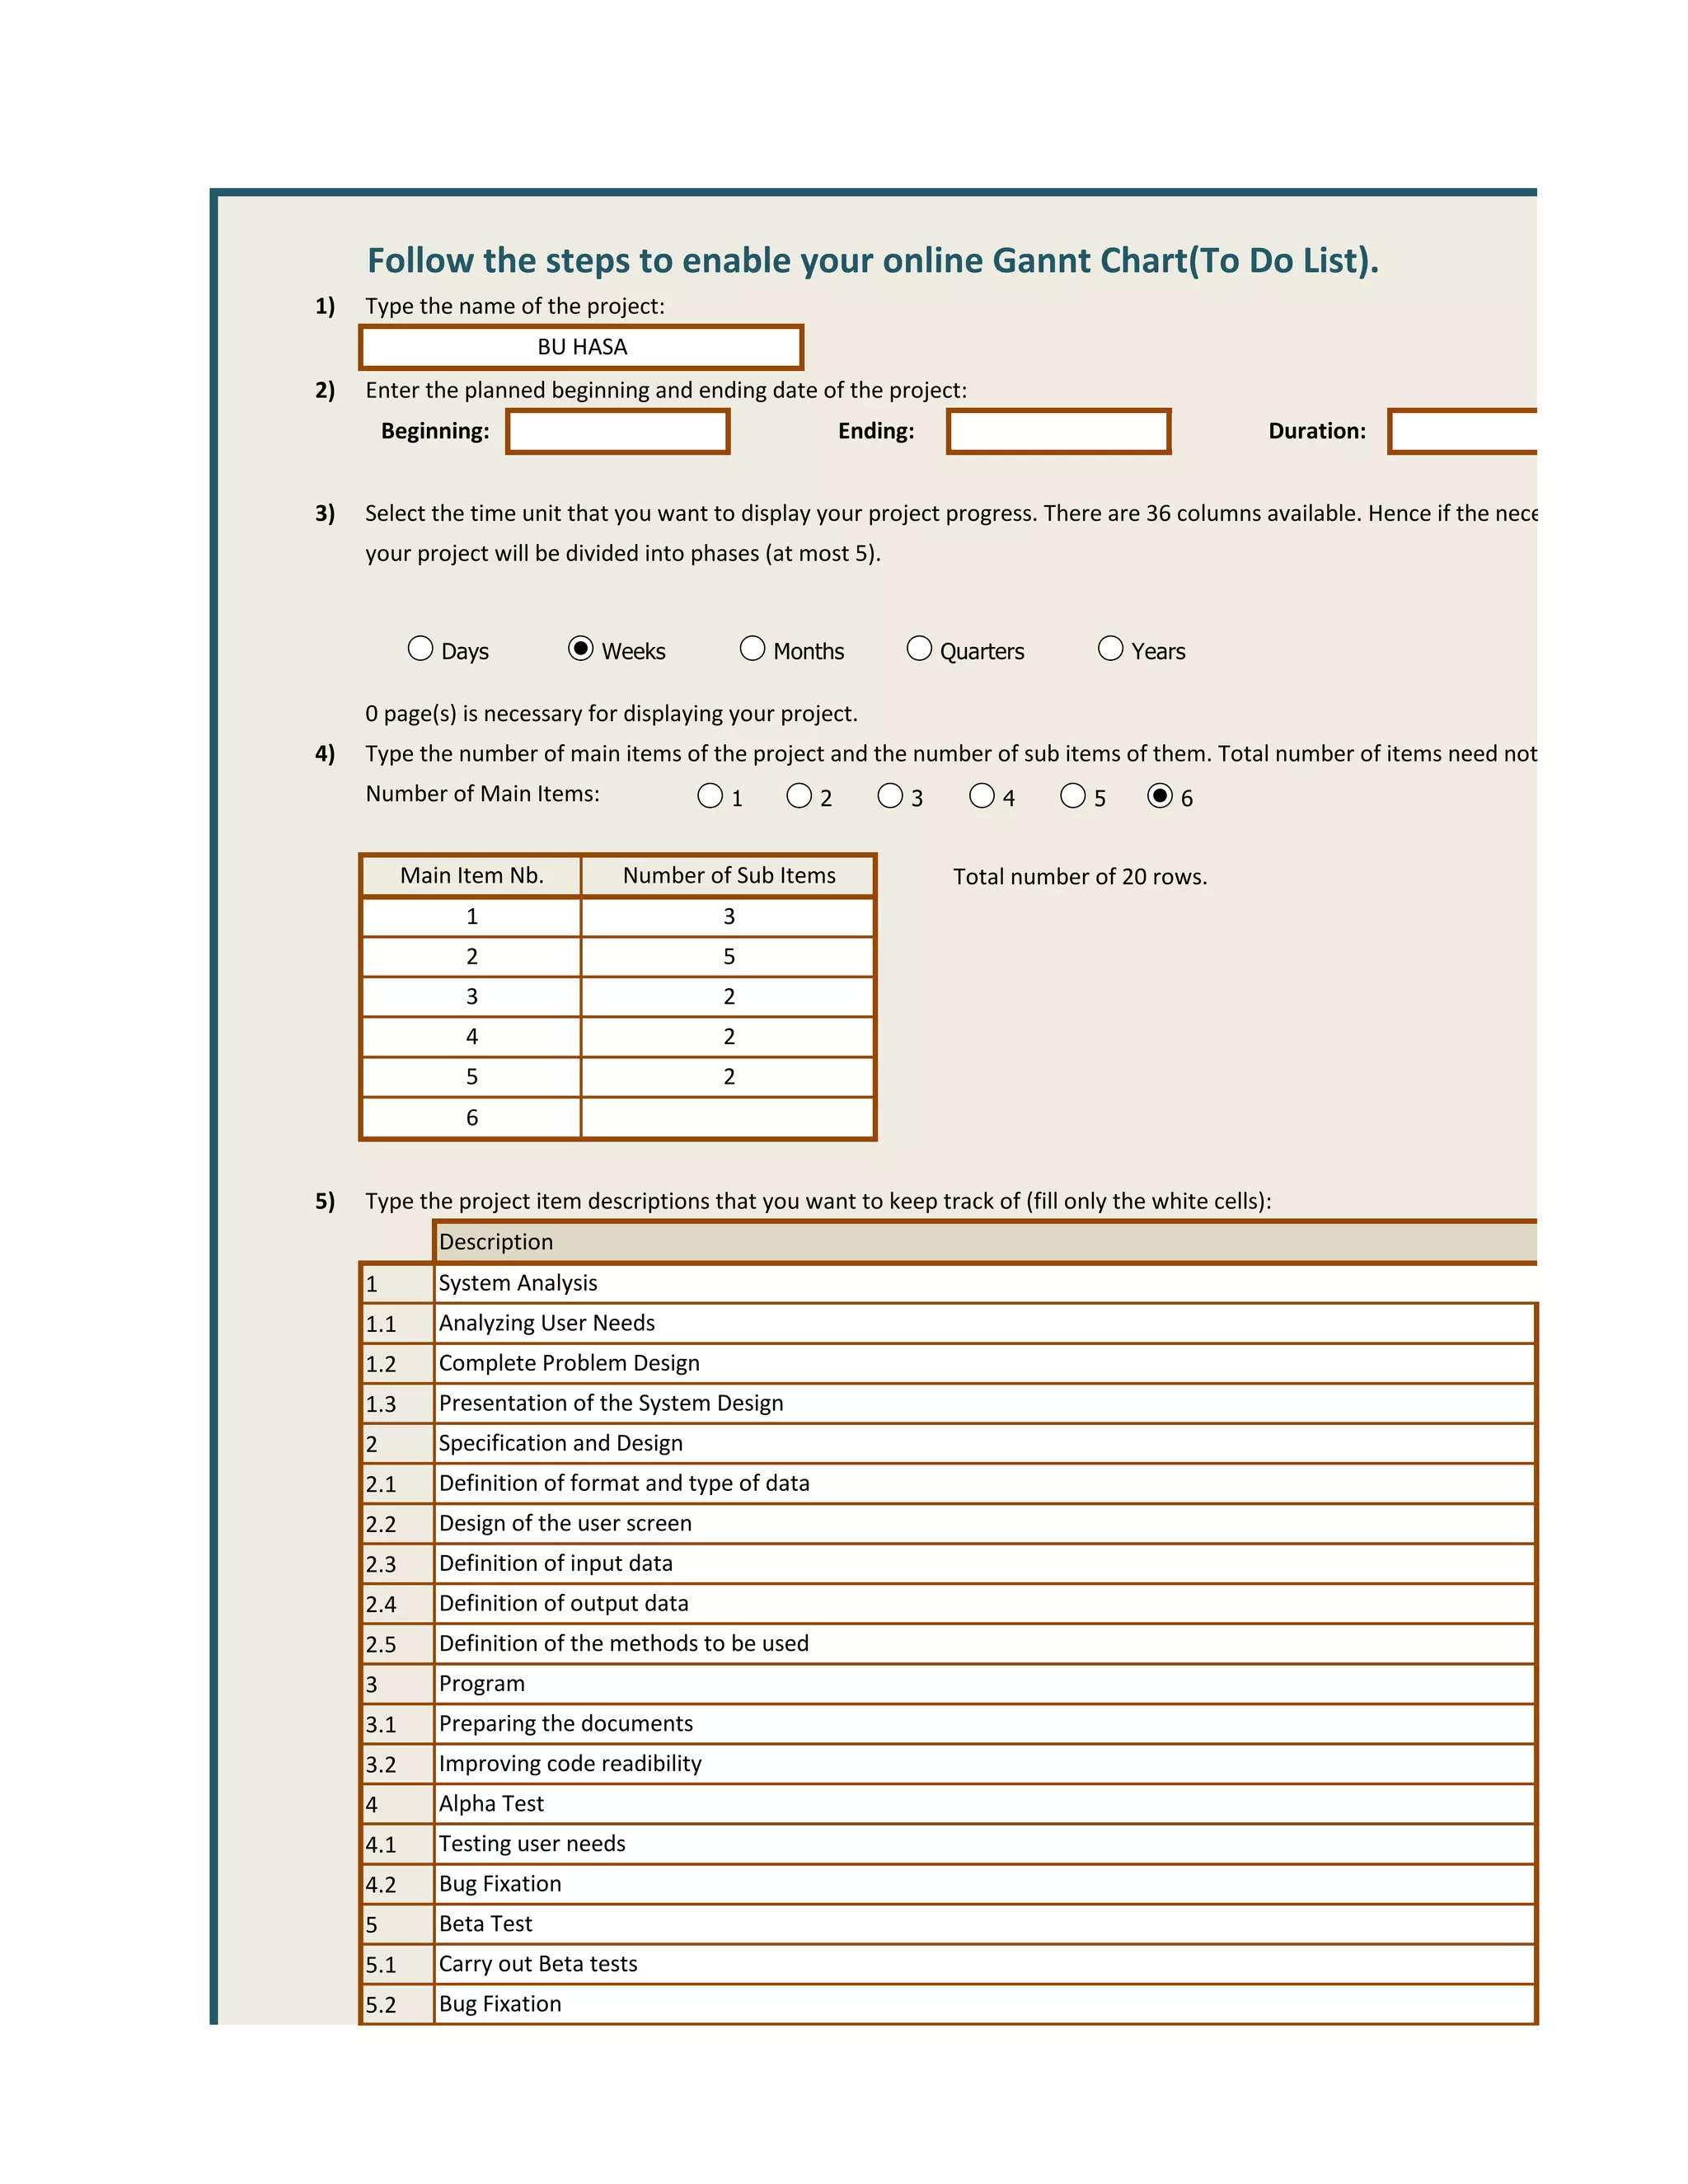
Gantt chart PowerPoint templates designed by skilled, experienced and professional graphic designers that are intended to solve the big issue of time consumption. These are fully editable slides and organized in a way to simplify the most complex topics and present it in an attractive manner. You can easily incorporate charts, diagrams and animations along with the content to these layouts in order to explore new technologies and trends of businesses in a unique way. All editable slides are digitally created to pinpoint and clarify the message, and summarize information regarding topic.
Hear Lutz speaking at Social CRM 2012 in Brussels, 26th September 2012 about The Challenges of Social Data Mapping & Management.
http://www.oursocialtimes.com/socialcrmbrussels
Social Data can give an even better and in-depth view on your customers. However please mind that it is not about 'more data'. It is about the 'right data' put to work.
A) Start wit the question
B) Combine Structured and Unstructured Data
C) Apply continuous machine learning
A mathematical model and a heuristic memory allocation problemDiego Montero
Effective memory management in embedded systems reduce running time and power consumption. Memory allocation is complicated by limited capacity and number of memory banks, as well as potential runtime conflicts. We approached the optimization of memory allocation problem through exact solution using ILP and Tabu Search heauristics method. Inputs from DIMACs instancescite{instances} were tested and the results show significant performance difference between the two approaches
Royal Ten Cate: Faster, cheaper and better than the market thinksGert Steens
23 August 2010
Prepared as an exercise in small-cap equity research marketing;
Readily available public sources only, no management interviews or channel checks;
This is not a solicitation or recommendation to buy or sell securities
Ahmed Deedat
Language: English | Format: PDF | Pages: 67 | Size: 1 MB
” And indeed, you are of a great moral character.” (Quran, 68:4). Shaykh Ahmed Hussein Deedat (July 1, 1918 – August 8, 2005) was a Muslim scholar of comparative religion, an author, lecturer, and an orator. He was best known for witty inter-religious public debates. In 1957, Deedat, together with two of his friends, founded the Islamic Propagation Centre International (IPCI) and remained its president until 1996.
This presentation was made to the Creative Performance Exchange on 3 May 2011, a group of creative thinkers and business leaders. The focus was on how business and organizations can learn from game awesomeness.
issued by Ijser for our book adopting anger management on January editions
we have many books on pipeline on ( business ,management ,self help, self growth ,meditation we looking for publisher to assist us on kindle platform
1. BU HASA
1 2 3 4 5 6 7 8 9 10 11 12 13 14 15 16 17 18
Phase 1 0/1
-100
1 SYSTEM ANALYSIS
1.1 Analyzing User Needs #REF!
1.2 Complete Problem Design #REF!
1.3 Presentation of the System Design #REF!
2 SPECIFICATION AND DESIGN
2.1 Definition of format and type of data #REF!
2.2 Design of the user screen #REF!
2.3 Definition of input data #REF!
2.4 Definition of output data #REF!
2.5 Definition of the methods to be used #REF!
3 PROGRAM
3.1 Preparing the documents #REF!
3.2 Improving code readibility #REF!
4 ALPHA TEST
4.1 Testing user needs #REF!
4.2 Bug Fixation #REF!
5 BETA TEST
5.1 Carry out Beta tests #REF!
5.2 Bug Fixation #REF!
6
5. Follow the steps to enable your online Gannt Chart(To Do List).
1) Type the name of the project:
BU HASA
2) Enter the planned beginning and ending date of the project:
Beginning: Ending: Duration:
3) Select the time unit that you want to display your project progress. There are 36 columns available. Hence if the necessary number o
your project will be divided into phases (at most 5).
Days Weeks Months Quarters Years
0 page(s) is necessary for displaying your project.
4) Type the number of main items of the project and the number of sub items of them. Total number of items need not exceed 30.
Number of Main Items: 1 2 3 4 5 6
Main Item Nb. Number of Sub Items Total number of 20 rows.
1 3
2 5
3 2
4 2
5 2
6
5) Type the project item descriptions that you want to keep track of (fill only the white cells):
Description
1 System Analysis
1.1 Analyzing User Needs
1.2 Complete Problem Design
1.3 Presentation of the System Design
2 Specification and Design
2.1 Definition of format and type of data
2.2 Design of the user screen
2.3 Definition of input data
2.4 Definition of output data
2.5 Definition of the methods to be used
3 Program
3.1 Preparing the documents
3.2 Improving code readibility
4 Alpha Test
4.1 Testing user needs
4.2 Bug Fixation
5 Beta Test
5.1 Carry out Beta tests
5.2 Bug Fixation
6. 6
>> Your Gannt Chart (To Do List) is ready to use, further steps are for online use.
6) Visit the site below:
http://www.spreadsheetweb.com/getting_started.htm
You will only need the username and password to create your online Gannt Chart (To Do List).
7) Visit the site below:
https://www4.spreadsheetweb.com/SpreadsheetWEB//
Login to page with your new account information.
8) Click "Add Web Application" to upload this file. Your online Gannt Chart (To Do List) will be created automatically.
You can simply use the Gannt Chart (To Do List) from that link or place it on your website.
>> Your online Gannt Chart (To Do List) will look like:
http://www1.spreadsheetweb.com/SpreadSheetWEB/Output.aspx?ApplicationId=539ed3b9-a1fe-4ac7-bfd0-bdda9a7eaa20
>> In order to see more online applications created with PSW you can check the link below:
http://www.spreadsheetweb.com/demos.htm
Copyright (c) 2009 Pagos, Inc., http://www.pagos.com/
7. nce if the necessary number of columns exceeds 36 columns,
tems need not exceed 30.
Beginning Date Ending Date
4/4/2009 4/14/2009 Excludes project timeline.
4/12/2009 4/17/2009 Excludes project timeline.
4/18/2009 4/20/2009 Excludes project timeline.
4/22/2009 5/10/2009 Excludes project timeline.
4/27/2009 5/9/2009 Excludes project timeline.
5/1/2009 5/4/2009 Excludes project timeline.
5/5/2009 5/15/2009 Excludes project timeline.
5/10/2009 5/17/2009 Excludes project timeline.
5/16/2009 6/1/2009 Excludes project timeline.
5/27/2009 6/3/2009 Excludes project timeline.
6/6/2009 6/10/2009 Excludes project timeline.
6/9/2009 6/21/2009 Excludes project timeline.
6/23/2009 6/29/2009 Excludes project timeline.
6/25/2009 7/7/2009 Excludes project timeline.