Class-1 9
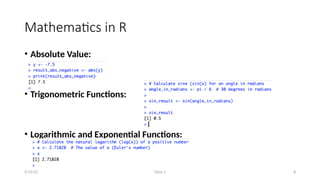
Mathematics inR
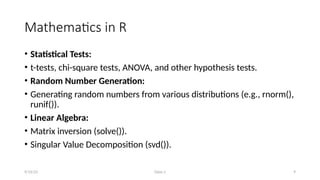
• Statistical Tests:
• t-tests, chi-square tests, ANOVA, and other hypothesis tests.
• Random Number Generation:
• Generating random numbers from various distributions (e.g., rnorm(),
runif()).
• Linear Algebra:
• Matrix inversion (solve()).
• Singular Value Decomposition (svd()).
9/15/23
10.
Class-1 10
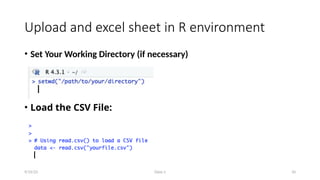
Upload andexcel sheet in R environment
• Set Your Working Directory (if necessary)
• Load the CSV File:
9/15/23
11.
Class-1 11
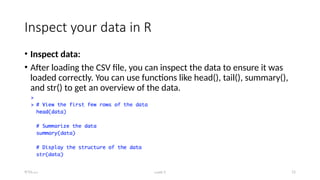
Inspect yourdata in R
• Inspect data:
• After loading the CSV file, you can inspect the data to ensure it was
loaded correctly. You can use functions like head(), tail(), summary(),
and str() to get an overview of the data.
9/15/23
12.
Class-1 12
Inspect yourdata in R
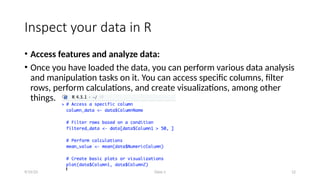
• Access features and analyze data:
• Once you have loaded the data, you can perform various data analysis
and manipulation tasks on it. You can access specific columns, filter
rows, perform calculations, and create visualizations, among other
things.
9/15/23
13.
Class-1 13
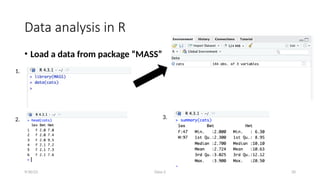
Descriptive Statisticsin R
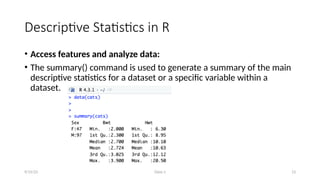
• Access features and analyze data:
• The summary() command is used to generate a summary of the main
descriptive statistics for a dataset or a specific variable within a
dataset.
9/15/23
14.
Class-1 14
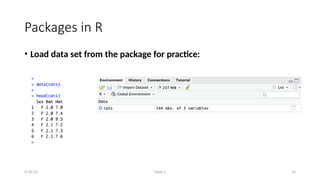
Packages inR
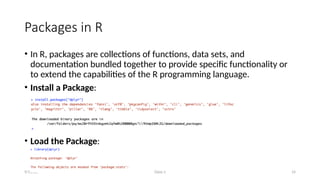
• In R, packages are collections of functions, data sets, and
documentation bundled together to provide specific functionality or
to extend the capabilities of the R programming language.
• Install a Package:
• Load the Package:
9/15/23
Class-2 19
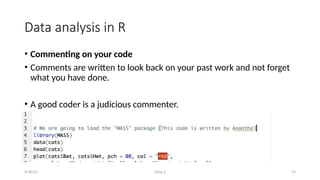
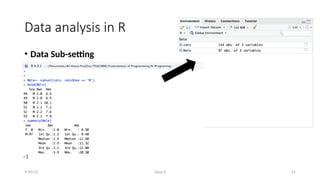
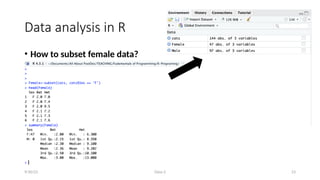
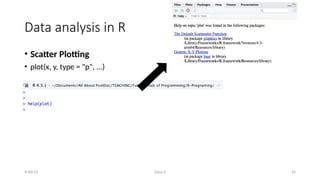
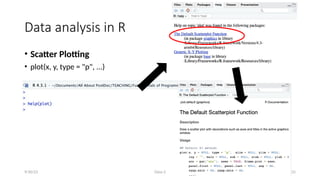
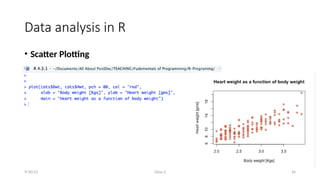
Data analysisin R
• Commenting on your code
• Comments are written to look back on your past work and not forget
what you have done.
• A good coder is a judicious commenter.
9/30/23
Class-2 27
Data analysisin R
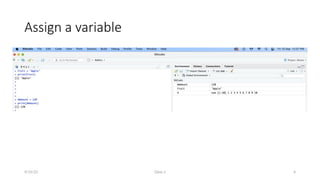
• What is the difference between ‘=‘ and ‘= = ‘?
• = (Assignment Operator):
• The = symbol is used for assignment in R. It is used to assign a value to a variable.
• When you use = to assign a value to a variable, you are saying that the variable on
the left will take on the value on the right.
• == (Equality Operator):
• The == symbol is used for comparison in R. It is used to check whether two values
or expressions are equal.
• When you use ==, you are asking if the expression on the left is equal to the
expression on the right.
9/30/23
28.
Class-2 28
Data analysisin R
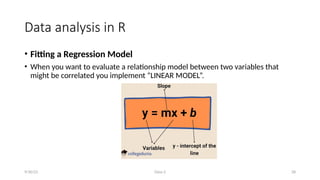
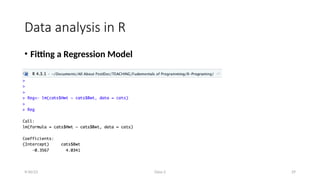
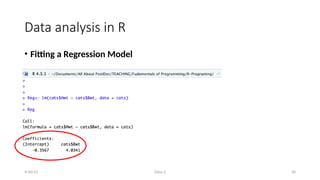
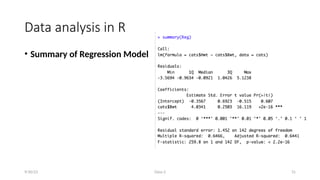
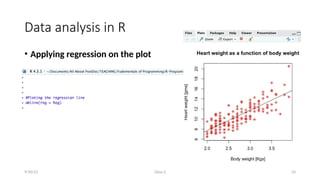
• Fitting a Regression Model
• When you want to evaluate a relationship model between two variables that
might be correlated you implement “LINEAR MODEL”.
9/30/23
Class-2 32
Data analysisin R
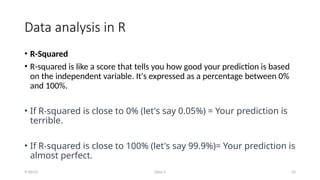
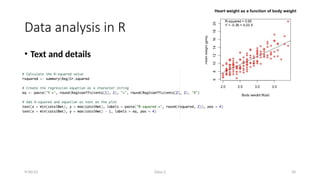
• R-Squared
• R-squared is like a score that tells you how good your prediction is based
on the independent variable. It's expressed as a percentage between 0%
and 100%.
• If R-squared is close to 0% (let's say 0.05%) = Your prediction is
terrible.
• If R-squared is close to 100% (let's say 99.9%)= Your prediction is
almost perfect.
9/30/23


![Basics of R programming for analytics [Autosaved] (1).pdf](https://cdn.slidesharecdn.com/ss_thumbnails/basicsofrprogrammingforanalyticsautosaved1-240916080545-0682f8c8-thumbnail.jpg?width=640&height=640&fit=bounds)