The document summarizes findings from surveys of Fulton County residents and service providers on issues facing seniors. Key findings include:
- 35% of residents over 55 reported experiencing age discrimination. Access to transportation, health care, and daily living assistance were top concerns.
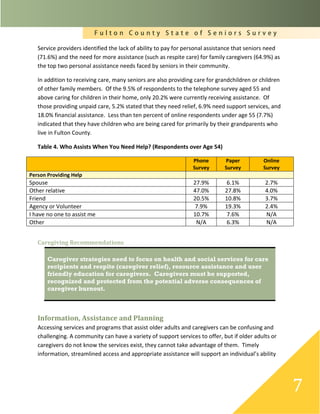
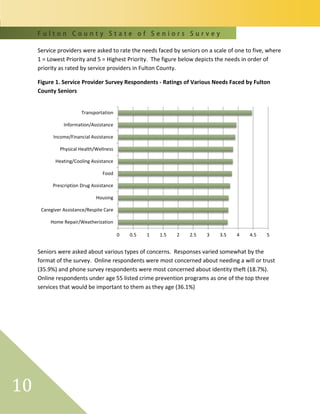
- Service providers identified lack of funds for personal assistance and need for caregiver respite as top needs. Over half observed the "sandwich generation" caring for children and parents.
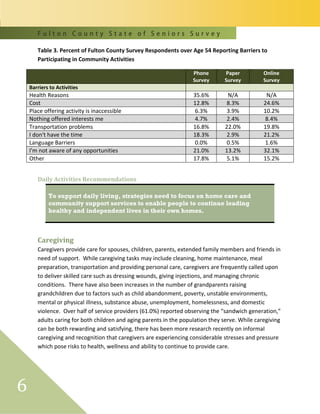
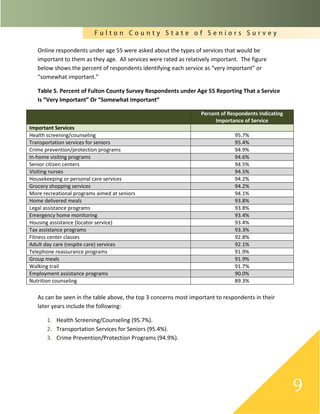
- Most common activities for residents over 54 were physical exercise, religion, and recreation. Health issues were the primary barrier to community participation.
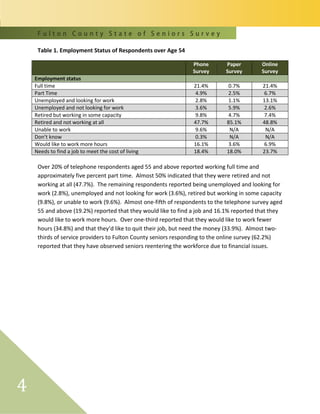
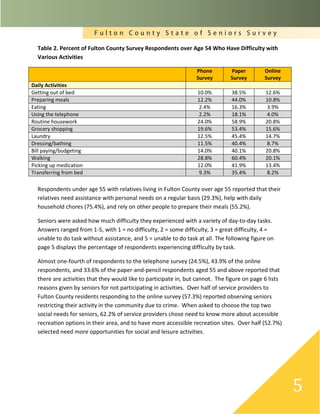
- Over 20% of residents over 54 worked full or part-time due to financial needs, with daily tasks