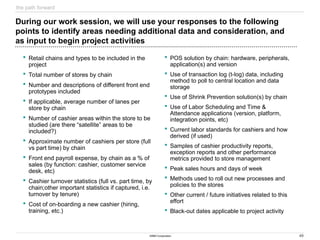
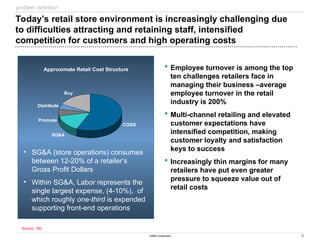
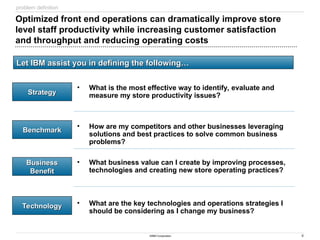
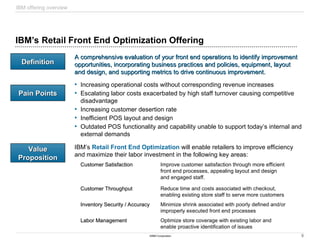
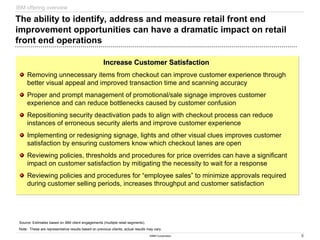
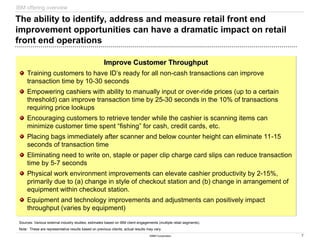
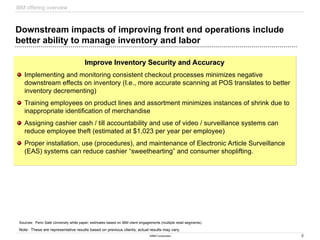
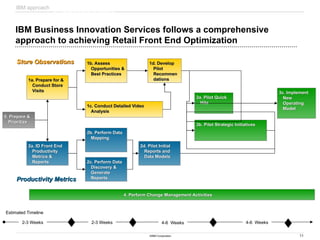
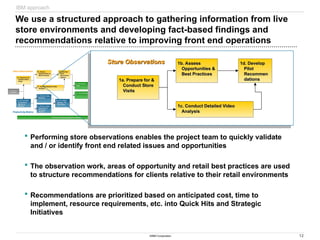
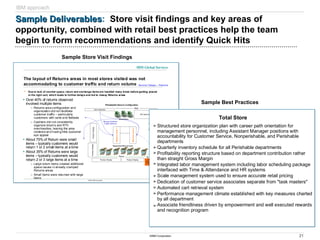
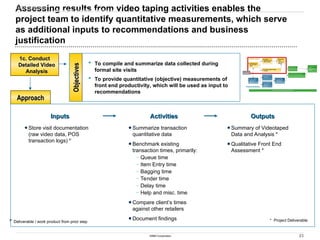
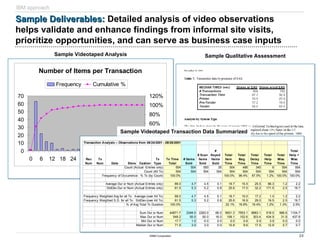
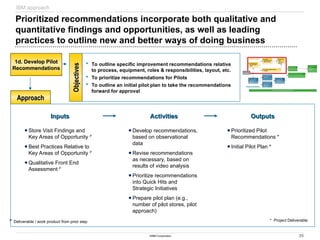
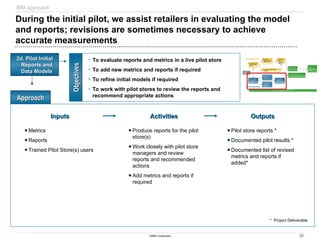
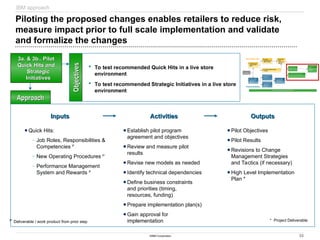
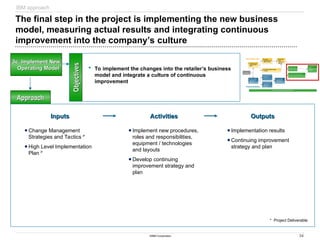
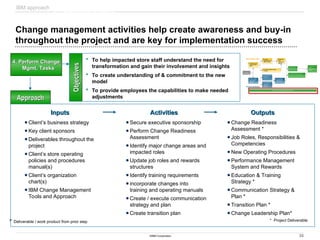
The document discusses IBM's retail front end optimization offering, aimed at addressing challenges retailers face such as high employee turnover, competition, and operational costs. It highlights the importance of efficient front end operations to improve staff productivity, customer satisfaction, and overall cost management. The strategy involves assessing store performance, implementing best practices, and utilizing data-driven insights to enhance front end processes and store layouts.


![22
©IBM Corporation
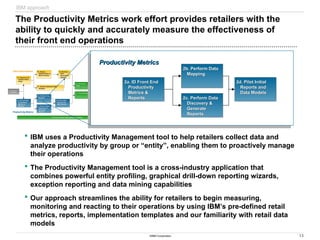
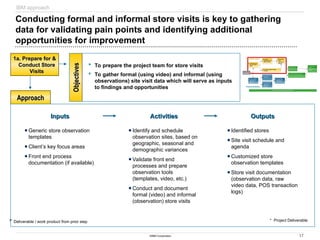
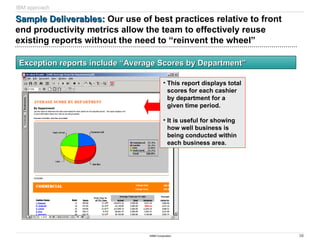
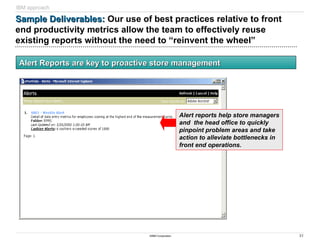
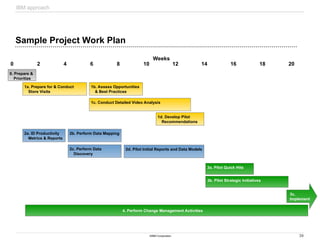
Sample Deliverables
Sample Deliverables: Store visit findings and key areas of
opportunity, combined with retail best practices help the team
begin to form recommendations and identify Quick Hits
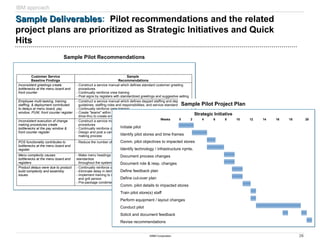
Sample Quick Hits
QUICK HITS
# Name Short Description Enablers
Expected Capabilities /
Benefits
Approx. Cost
Timeframe to
Implement
Impacted
Personnel
Impacted Areas Owner
1 Manage Sales
Signage
a. Remove signs promptly after a sale ends.
b. Sale signage should prominently display the ending
date for the sale.
c. Use a single color for all sale signage for a given
time period. The sale signs for the next period should
be a different color. Rotate through several (i.e., 6-8)
colors over time. The “color” of the weekly sale could
be touted in advertising materials. E.g., weekly sales
flyers could state the sales “color” signage to look for.
Communication of sale
start / end dates to store
staff
Discepancies will be
dealt with on the sales
floor rather than at
checkout.
Higher customer
satisfaction due to less
confusion and neater
store appearance
Minimal 1 month Cashiers, Floor
Associates
Entire Store S. Walton
2 Sales Floor Staff
Coverage
Maintain adequate sales floor staff to be available and
easily found or called by shoppers if they
want to ask a question before checkout.
Defined roles &
responsibilities
Staff deployment
[Labor scheduling
application]
Higher customer
satisfaction
Improved throughput due
to minimized delays
caused by customer
questions
Possible
additional labor
2 months Cashiers, Floor
Associates
Entire Store M. Field
3 Price Check
Review
Review all price checks for some period (e.g., a month)
to determine cause and typical amount under dispute.
For small disputed amounts, take the shopper’s word.
Over time, monitor the results of the dispute
resolutions to insure (a) that the practice is
implemented as desired and (b) that shoppers do not
take advantage of the store’s good faith.
Transaction Log data Improved customer
satisfaction due to
reduced delays caused
by price checks
Improved throughput
Additional
labor and/or
consultants (if
use external
resources)
1 month Cashiers Checkout B. Marcus
IBM approach](https://image.slidesharecdn.com/frontendoptimization-simplified-240915205924-eda6abe5/85/Front-end-optimization-simplified-ppt-22-320.jpg)
![36
©IBM Corporation
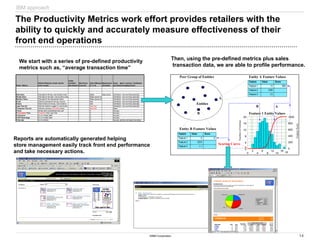
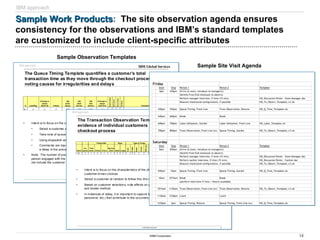
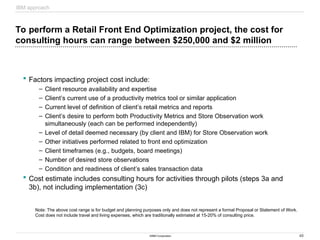
Sample Deliverables
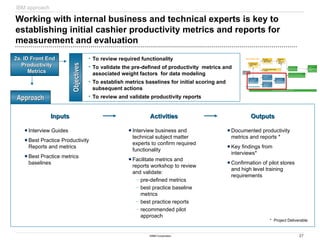
Sample Deliverables: Since change management activities focus
on preparing and assisting the company throughout the change,
deliverables are traditionally assessment, strategy and planning
Sample Communications Plan
[TBD]
Go Live Date 9/1/2000
Communications Task Owner Vehicle Audience Message Ideal Timing Start Date
End/Pub
Date
5/5
HR trng. schedules/rosters DACG Email HR Directors Provide HR trng. schedules/rosters 6 weeks prior to go live 5/5/2000 7/21/2000
BPO mtg Ron Clark Meeting Randy Smith & Nita
Sanders
Bi-weekly project status Every 2 weeks or as
needed
5/5/2000 multiple XXXXX
XXXXX
XXXX
Trng. DACG Classroom HR team members End-users Pilot Project system task One month prior to go
live
5/5/2000 8/4/2000
Demo. Ops Manual Peggy Lane Meeting Randy Smith, Doug
Anderson
Review Ops Manual layout and
content
One month prior to go
live
5/5/2000 8/4/2000
Cutover procedures Change
Management
Email HR team members Communicate that nothing will
change during cutover. The process
will remain the same.
3 weeks prior to go live 5/5/2000 8/11/2000
Brown Bag meeting(s) Change
Management
Meeting HR team members Provide users with a basic
understanding of why Pilot Project,
what Pilot Project means to them, as
well as an opportunity to ask
questions
2 - 3 weeks prior to go
live
5/5/2000 8/11/2000
Overview conference call Ralph
Santosuosso
Conference Call Field HR team
members
Provide users with a basic
understanding of why Pilot Project,
what Pilot Project means to them, as
well as an opportunity to ask
questions
2 - 3 weeks prior to go
live
5/5/2000 8/11/2000
Sample Excerpt from Change Readiness Assessment
IBM approach
Q-Mart /IBM Confidential
13
Because of some functional overlap withParentCo and
resource limitations, the current organizational design could
impact availability of resources for a transformation project
Issues
1. Q-Mart is has organizational overlap withParentCo P
(i.e. shared resources and reporting structure)
2. Q-Mart lacks resource depth across most functional
units which may impact project staffing
3. Some employees will have to perform double duty
during the Front End Optimization project
4. Other projects in progress may stretch or limit project
resources in 2000
5. Key business leaders in Store Operations are not in
place
6. Current roles and responsibilities are not documented
and training is not consistentlyexecutied
7. Future outsourcing considerations of certain functional
responsibilities will alter the design of the organization
Issue Resolution Recommendations
• Coordinate a company-wide kick-off meeting to explain
the reasons for change into Q-Mart
• Where possible, dedicate Q-Mart resources to the project
• Shift responsibilities or bring in temporary help where
necessary to supplement Q-Mart resource commitments
to the project
• Execute the system project with no outsourcing
decisions in mind (i.e. view Q-Mart as a stand-alone)
• Within the Organizational Change Management
component allow for new/changed positions to be
developed without ParentCo or current Q-Mart
requirements
Benefits
• Demonstrates Q-Mart management commitment to
business transformation
• Avoids message confusion on project purpose
• Develops permanent core team of Front End
Optimization system users
• Prepares the organization for significant change
• Assures the organization is in line to successfully
operate in the new environment
Benefits
• Demonstrates Q-Mart management commitment to
business transformation
• Avoids message confusion on project purpose
• Develops permanent core team of Front End
Optimization system users
• Prepares the organization for significant change
• Assures the organization is in line to successfully
operate in the new environment](https://image.slidesharecdn.com/frontendoptimization-simplified-240915205924-eda6abe5/85/Front-end-optimization-simplified-ppt-36-320.jpg)
![47
©IBM Corporation
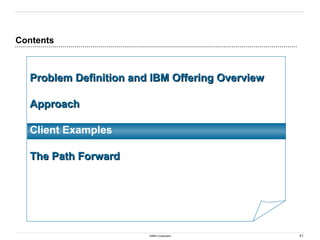
the path forward
The work session will include:
• Review of IBM’s project approach
• Review of required inputs and key outputs
• Review of existing documentation of your processes,
reports and metrics
• Documentation and validation as we conduct the session
Preparation will ensure value for all participants, thus we ask that you provide
responses to specific questions (next page) prior to the work session.
For Example:
For Example:
How do you currently measure front end productivity?
How do you currently measure front end productivity?
Do you use labor standards and/or a scheduling application for cashiers?
Do you use labor standards and/or a scheduling application for cashiers?
Do you use a standard method to roll new processes and policies to the stores?
Do you use a standard method to roll new processes and policies to the stores?
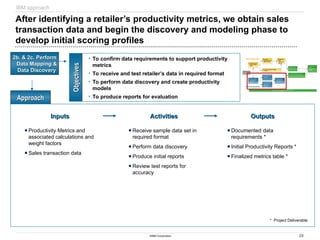
To begin [CLIENT]’s Front End Optimization project, we recommend
conducting a collaborative work session to establish project
parameters, gather data and construct a high level project plan
Front end performance
Productivity
Customer Satisfaction](https://image.slidesharecdn.com/frontendoptimization-simplified-240915205924-eda6abe5/85/Front-end-optimization-simplified-ppt-47-320.jpg)
![48
©IBM Corporation
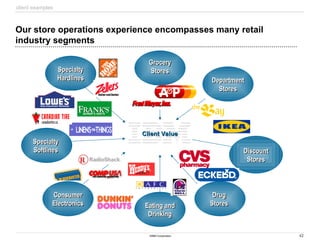
It is important to include resources closest to and most knowledgeable
about [CLIENT’S] retail operations to achieve work session objectives
Retail Operations, VP and Director Level
Retail Field Management
Retail Store Management (all levels)
Retail Store Training Staff – Front End
Customer Service
Store Level IT Support Staff
the path forward](https://image.slidesharecdn.com/frontendoptimization-simplified-240915205924-eda6abe5/85/Front-end-optimization-simplified-ppt-48-320.jpg)