Download to read offline
![37. Stephan F, Flahault A, Dieudonne N, et al: Clinical evaluation of
circulating blood volume in critically ill patients–contribution of a
clinical scoring system. Br J Anaesth 86:754-762, 2001
38. Monnet X, Julien F, Ait-Hamou N, et al: Lactate and venoarterial
carbon dioxide difference/arterial-venous oxygen difference ratio, but
not central venous oxygen saturation, predict increase in oxygen
consumption in fluid responders. Crit Care Med 41:1412-1420, 2013
39. Bundgaard-Nielsen M, Secher NH, Kehlet H: “Liberal” vs.
“restrictive” perioperative fluid therapy—a critical assessment of the
evidence. Acta Anaesthesiol Scand 53:843-851, 2009
40. Saugel B, Ringmaier S, Holzaphel K, et al: Physical examination,
central venous pressure, and chest radiography for the prediction of
transpulmonary thermodilution-derived hemodynamic parameters in
critically ill patients: a prospective trial. J Crit Care 26:402-410, 2011
41. Kramer A, Zygun D, Hawes H, et al: Pulse pressure variation
predicts fluid responsiveness following coronary artery bypass surgery.
Chest 126:1563-1568, 2004
42. Antonelli M, Levy M, Andrews PJ, et al: Hemodynamic
monitoring in shock and implications for management. International
Consensus Conference, Paris, France, 27-28 April 2006. Intensive Care
Med 33:575-590, 2007
43. Berkenstadt H, Margalit N, Hadani M, et al: Stroke volume
variation as a predictor of fluid responsiveness in patients undergoing
brain surgery. Anesth Analg 92:984-989, 2001
44. Boldt J, Lenz M, Kumle B, et al: Volume replacement strategies
on intensive care units: results from a postal survey. Intensive Care
Med 24:147-151, 1998
45. Kastrup M, Markewitz A, Spies C, et al: Current practice of
hemodynamic monitoring and vasopressor and inotropic therapy in
post-operative cardiac surgery patients in Germany: results from a
postal survey. Acta Anaesthesiol Scand 51:347-358, 2007
46. Geerts BF, Maas JJ, de Wilde RBP, et al: Hemodynamic
assessment in the Dutch intensive care unit. Neth Journal of Critical
Care 13:178-184, 2009
47. Marik PE, Baram M, Vahid B: Does central venous pressure
predict fluid responsiveness? A systematic review of the literature and
the tale of seven mares. Chest 134:172-178, 2008
48. Magder S: Fluid status and fluid responsiveness. Curr Opin Crit
Care 16:289-296, 2010
49. Lattik R, Couture P, Denault AY, et al: Mitral Doppler indices
are superior to two-dimensional echocardiographic and hemodynamic
variables in predicting responsiveness of cardiac output to a rapid
intravenous infusion of colloid. Anesth Analg 94:1092-1099, 2002
50. Wyffels PA, Durnez PJ, Helderweirt J, et al: Ventilation-induced
plethysmographic variations predict fluid responsiveness in ventilated
postoperative cardiac surgery patients. Anesth Analg 105:448-452,
2007
51. Zimmermann M, Feibicke T, Keyl C, et al: Accuracy of stroke
volume variation compared with pleth variability index to predict fluid
responsiveness in mechanically ventilated patients undergoing major
surgery. Eur J Anaesthesiol 27:555-561, 2010
52. Reuter DA, Kirchner A, Felbinger TW, et al: Usefulness of left
ventricular stroke volume variation to assess fluid responsiveness in
patients with reduced cardiac function. Crit Care Med 31:1399-1404,
2003
53. Solus-Biguenet H, Fleyfel M, Tavernier B, et al: Non-invasive
prediction of fluid responsiveness during major hepatic surgery.
Br J Anaesth 97:808-816, 2006
54. Barbier C, Loubieres Y, Schmit C, et al: Respiratory changes in
inferior vena cava diameter are helpful in predicting fluid responsiveness
in ventilated septic patients. Intensive Care Med 30:1740-1746, 2004
55. Lakhal K, Ehrmann S, Benzekri-Lefèvre D, et al: Respiratory
pulse pressure variation fails to predict fluid responsiveness in acute
respiratory distress syndrome. Crit Care 15:R85, 2011
56. Muller L, Louart G, Teboul JL, et al: Could B-type Natriuretic
Peptide (BNP) plasma concentration be useful to predict fluid
responsiveness [corrected] in critically ill patients with acute circulatory
failure? Ann Fr Anesth Reanim 28:531-536, 2009
57. Moretti R, Pizzi B: Inferior vena cava distensibility as a predictor
of fluid responsiveness in patients with subarachnoid hemorrhage.
Neurocrit Care 13:3-9, 2010
58. Osman D, Ridel C, Ray P, et al: Cardiac filling pressures are not
appropriate to predict hemodynamic response to volume challenge. Crit
Care Med 35:64-68, 2007
59. Price S, Nicol E, Gibson DG, et al: Echocardiography in the
critically ill: current and potential roles. Intensive Care Med 32:
48-59, 2006
60. Guarracino F, Baldassarri R: Transesophageal echocardiography
in the OR and ICU. Minerva Anestesiol 75:518-529, 2009
61. The American Society of Anesthesiologists and the Society of
Cardiovascular Anesthesiologists Task Force on Transesophageal
Echocardiography: Practice guidelines for perioperative transesopha-
geal echocardiography. An updated report. Anesthesiology 112:
1084-1096, 2010
62. Cholley BP, Vieillard-Baron A, Mebazaa A: Echocardiography
in the ICU: time for widespread use! Intensive Care Med 32:9-10,
2006
63. Charron C, Fessenmeyer C, Cosson C, et al: The influence of
tidal volume on the dynamic variables of fluid responsiveness in
critically ill patients. Anesth Analg 102:1511-1517, 2006
64. Cannesson M, Slieker J, Desebbe O, et al: Prediction of fluid
responsiveness using respiratory variations in left ventricular stroke
area by transoesophageal echocardiographic automated border detec-
tion in mechanically ventilated patients. Crit Care 10:R171, 2006
65. Lee JH, Kim JT, Yoon SZ, et al: Evaluation of corrected flow
time in oesophageal Doppler as a predictor of fluid responsiveness.
Br J Anaesth 99:343-348, 2007
66. De Waal EE, Rex S, Kruitwagen CL, et al: Dynamic preload
indicators fail to predict fluid responsiveness in open-chest conditions.
Crit Care Med 37:510-515, 2009
67. Cannesson M, Attof Y, Rosamel P, et al: Respiratory variations
in pulse oximetry plethysmographic waveform amplitude to predict
fluid responsiveness in the operating room. Anesthesiology 106: 1105-
1011, 2007
68. Derichard A, Robin E, Tavernier B, et al: Automated pulse
pressure and stroke volume variations from radial artery: evaluation
during major abdominal surgery. Br J Anaesth 103:678-684, 2009
69. Biais M, Bernard O, Ha JC, et al: Abilities of pulse pressure
variations and stroke volume variations to predict fluid responsiveness
in prone position during scoliosis surgery. Br J Anaesth 104:
407-413, 2010
70. Suehiro K, Okutani R: Stroke volume variation as a predictor of
fluid responsiveness in patients undergoing one-lung ventilation.
J Cardiothorac Vasc Anesth 24:772-775, 2010
71. Lei H, Zhang WX, Cai WX, et al: The role of stroke volume
variation in predicting the volume responsiveness of patients
with severe sepsis and septic shock. Chin J Emerg Med 19:
916-920, 2010
72. Yazigi A, Khoury E, Hlais S, et al: Pulse pressure variation
predicts fluid responsiveness in elderly patients after coronary artery
bypass graft surgery. J Cardiothorac Vasc Anesth 26:387-390, 2012
73. Monge Garcia MI, Gil Cano A, Diaz Monrove JC: Arterial
pressure changes during the Valsalva maneuver to predict fluid
responsiveness in spontaneously breathing patients. Intensive Care
Med 35:77-84, 2009
74. Feissel M, Badie J, Merlani PG, et al: Pre-ejection period
variations predict the fluid responsiveness of septic ventilated patients.
Crit Care Med 33:2534-2539, 2005
CHERPANATH ET AL752](https://image.slidesharecdn.com/fluidosrespuesta2014pdf-170223195037/85/Fluidos-respuesta-2014-pdf-8-320.jpg)


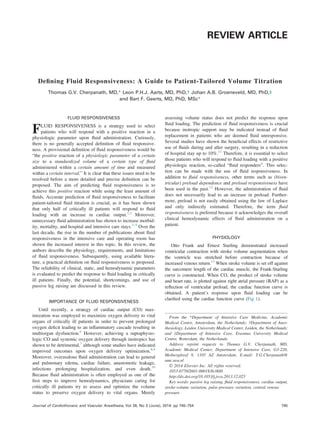
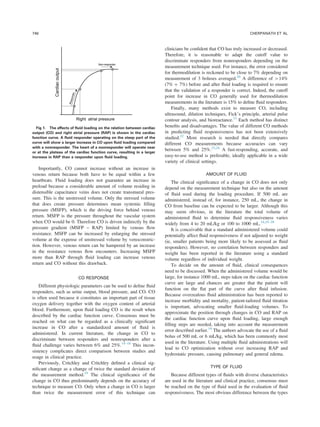
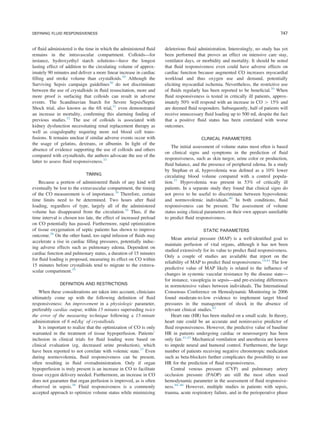
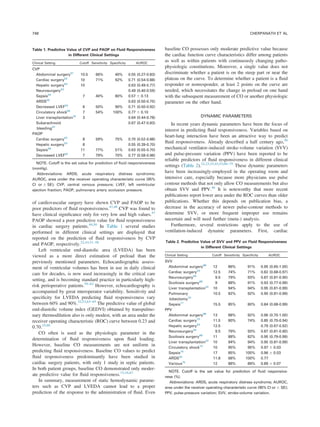
This document discusses fluid responsiveness, which is the ability to predict whether a patient will respond positively to fluid administration based on changes in physiologic parameters. There is currently no agreed upon definition of fluid responsiveness. The document proposes a provisional definition and discusses important considerations for defining fluid responsiveness, including: the physiologic parameter used to measure response, amount of fluid administered, type of fluid, timing of measurements, and limitations. Specifically, the document suggests fluid responsiveness be defined as an improvement in cardiac output exceeding 15% within 15 minutes of administering 6 mL/kg of crystalloids over 15 minutes.


