Downloaded 120 times
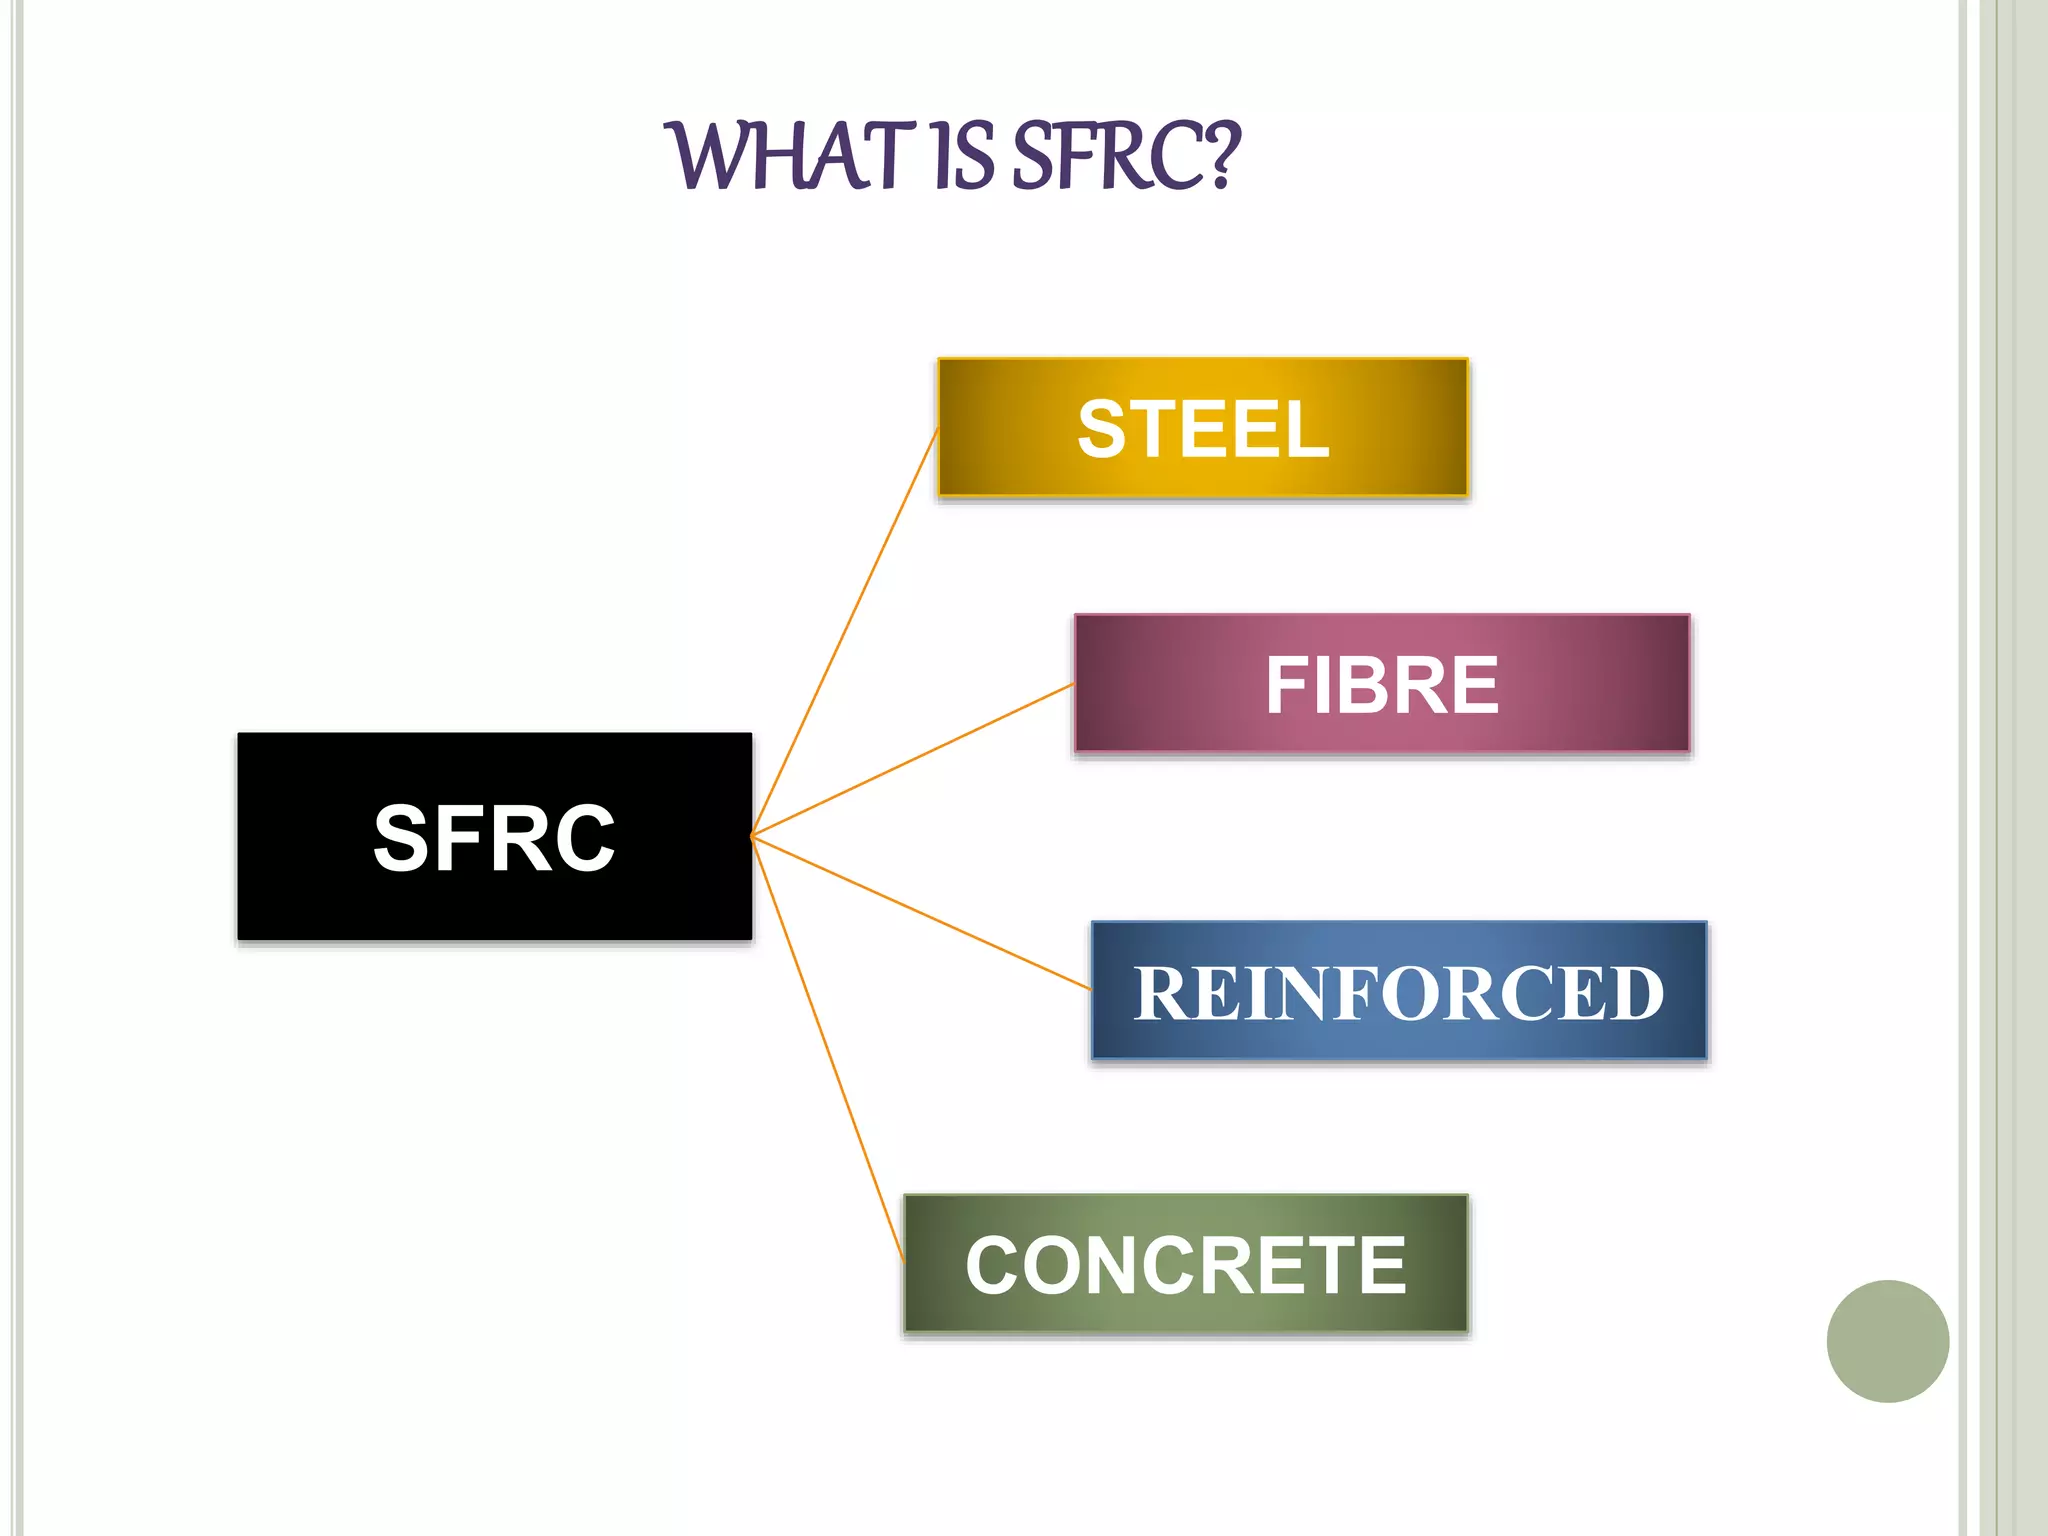
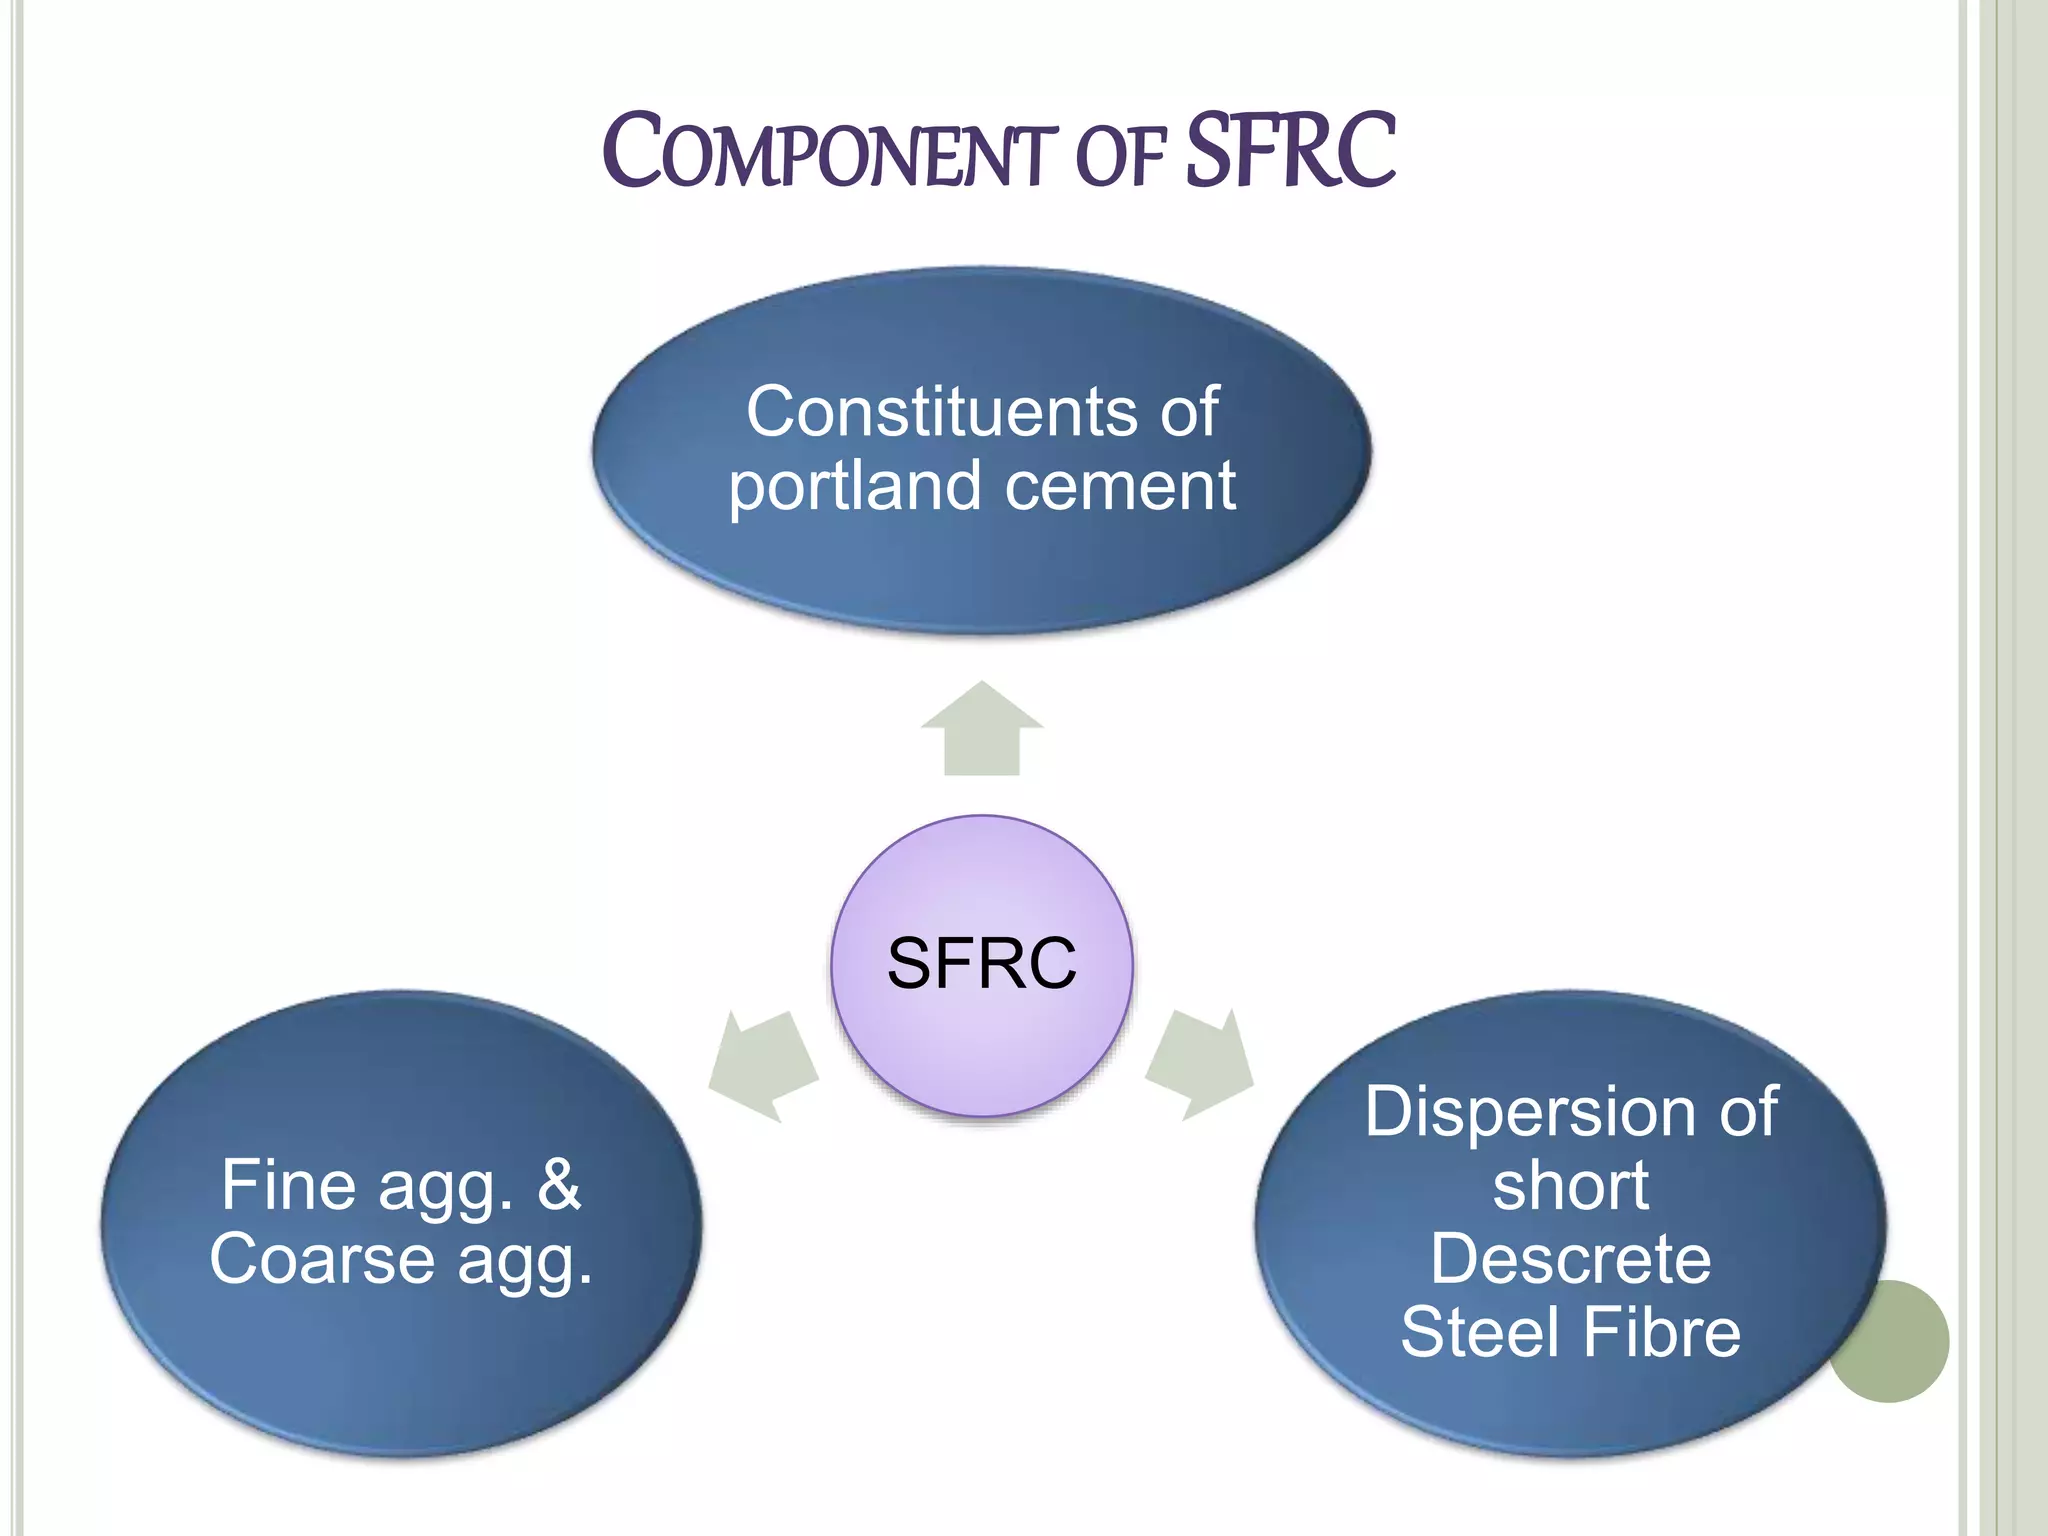
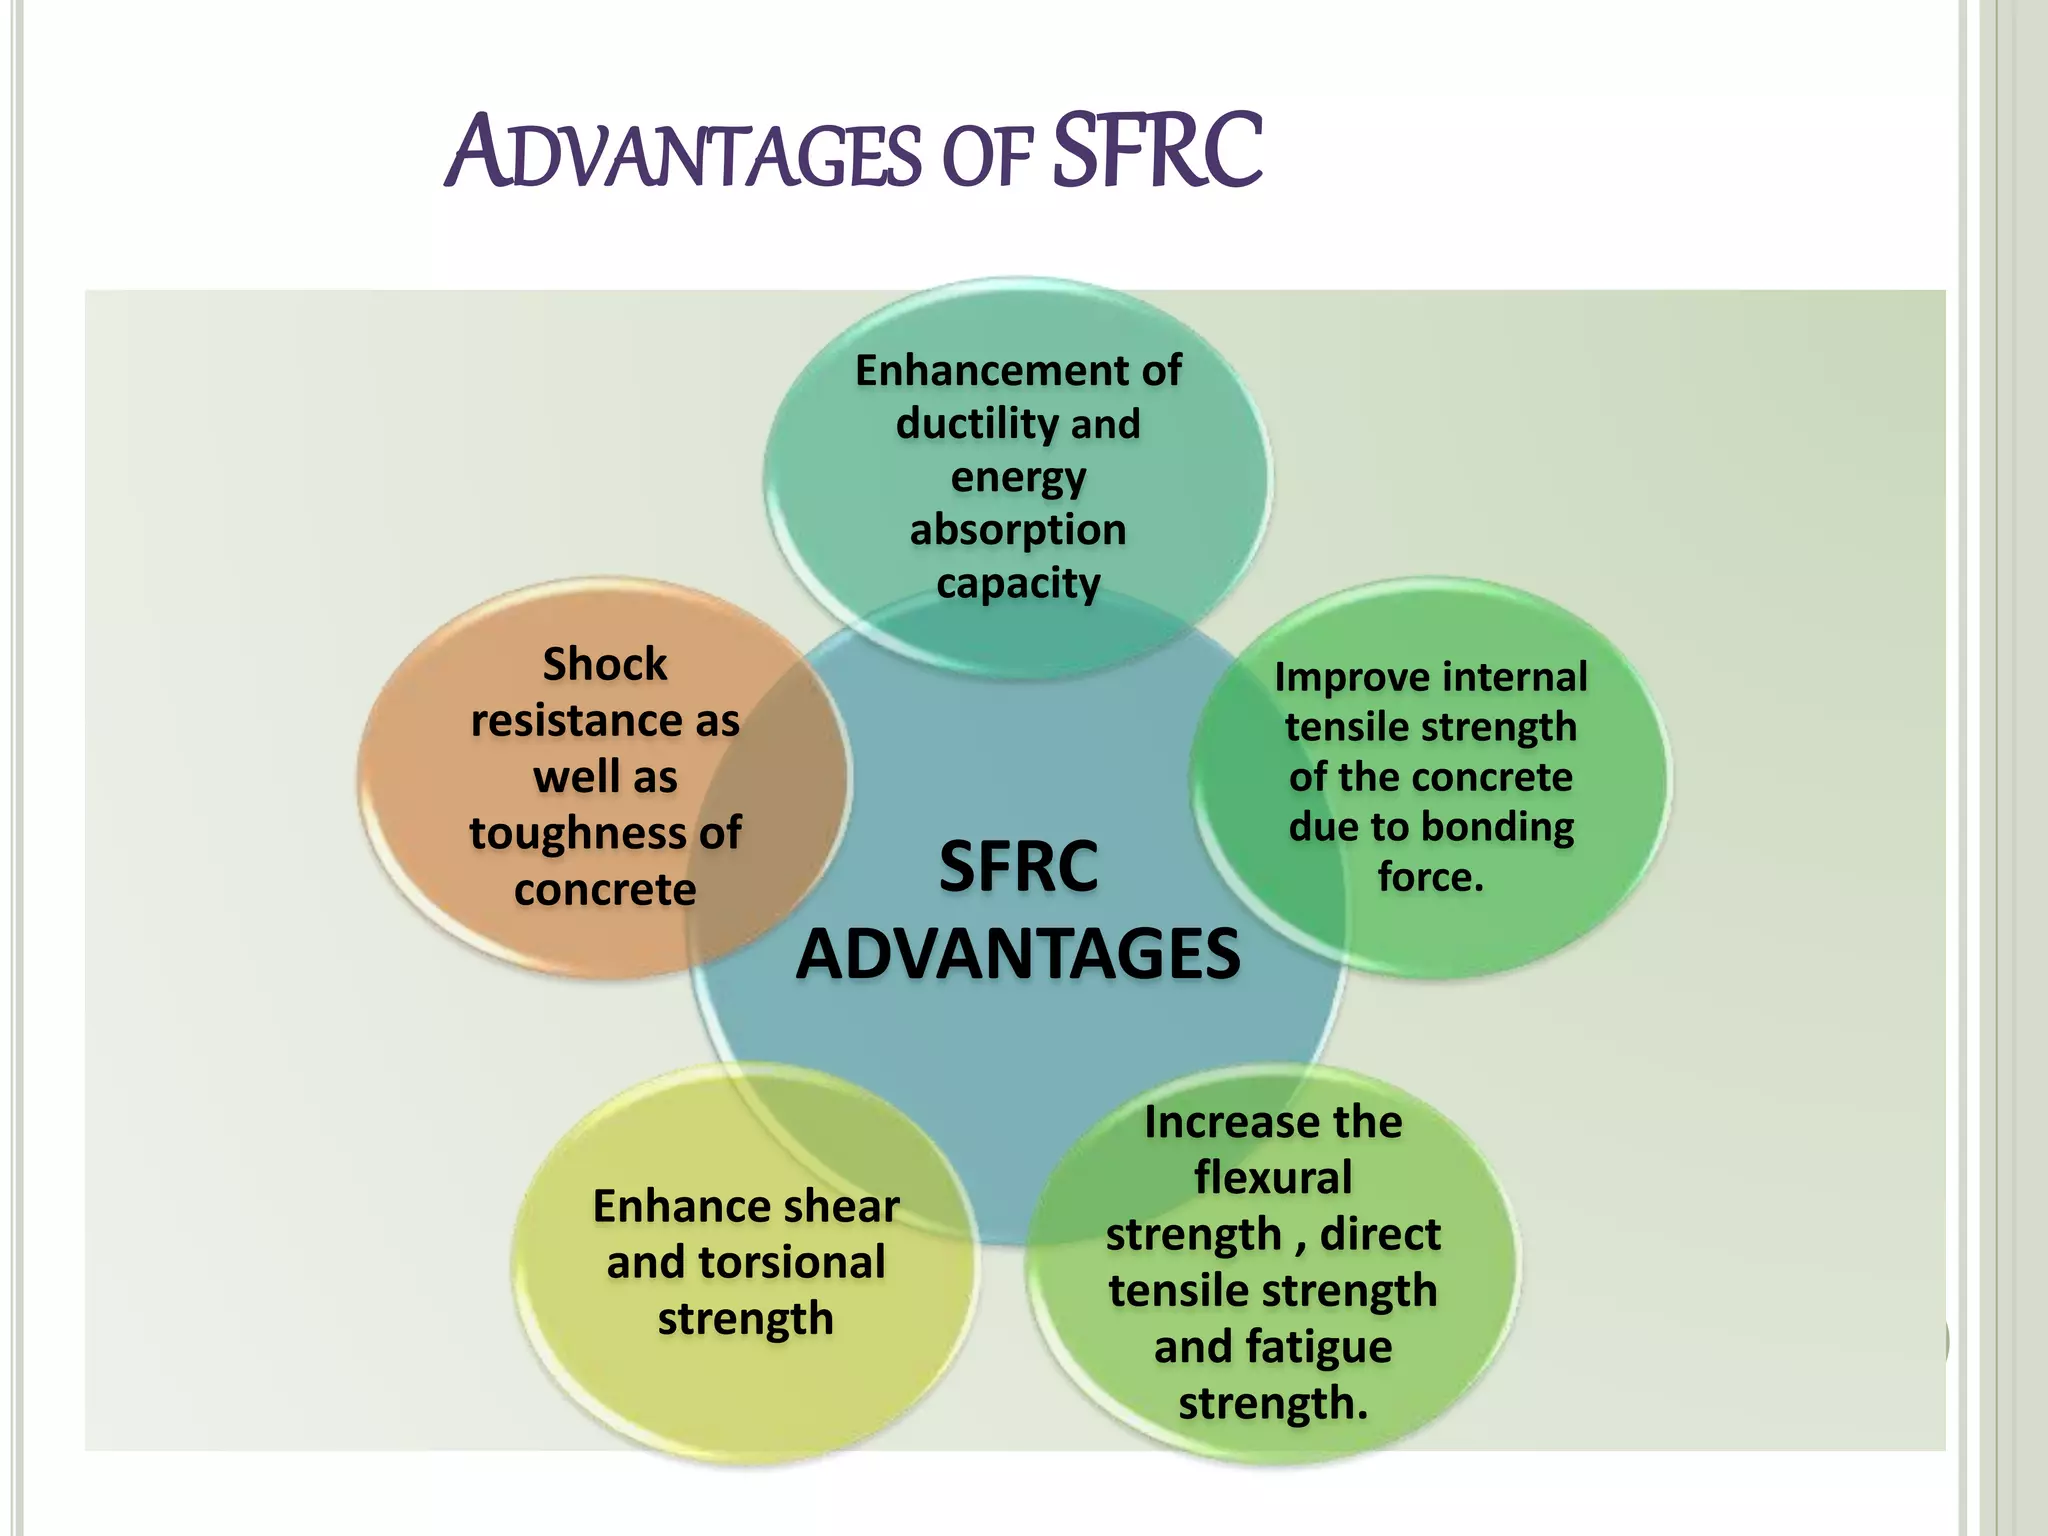
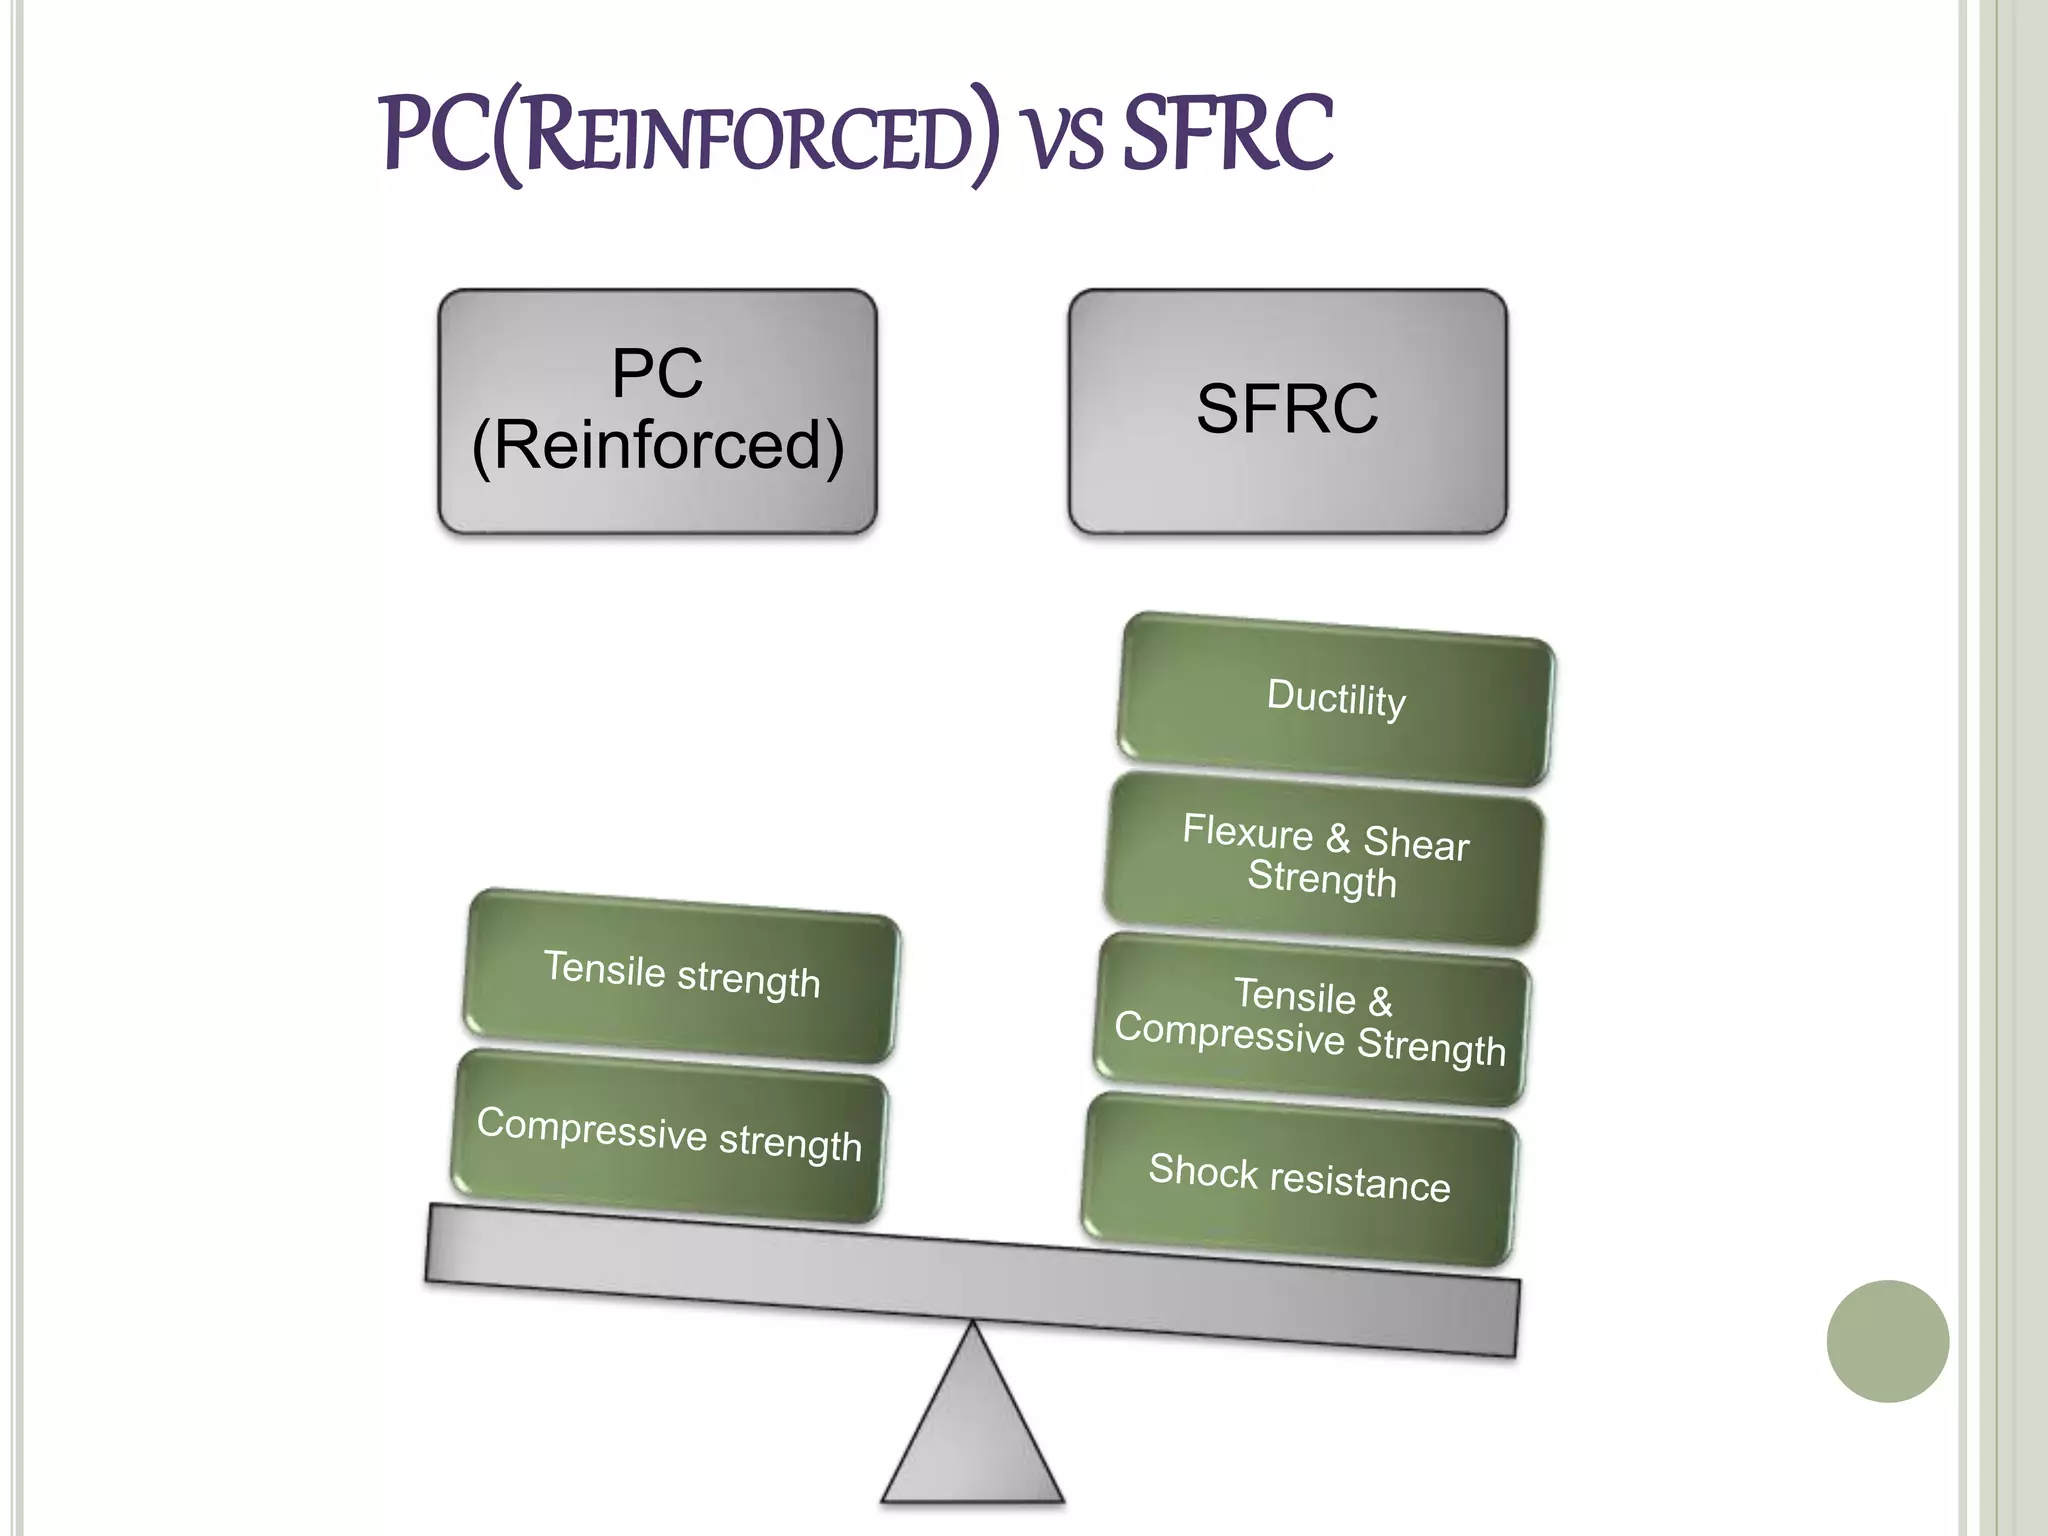
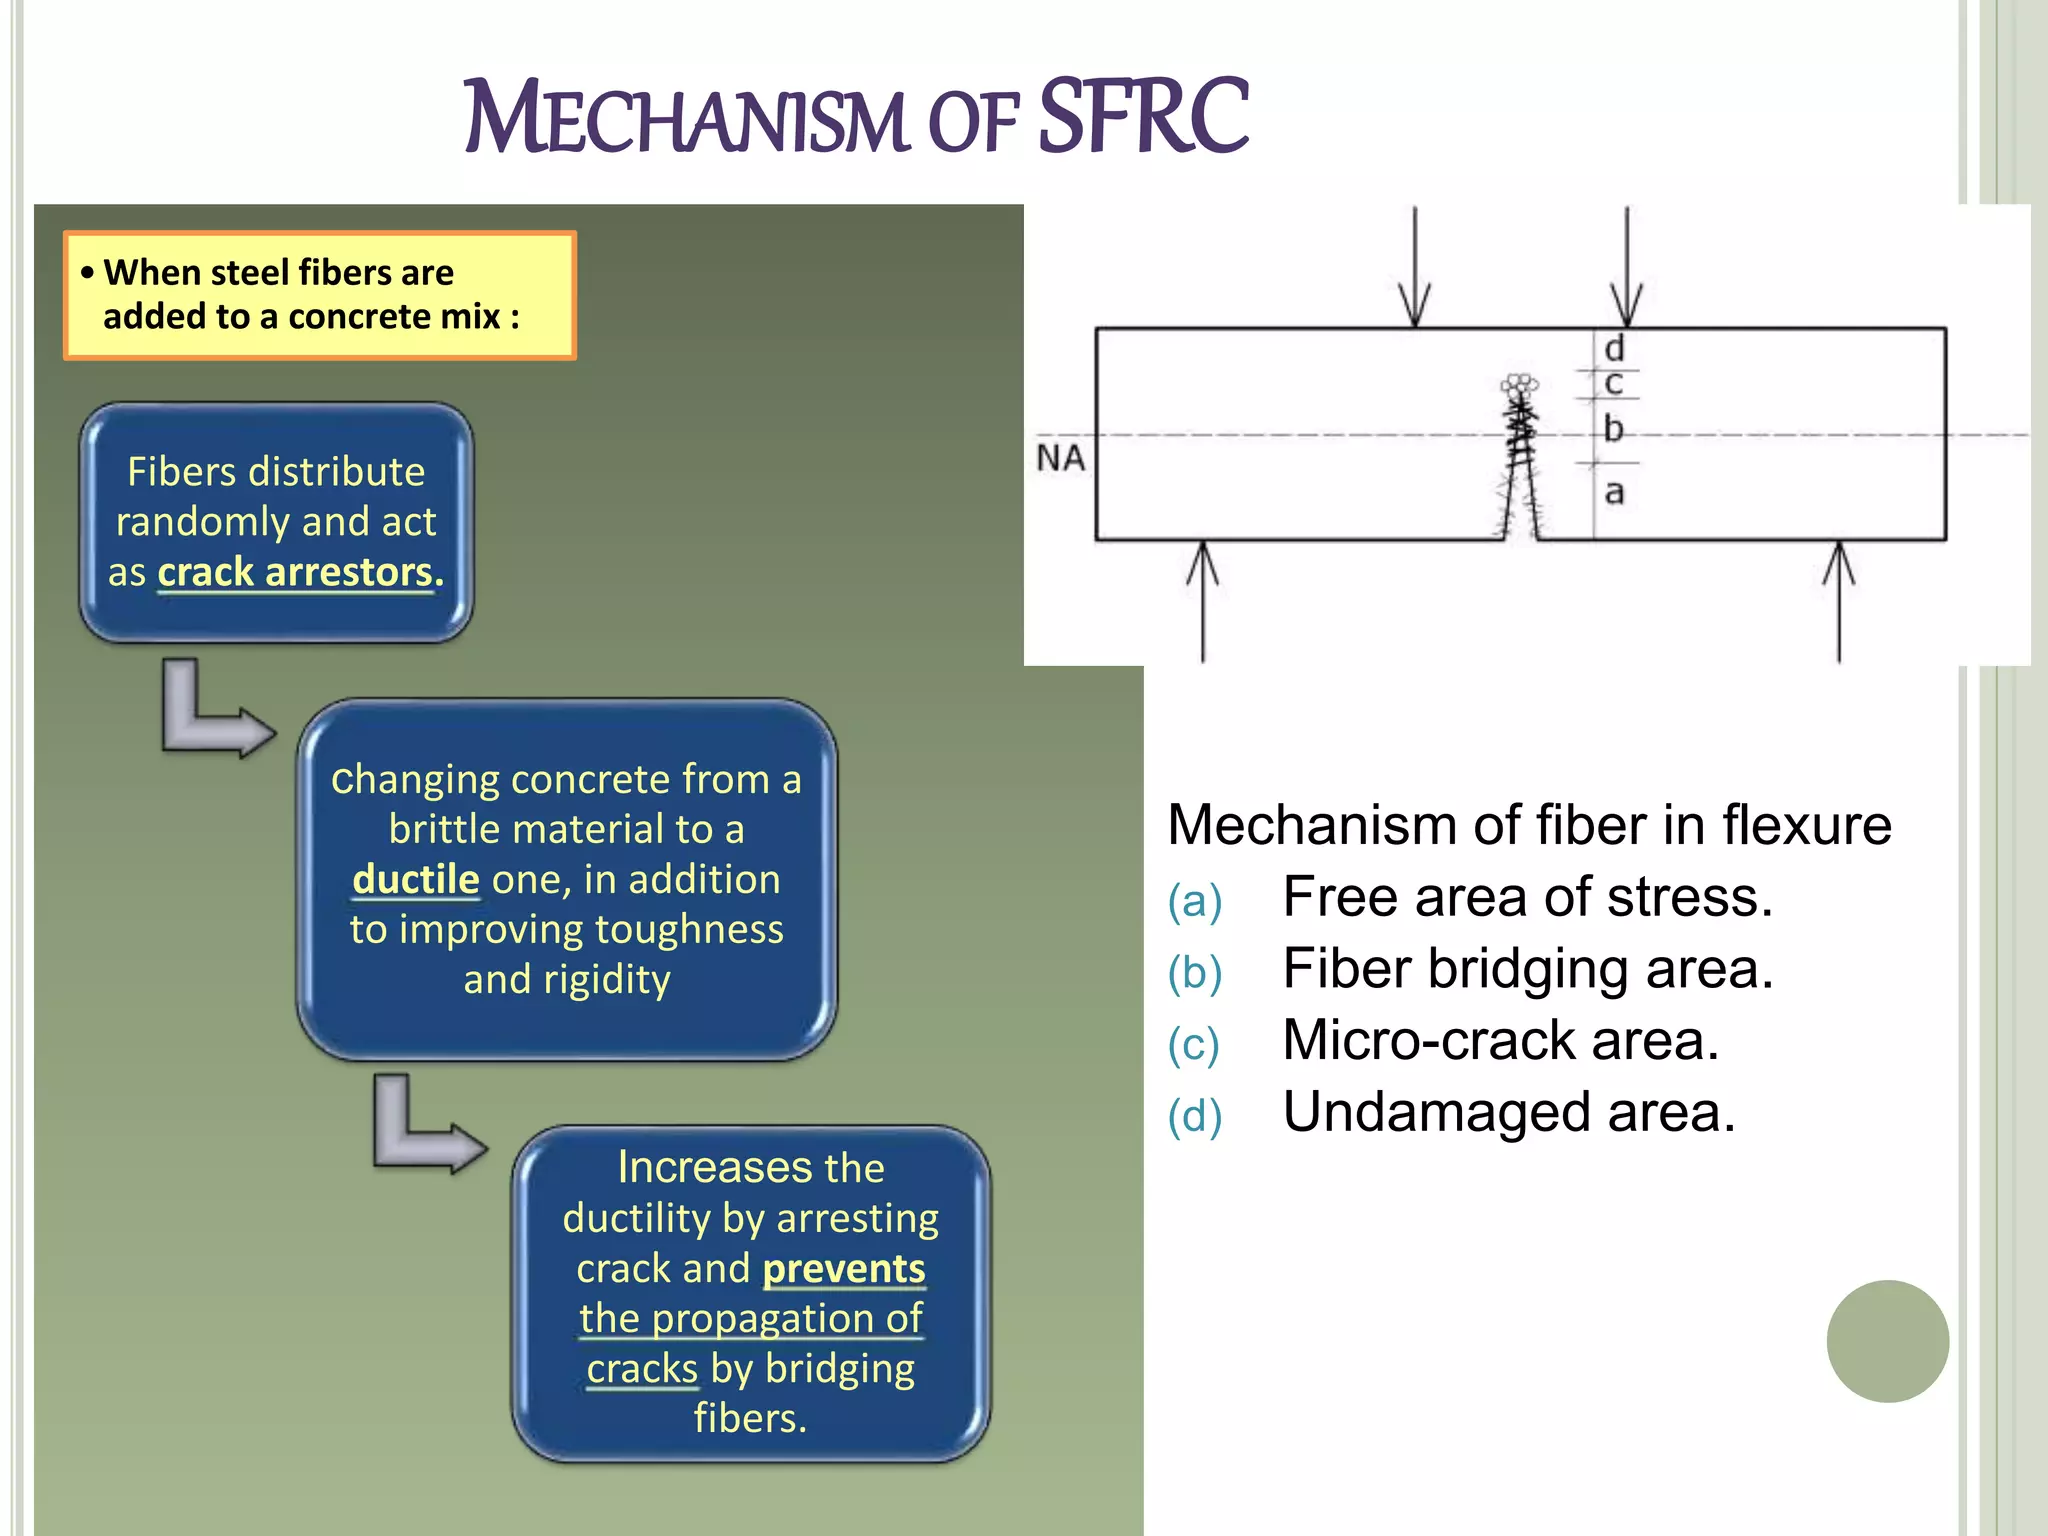
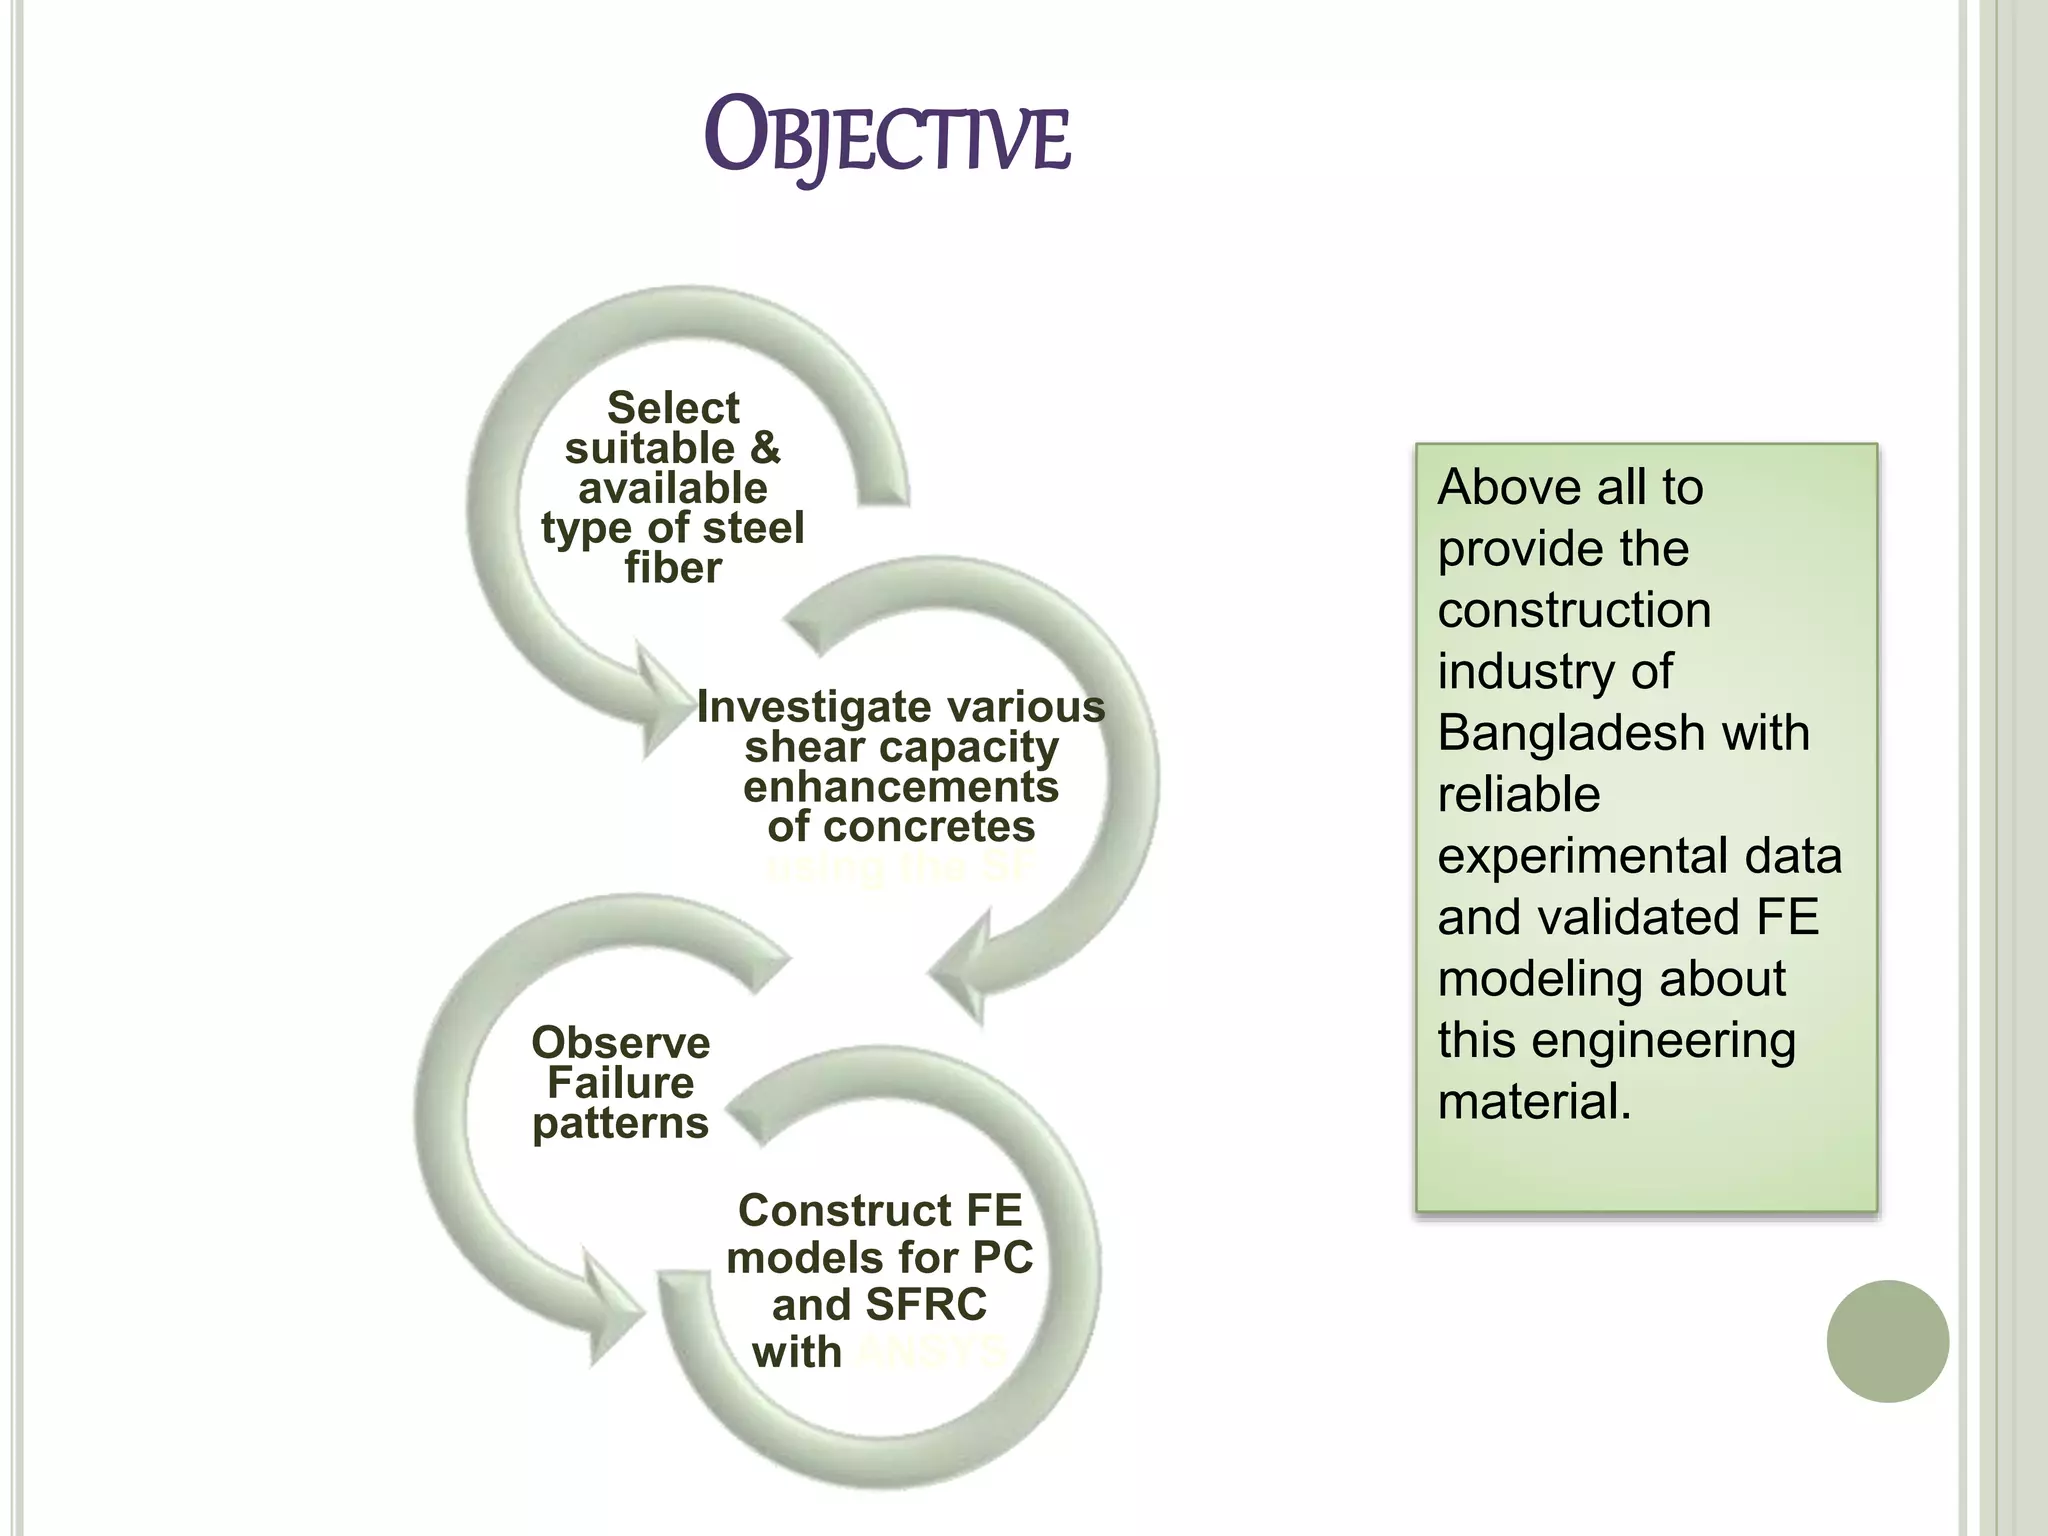
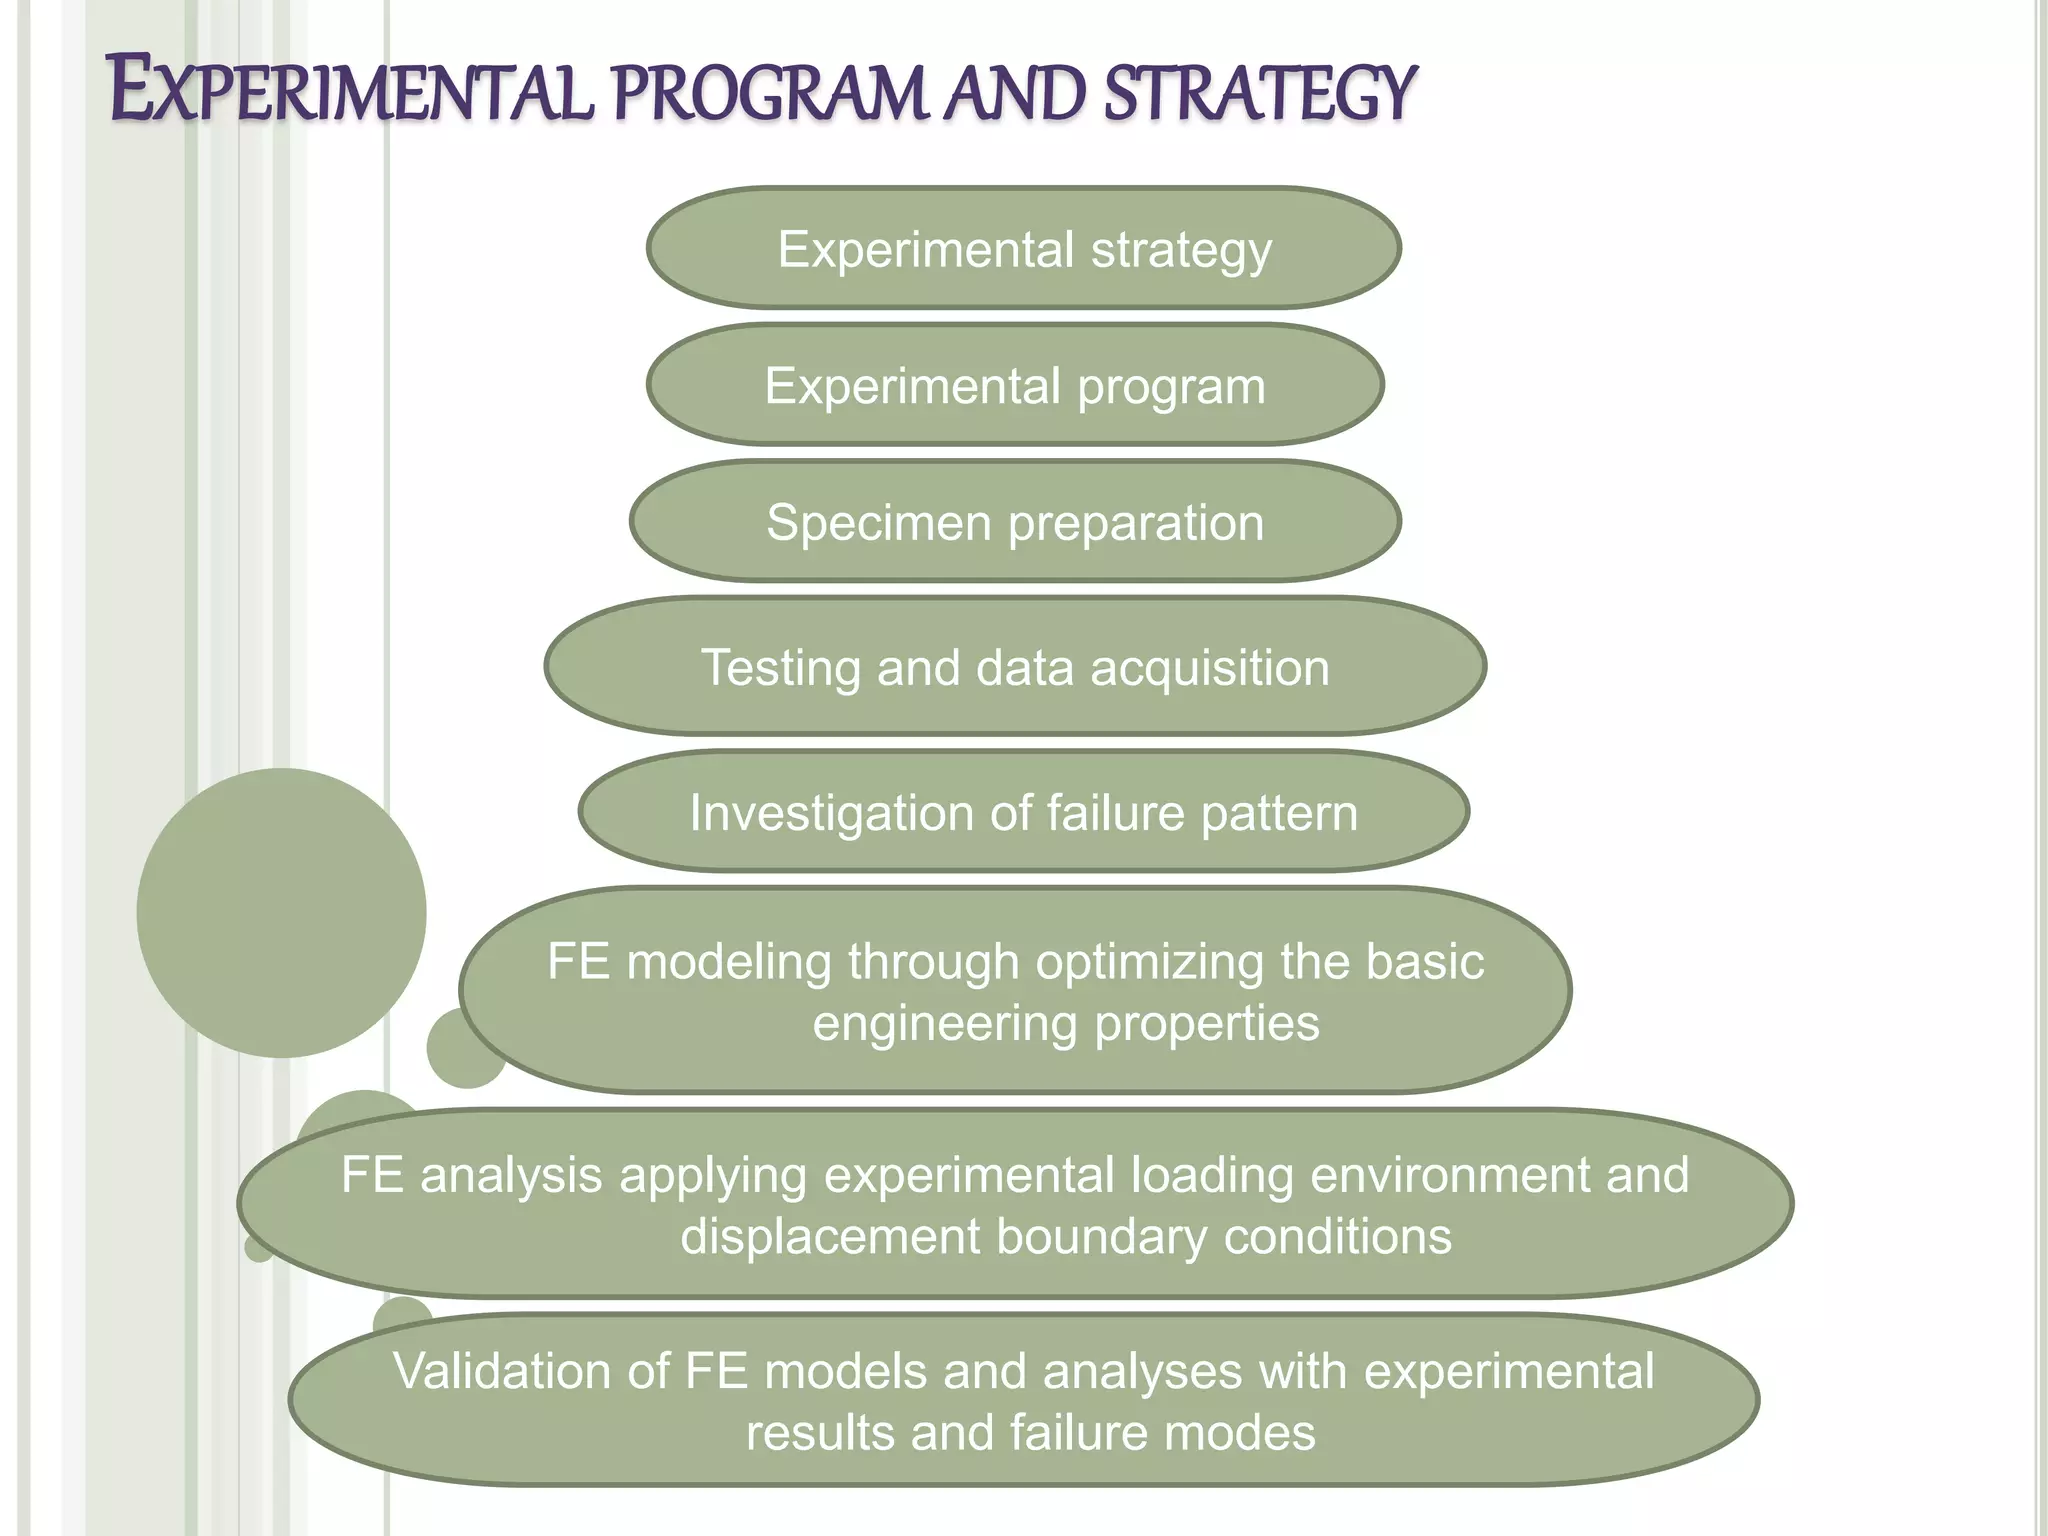
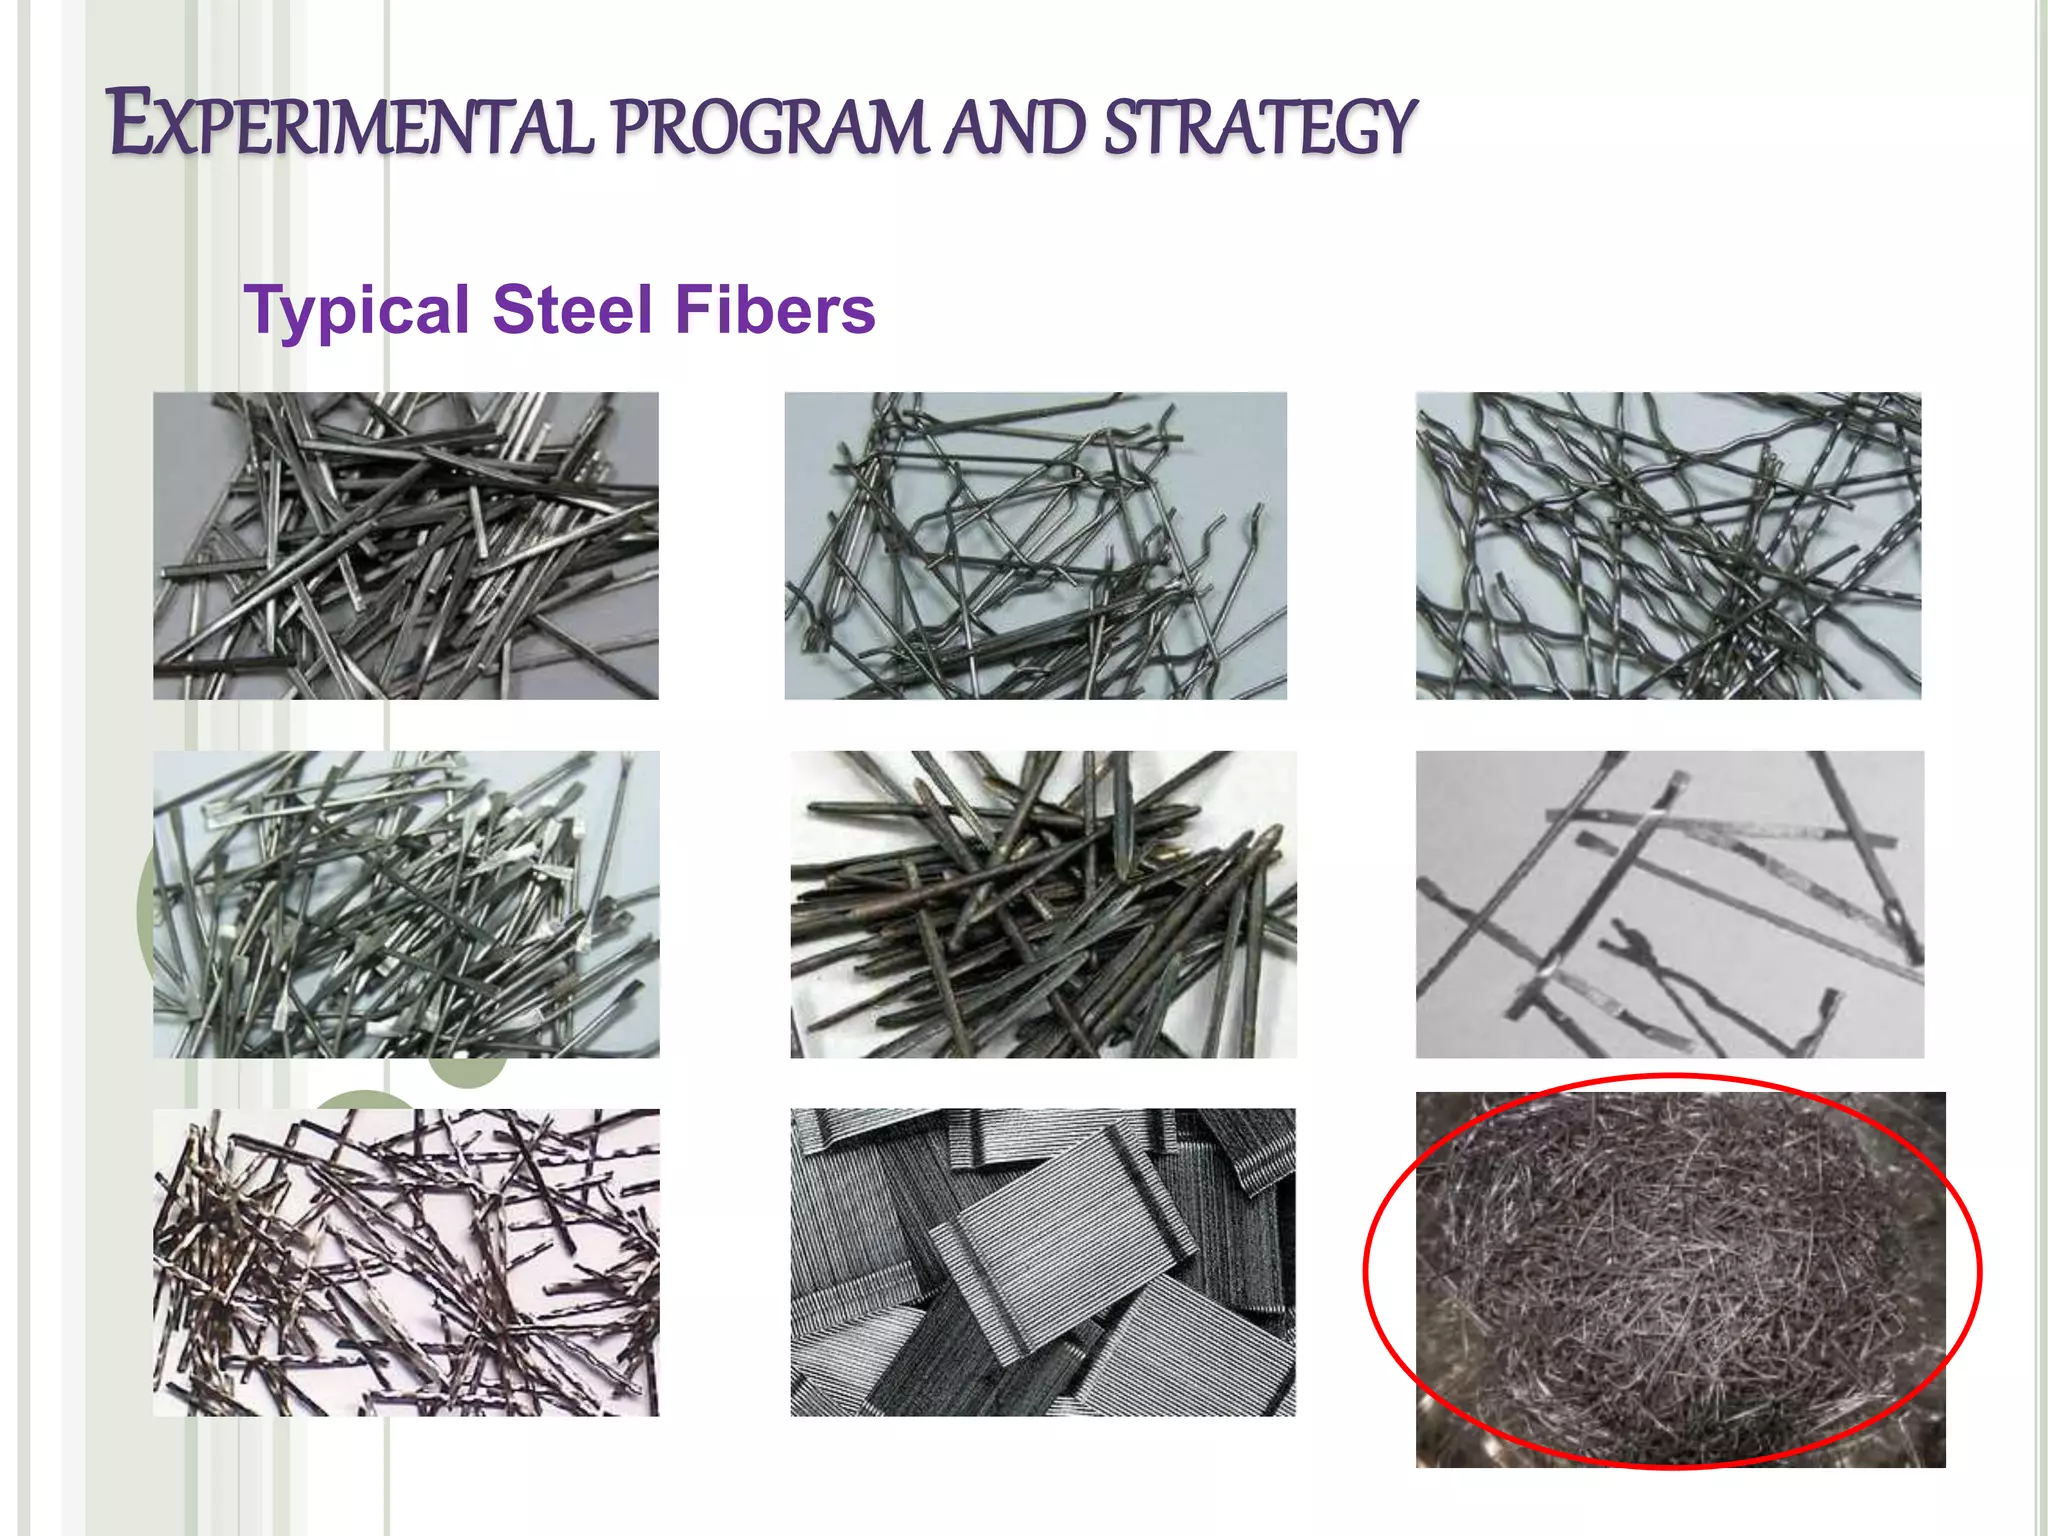
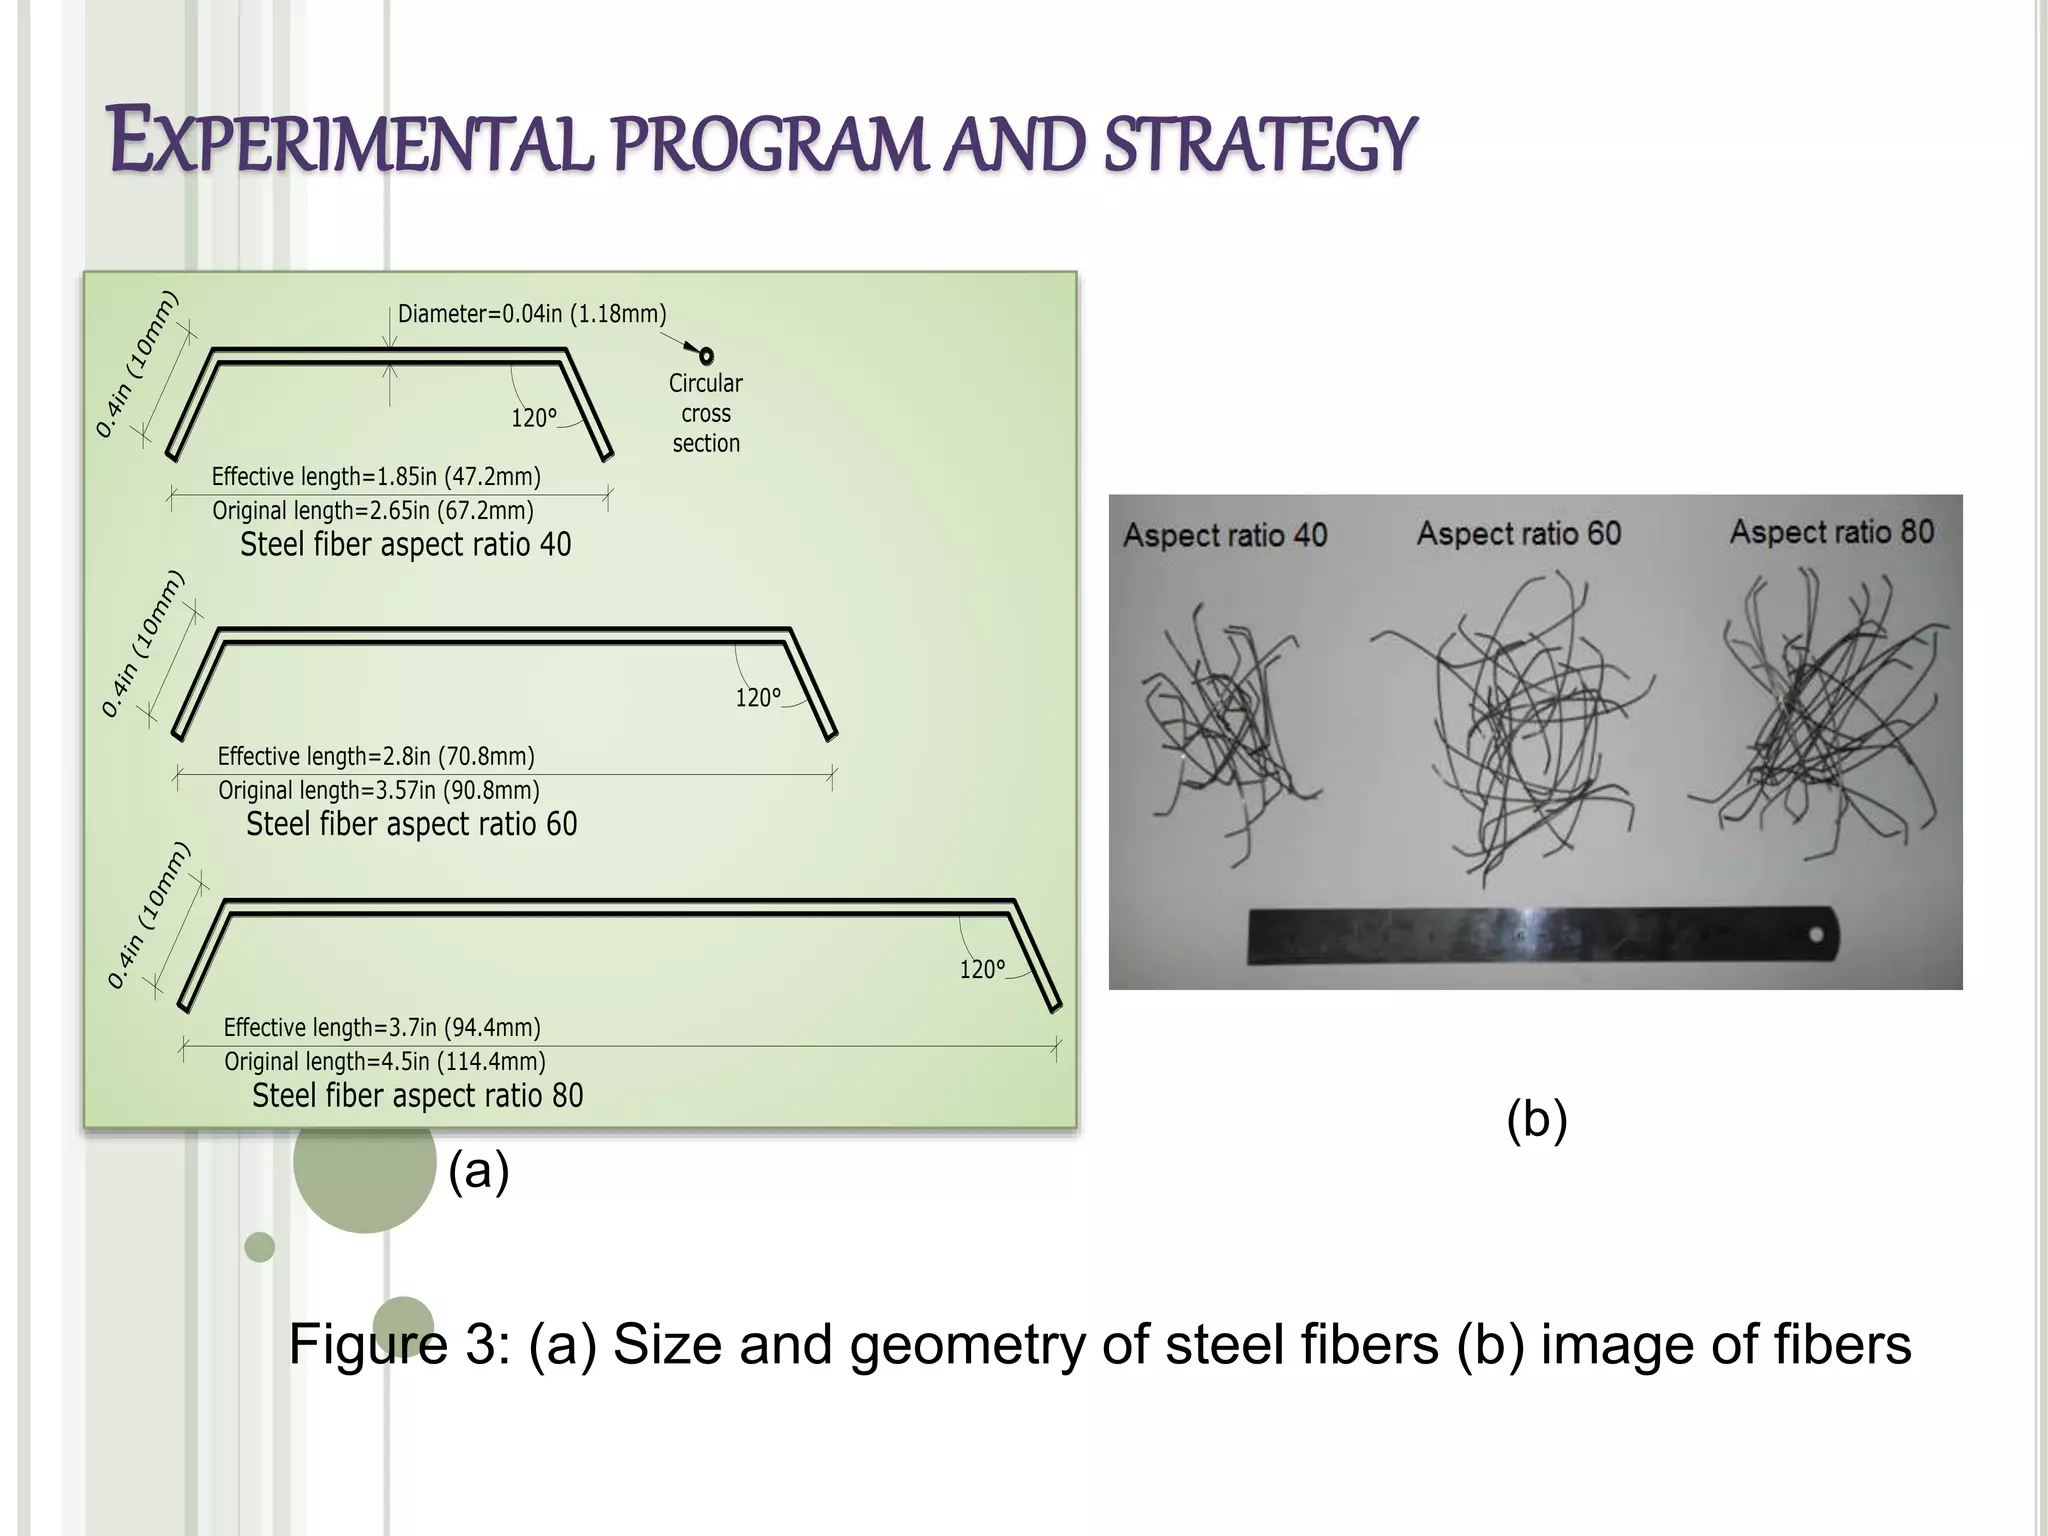
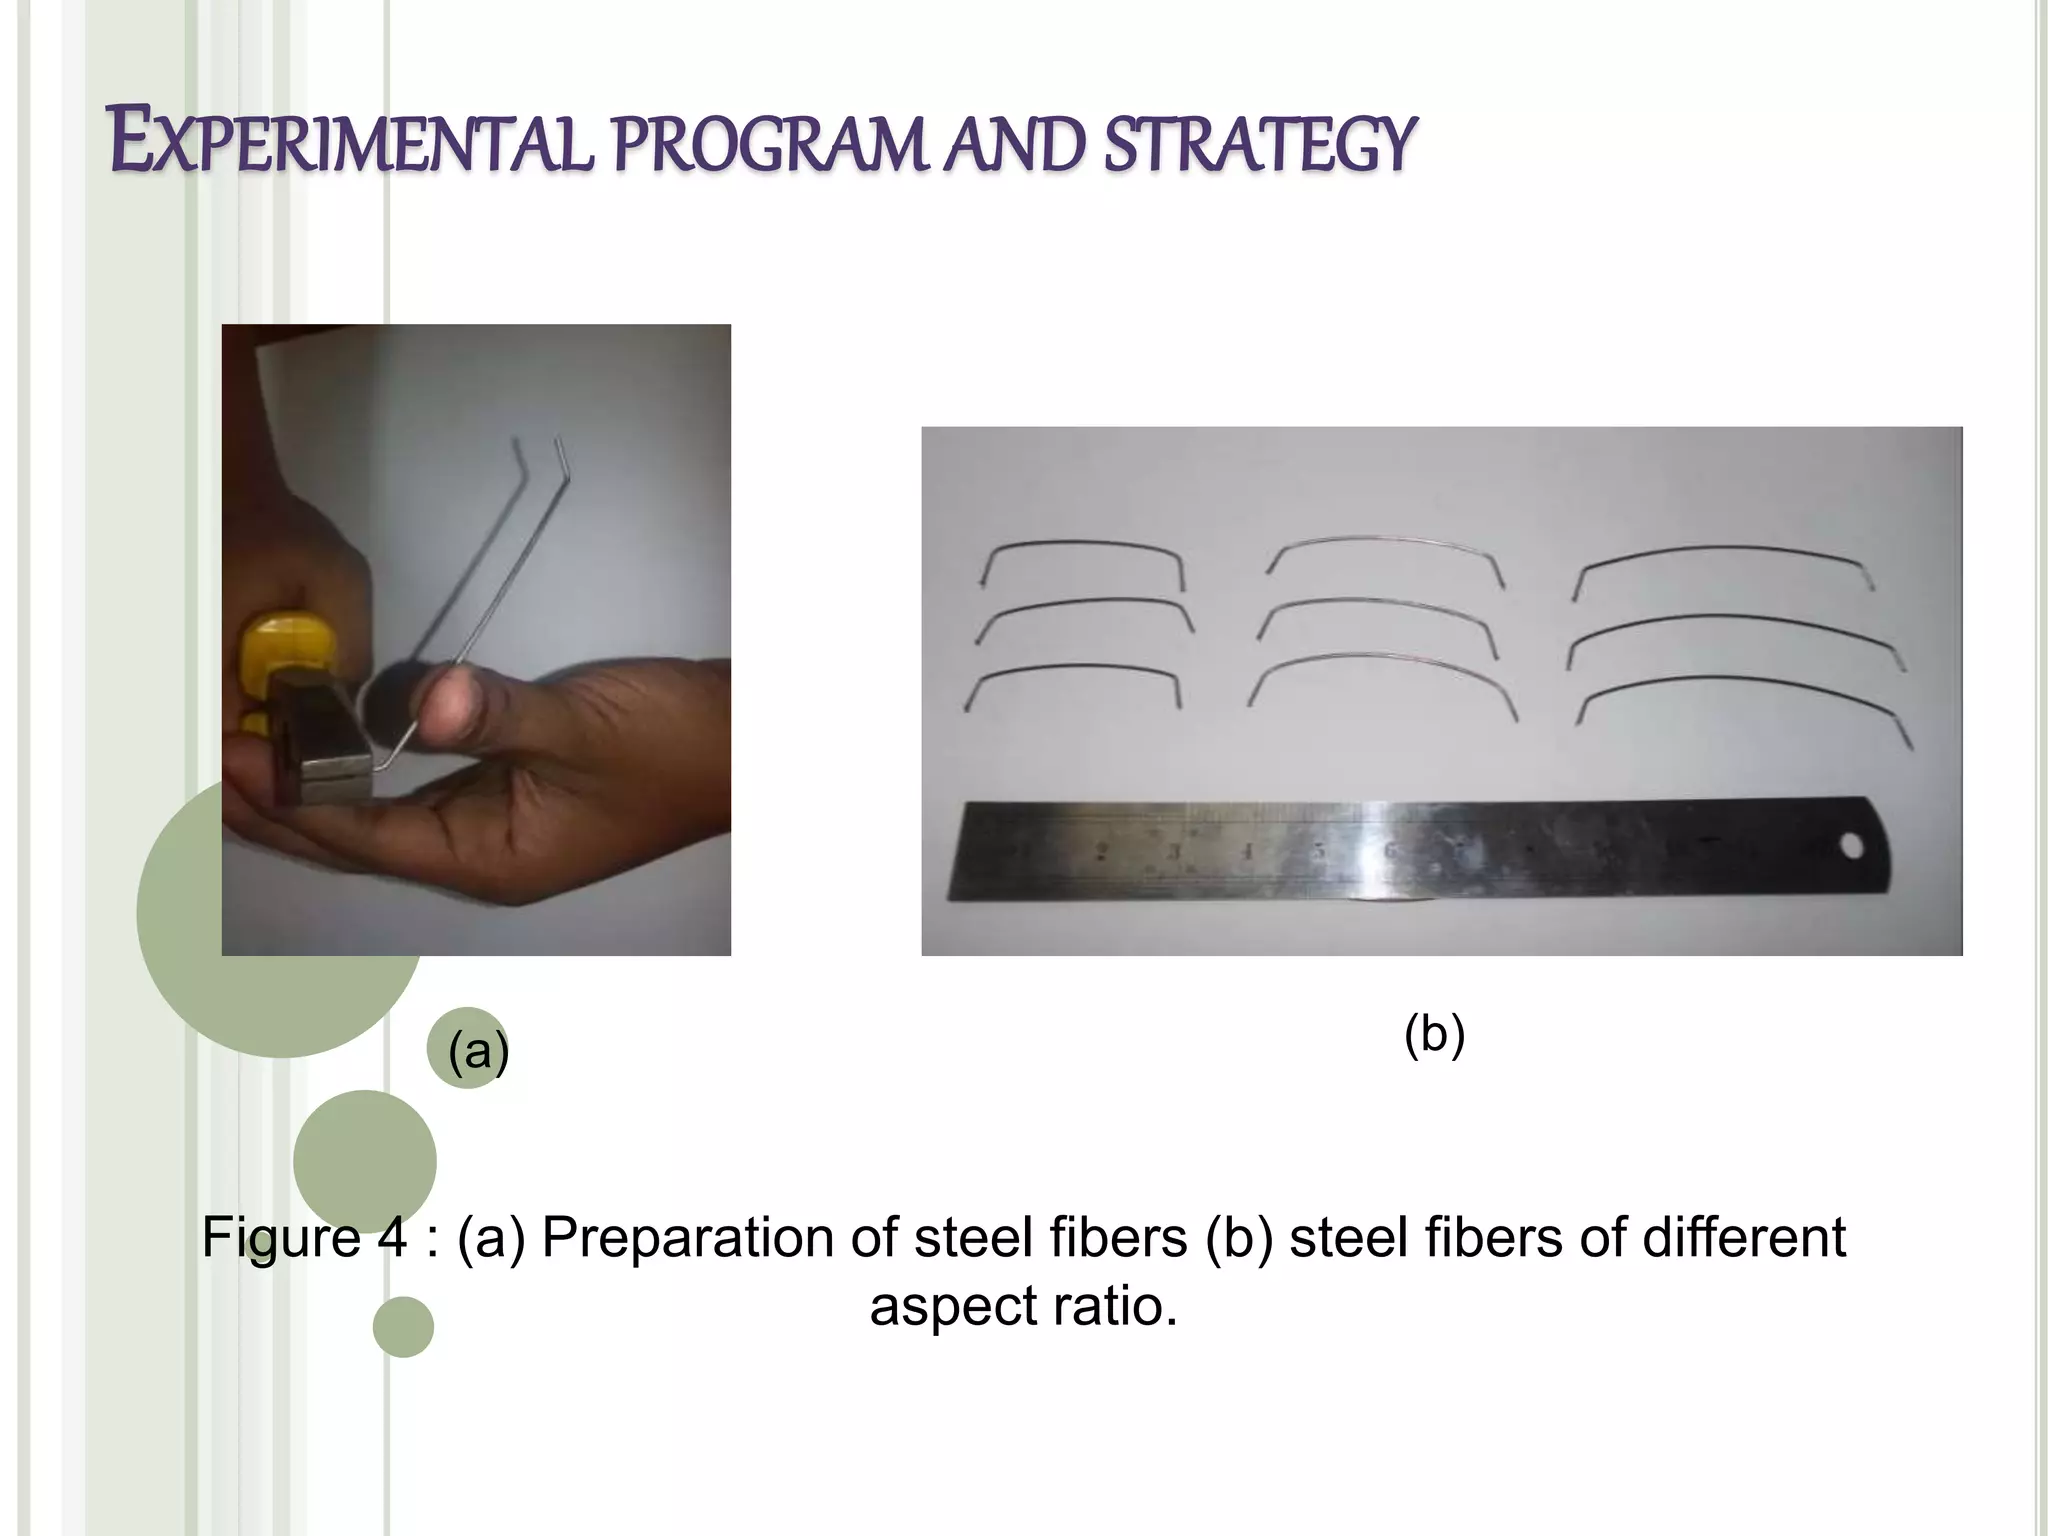

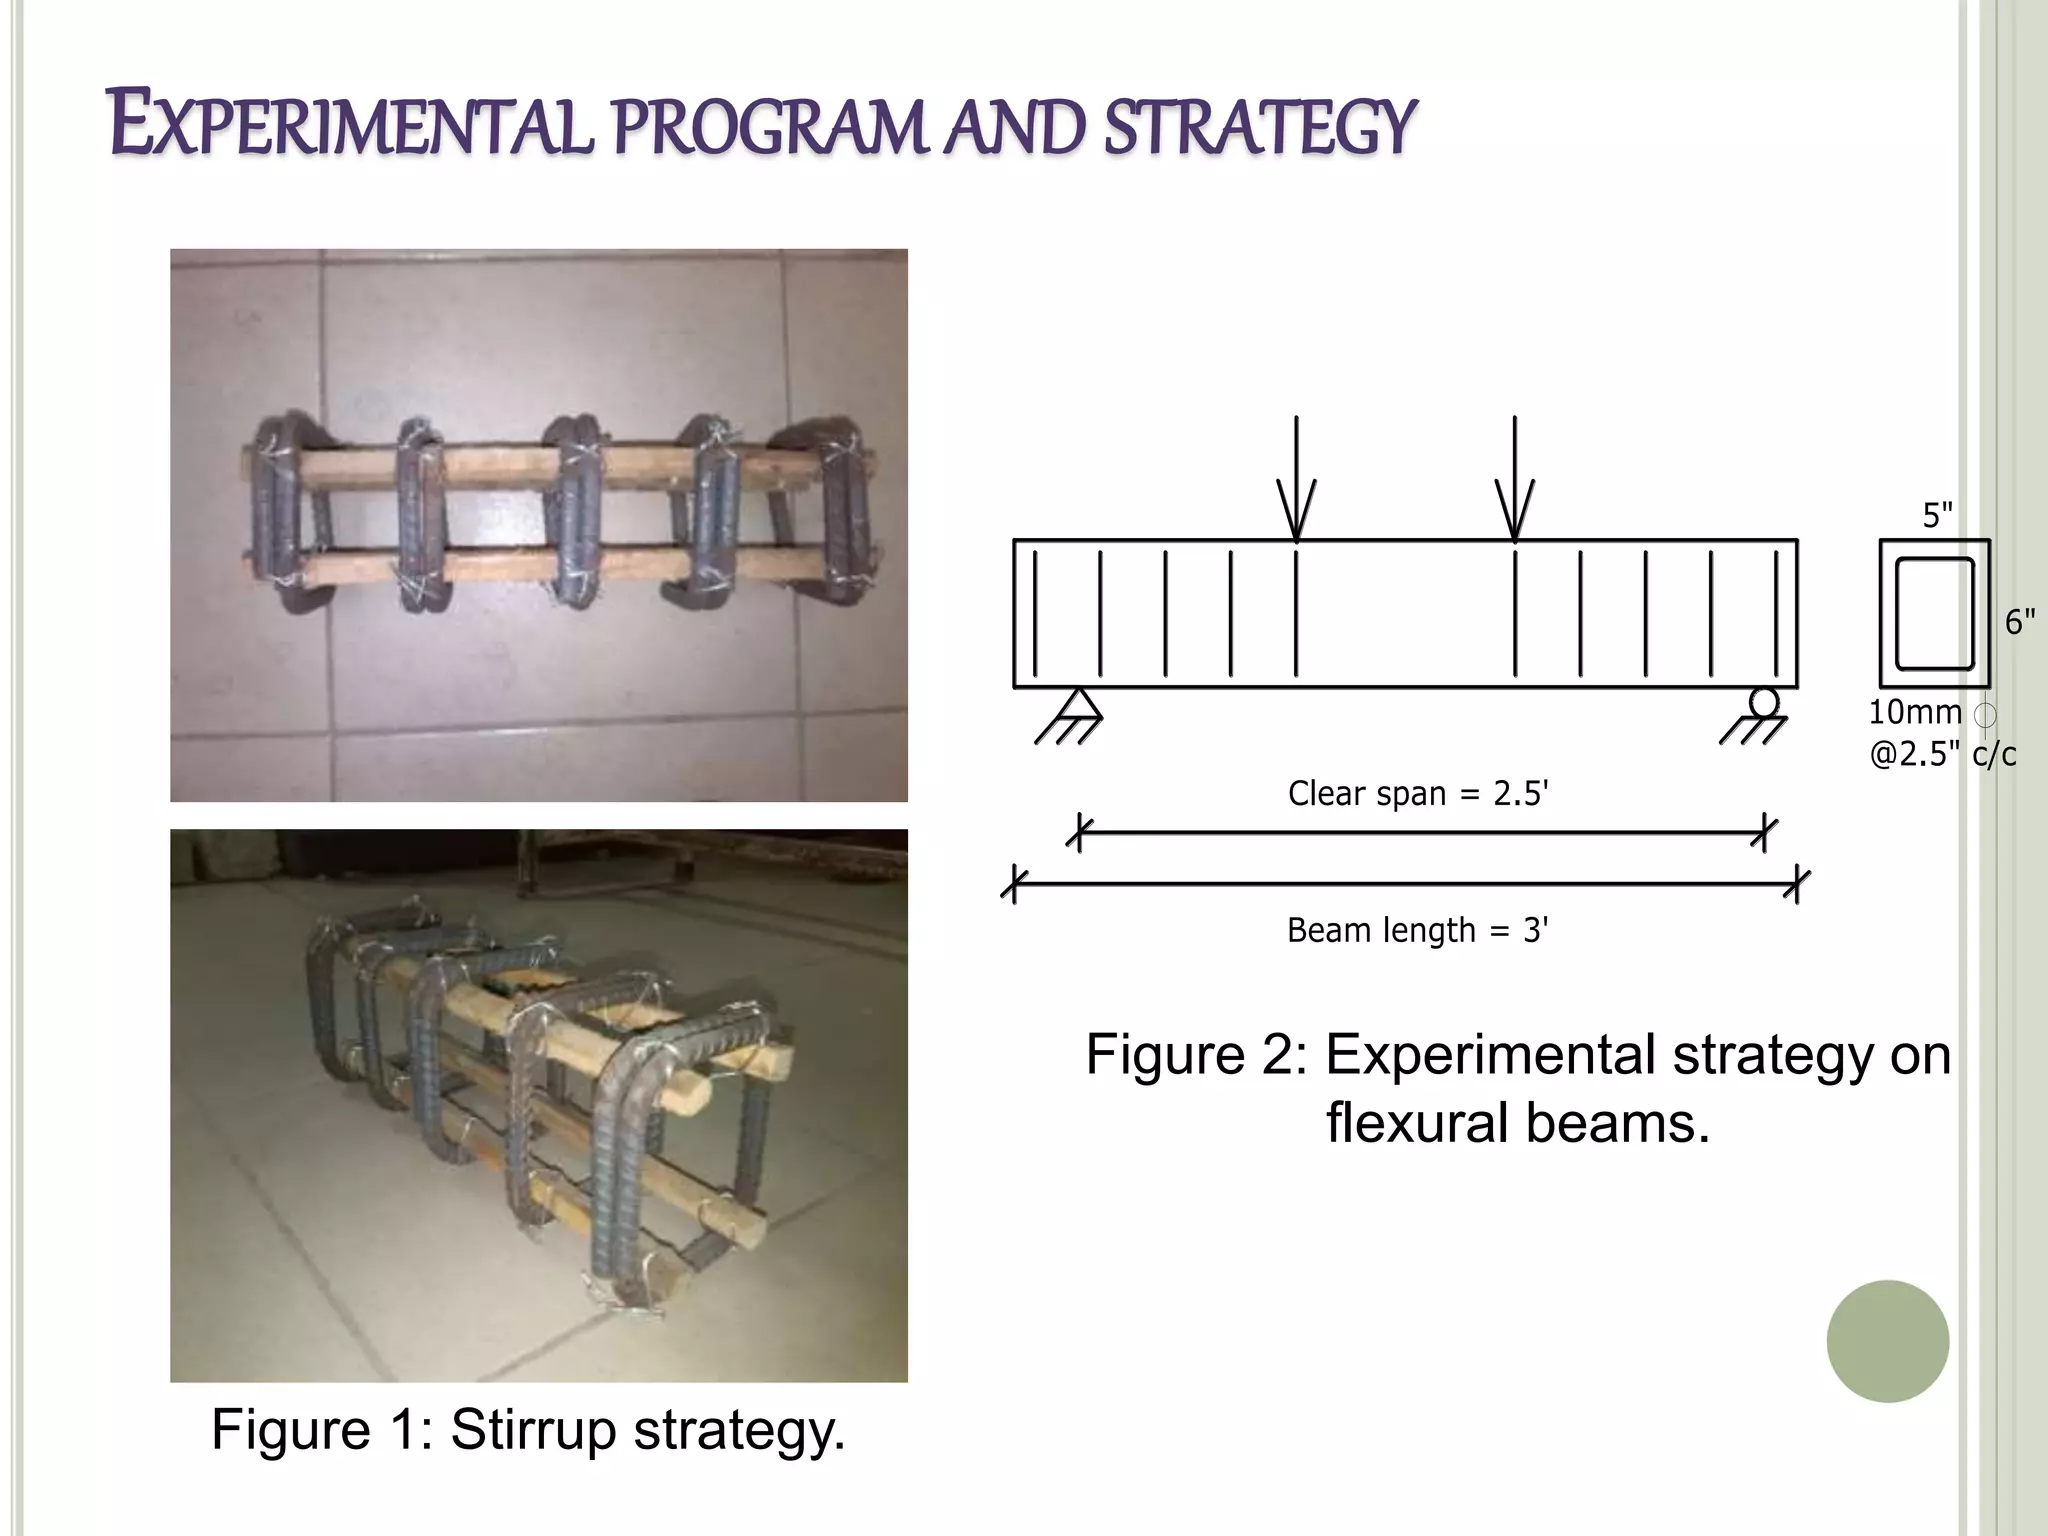
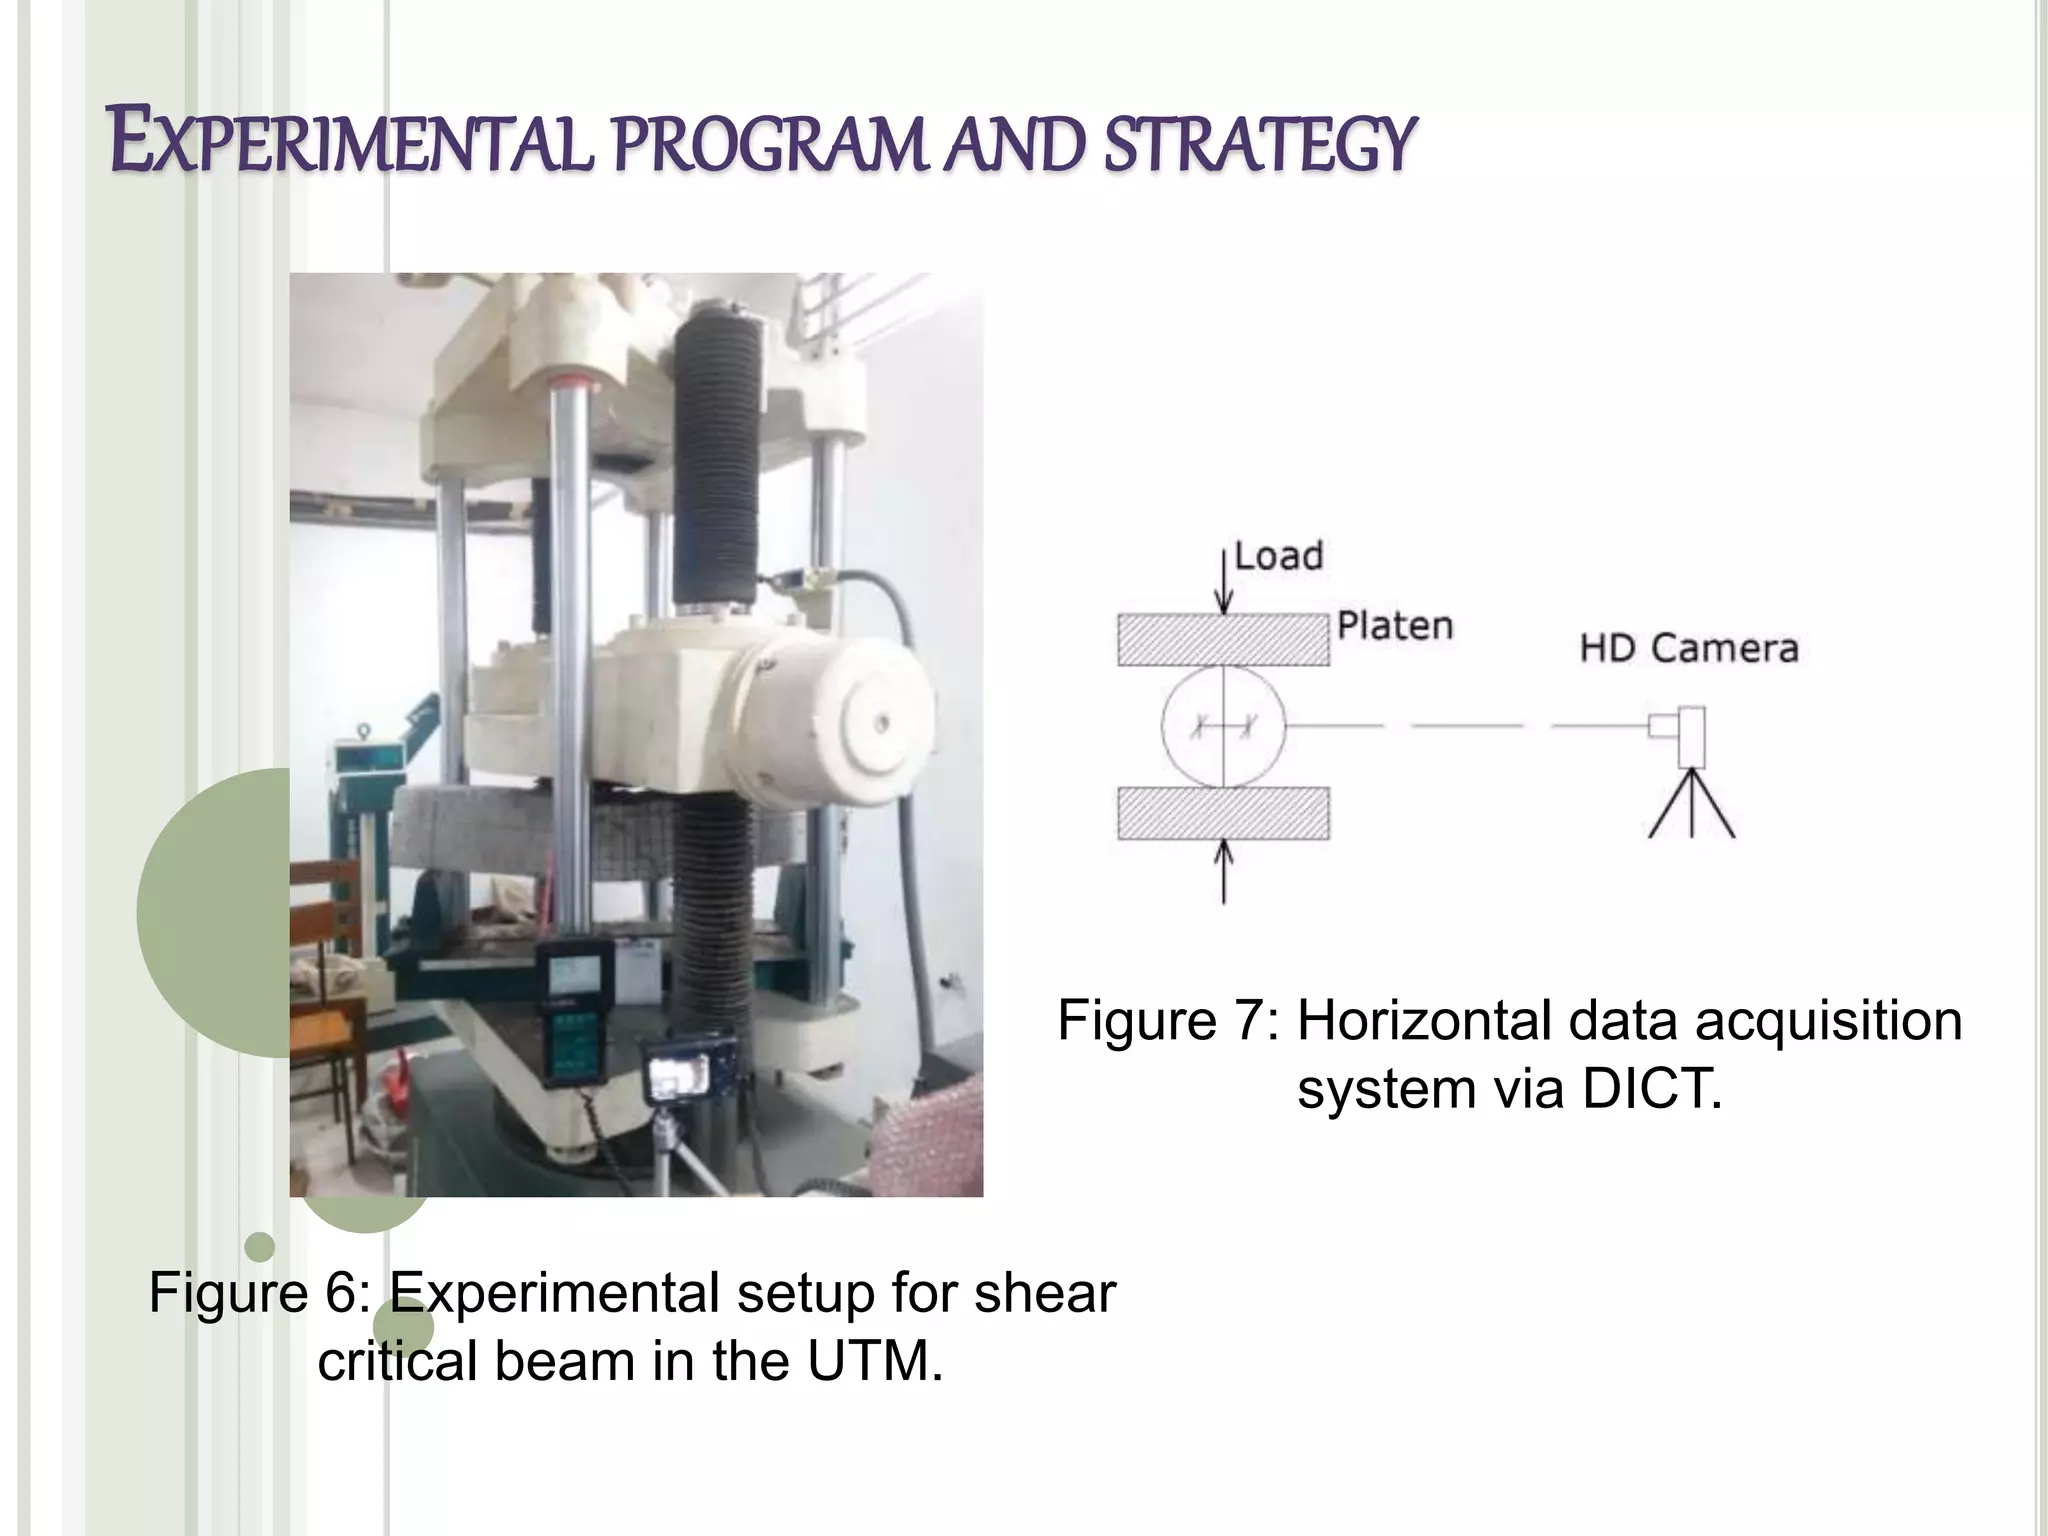
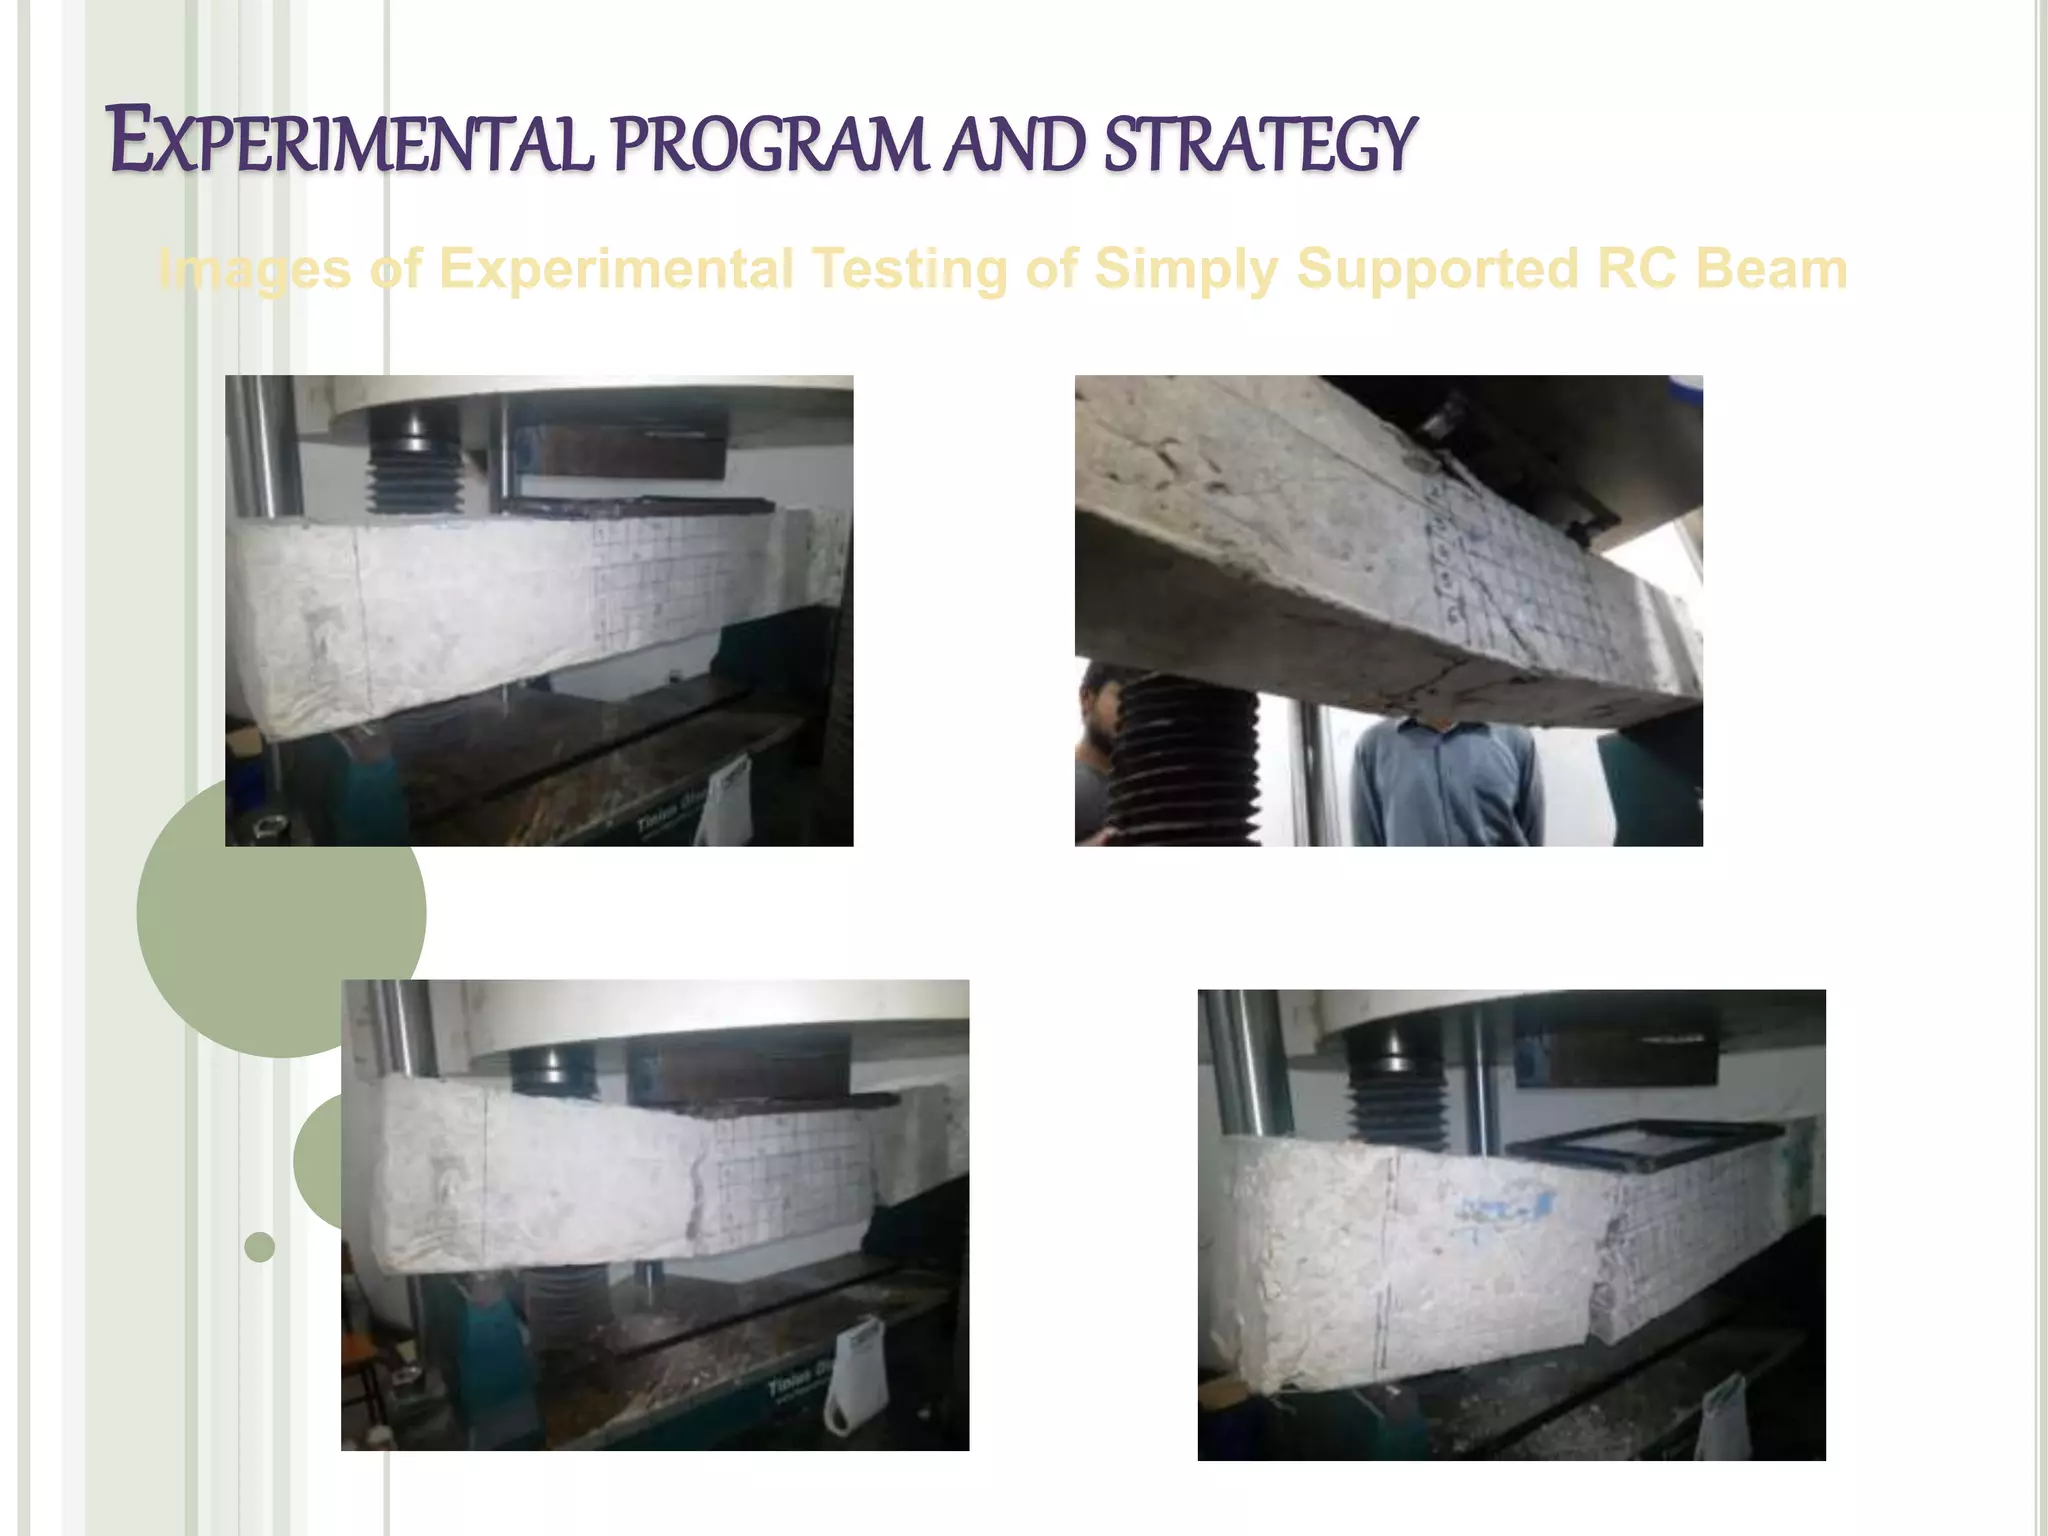
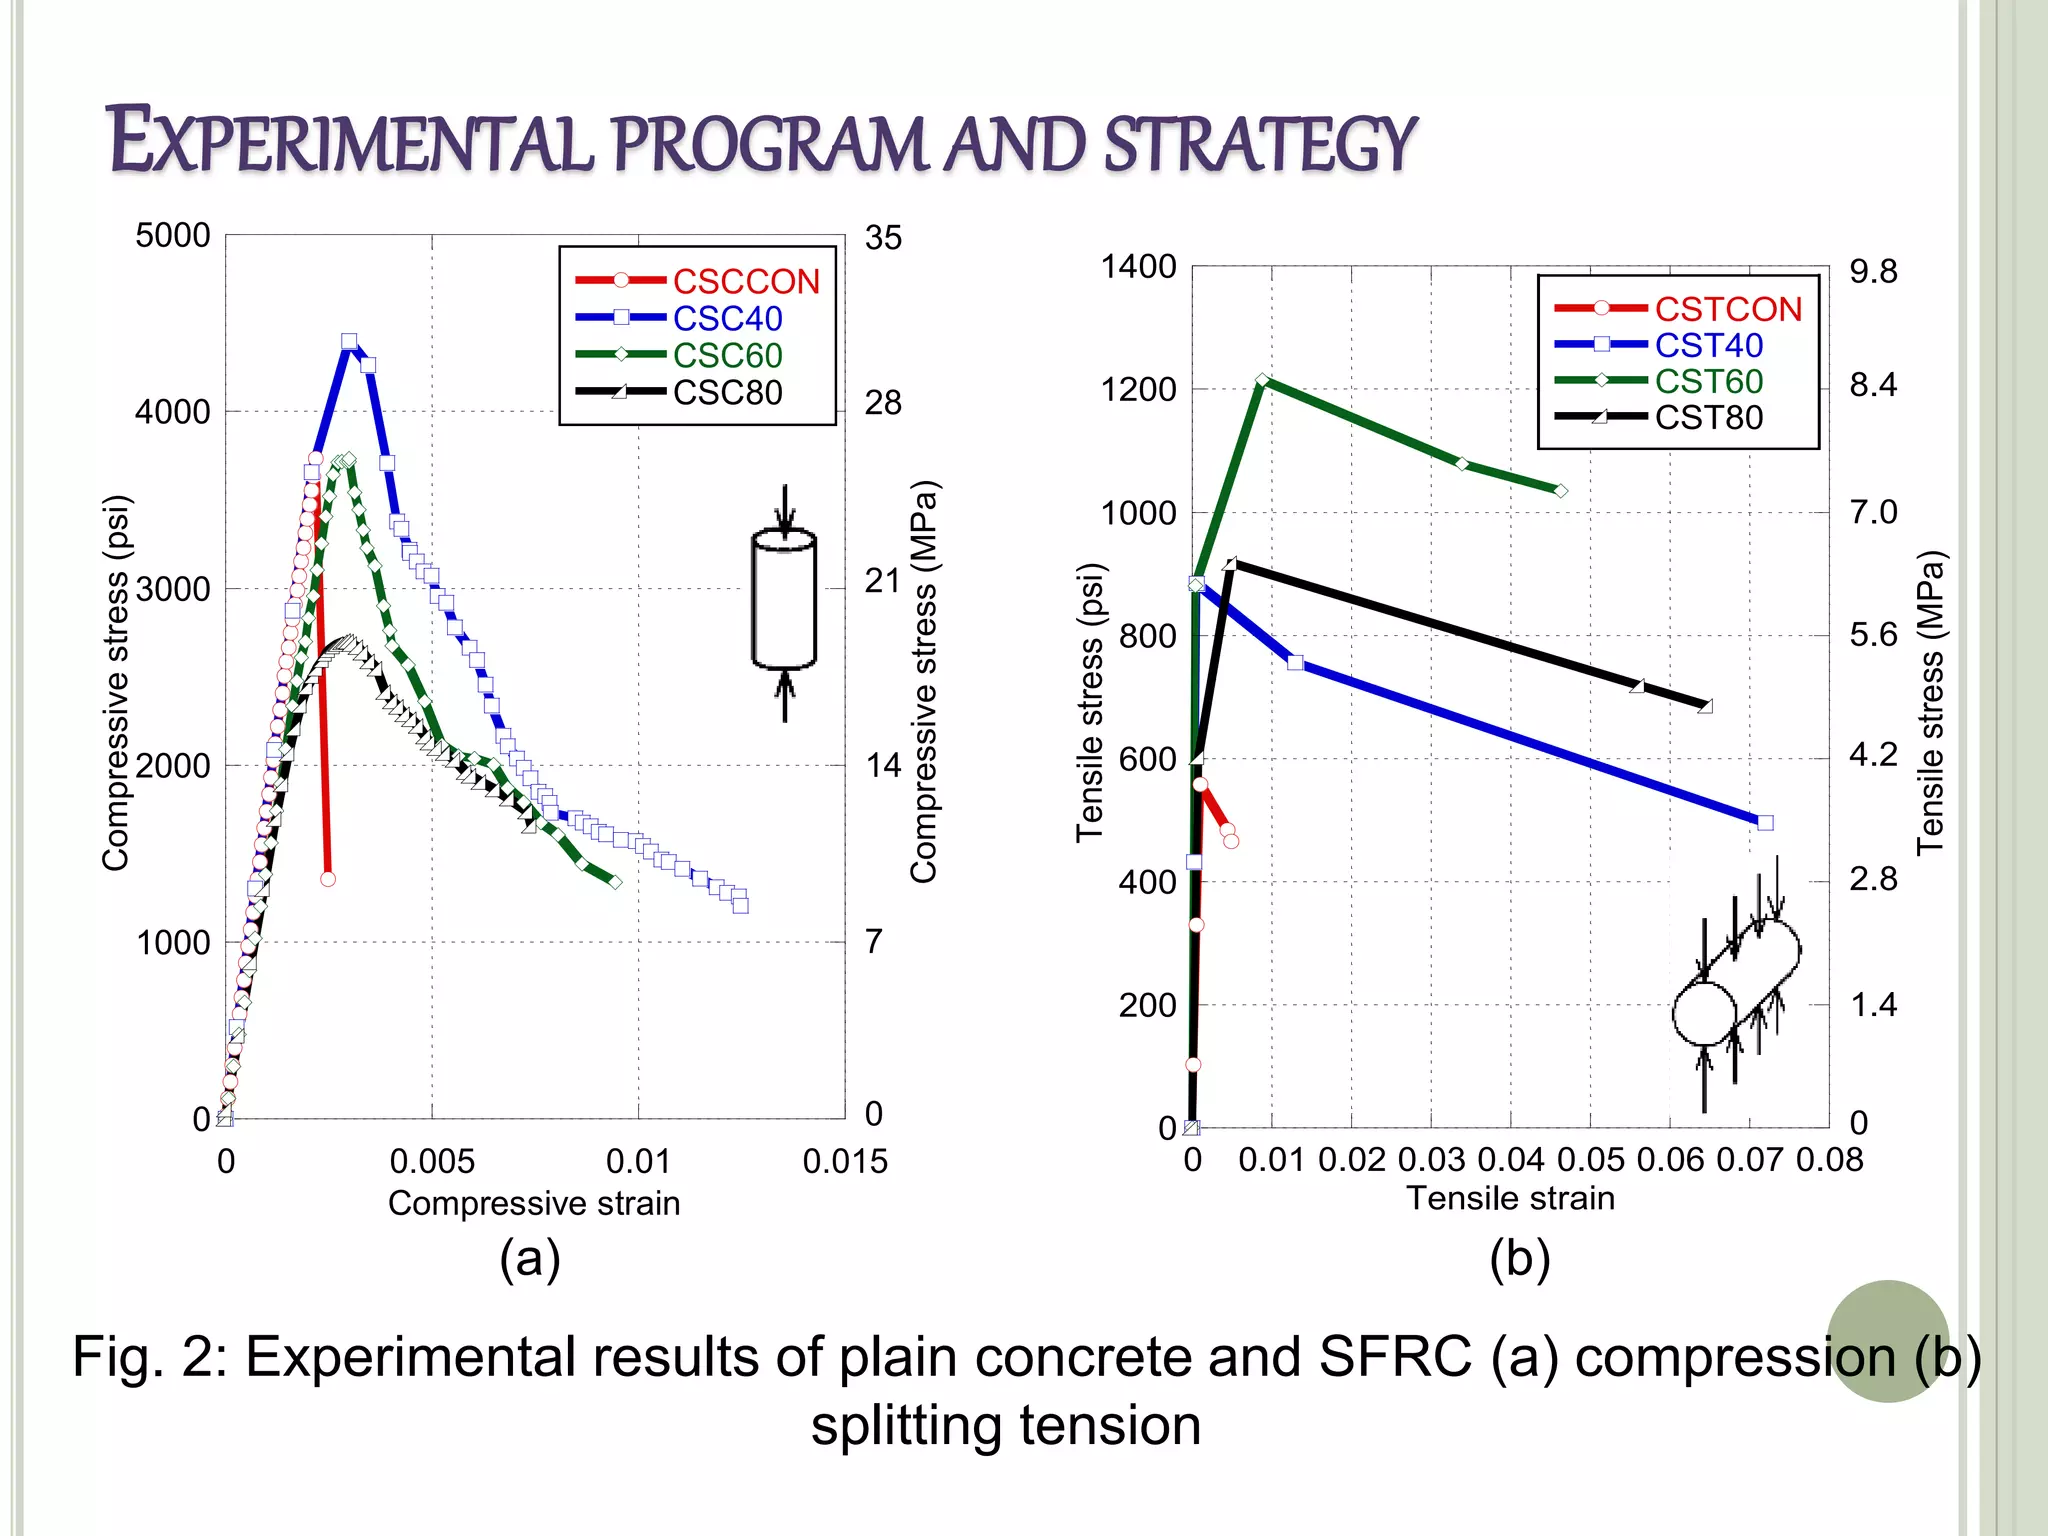
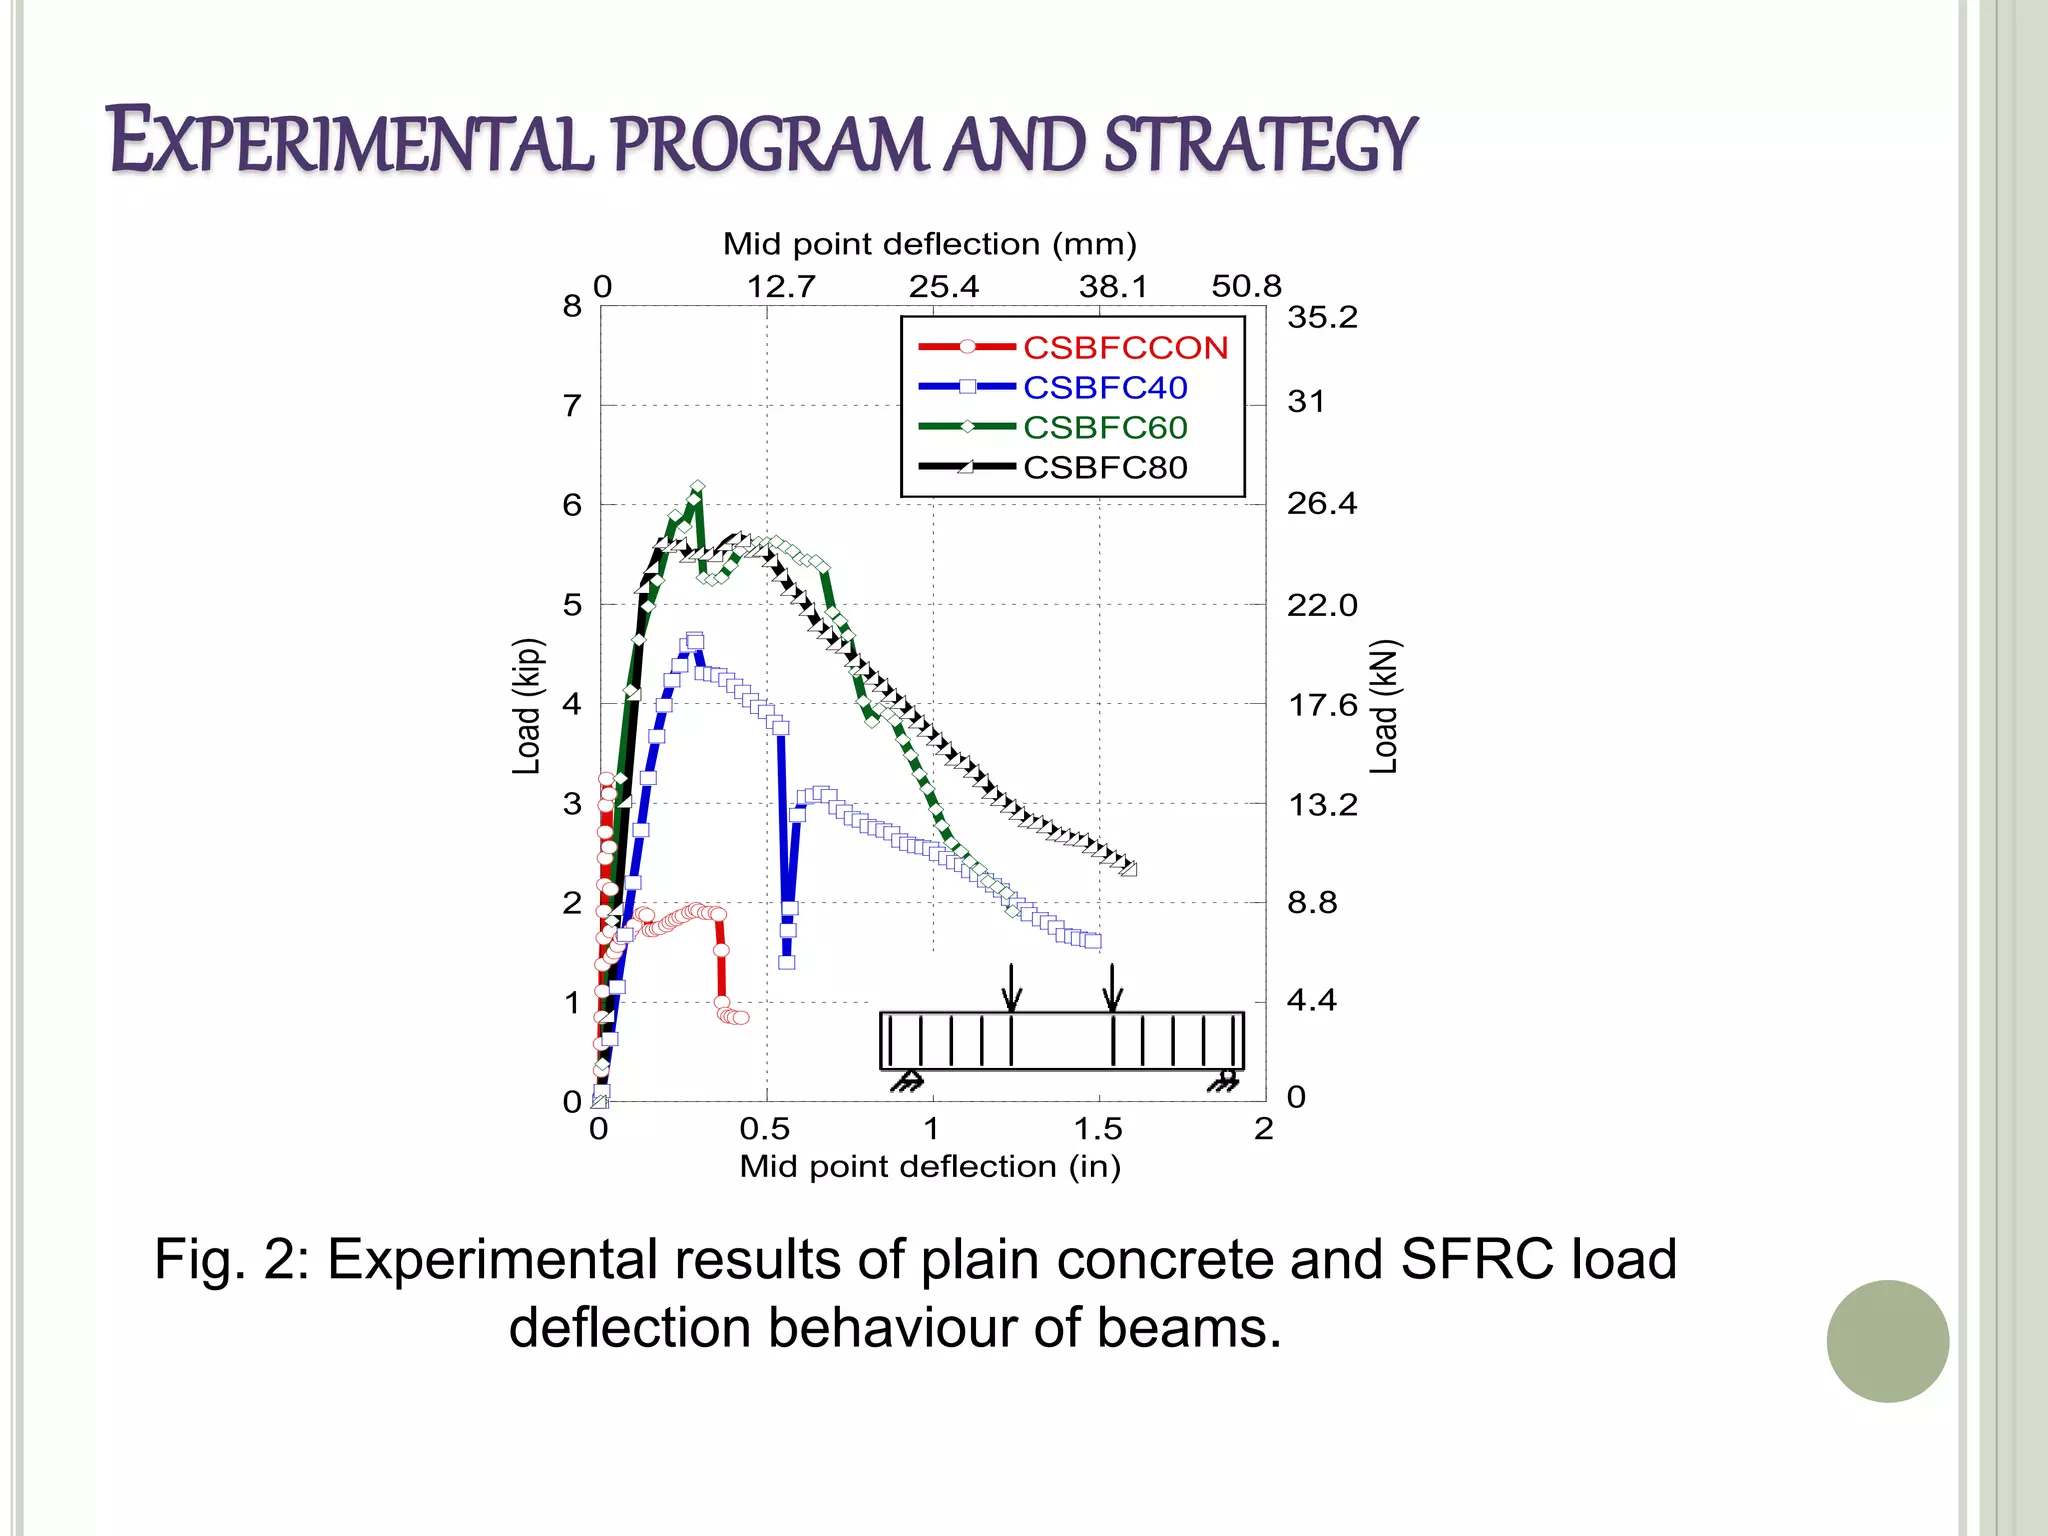
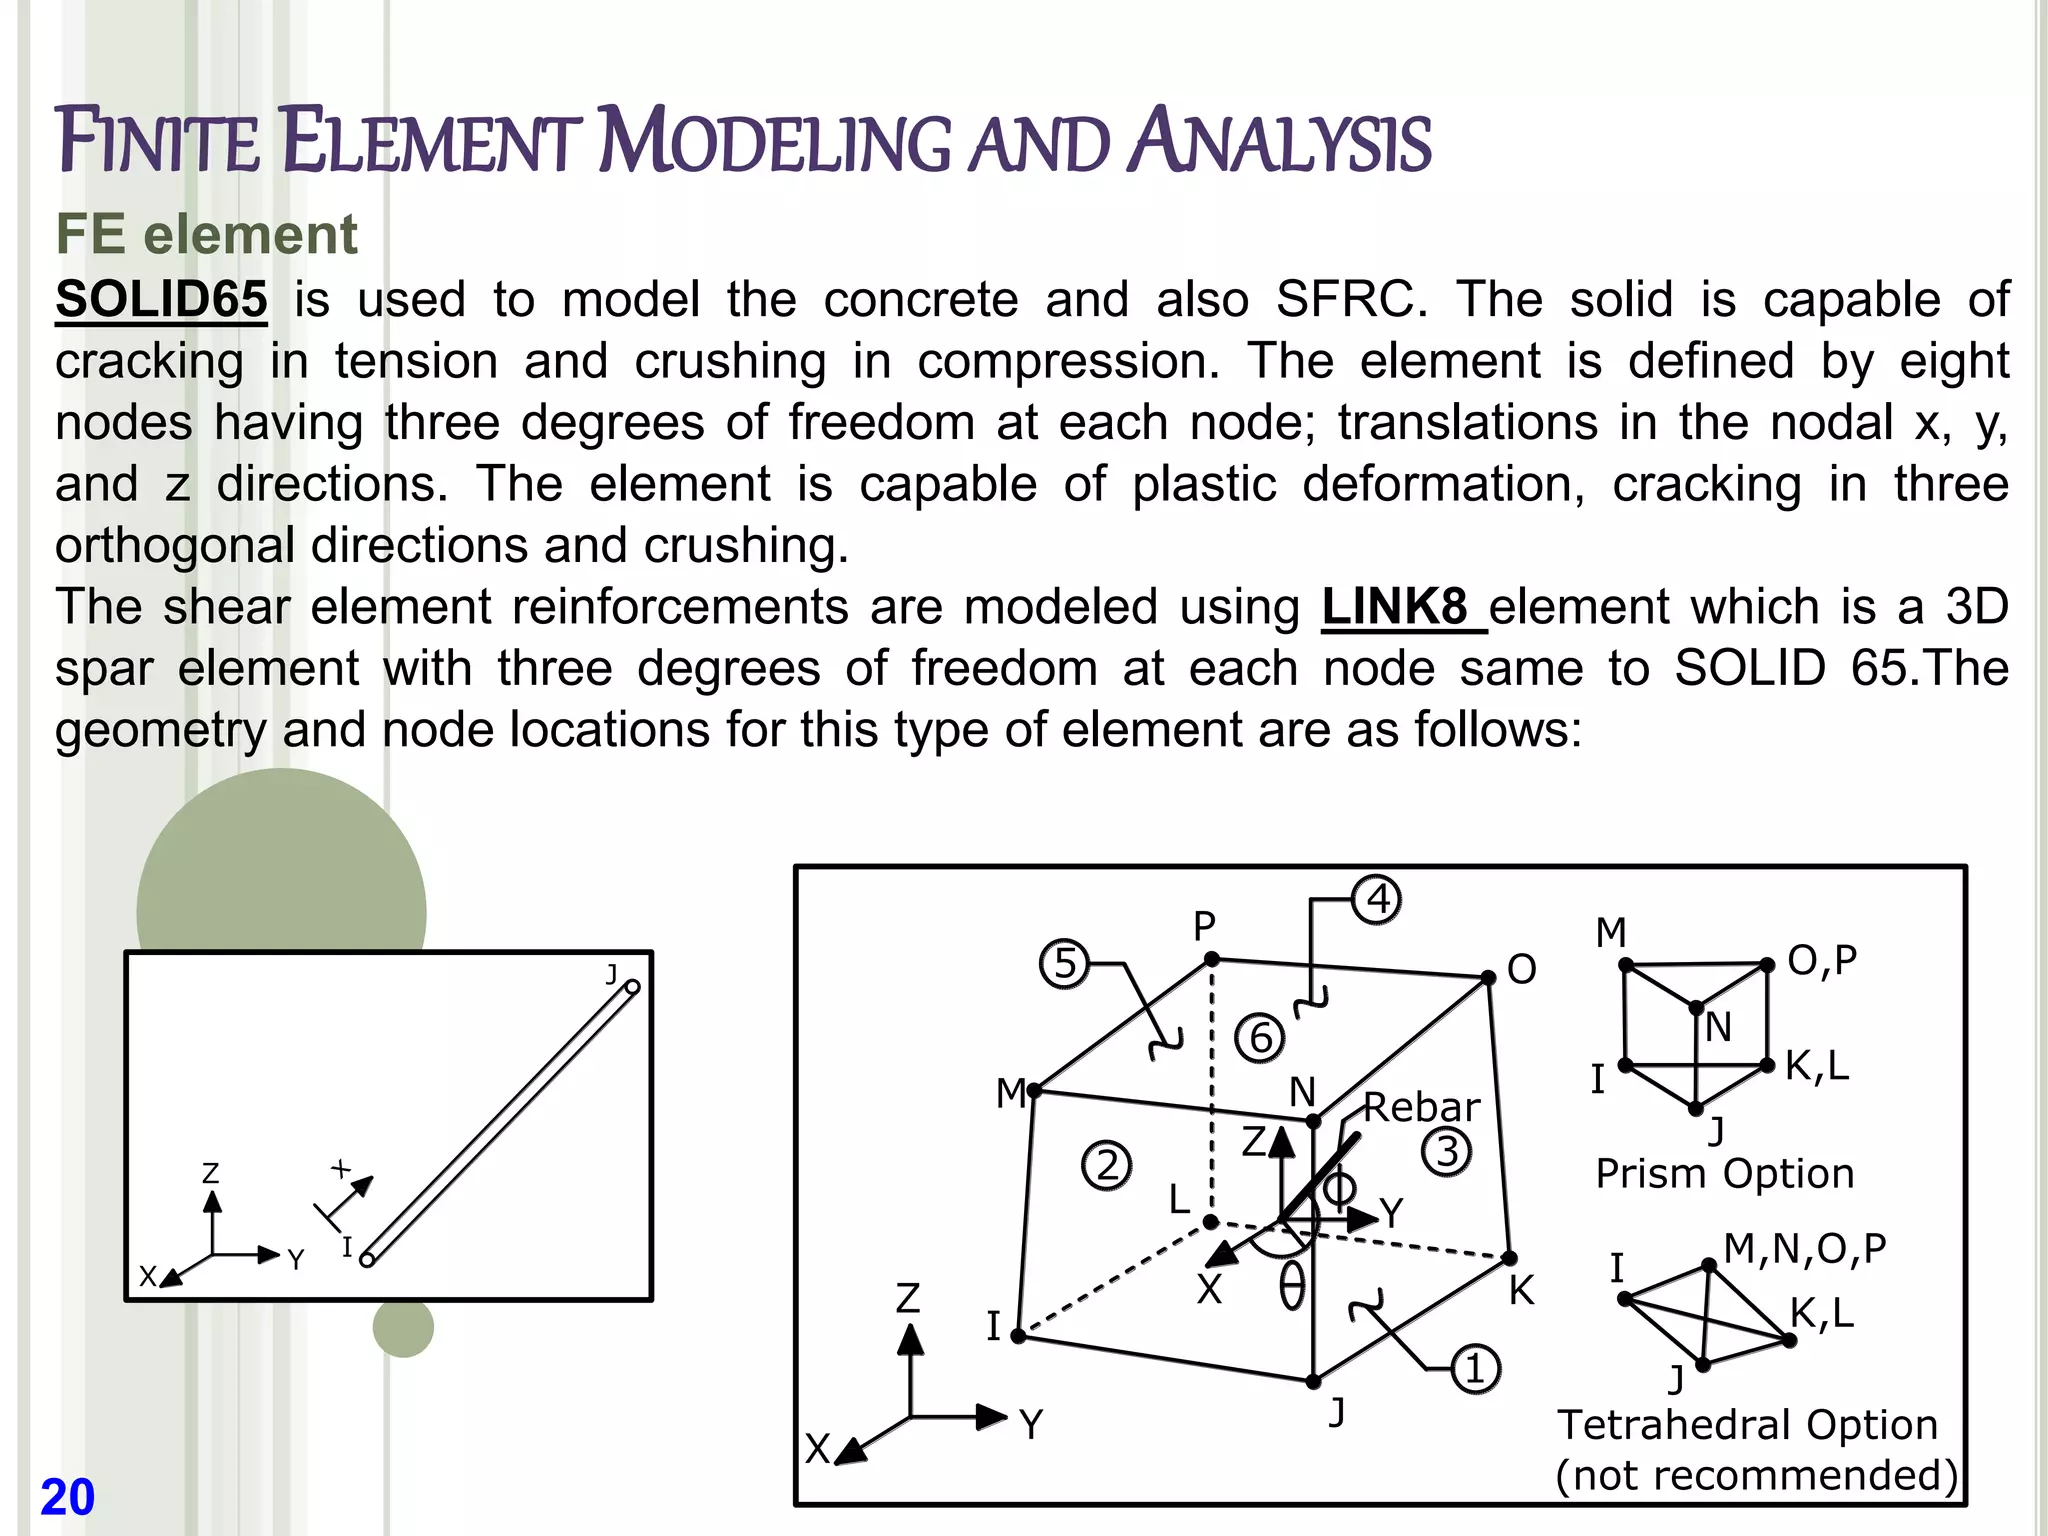
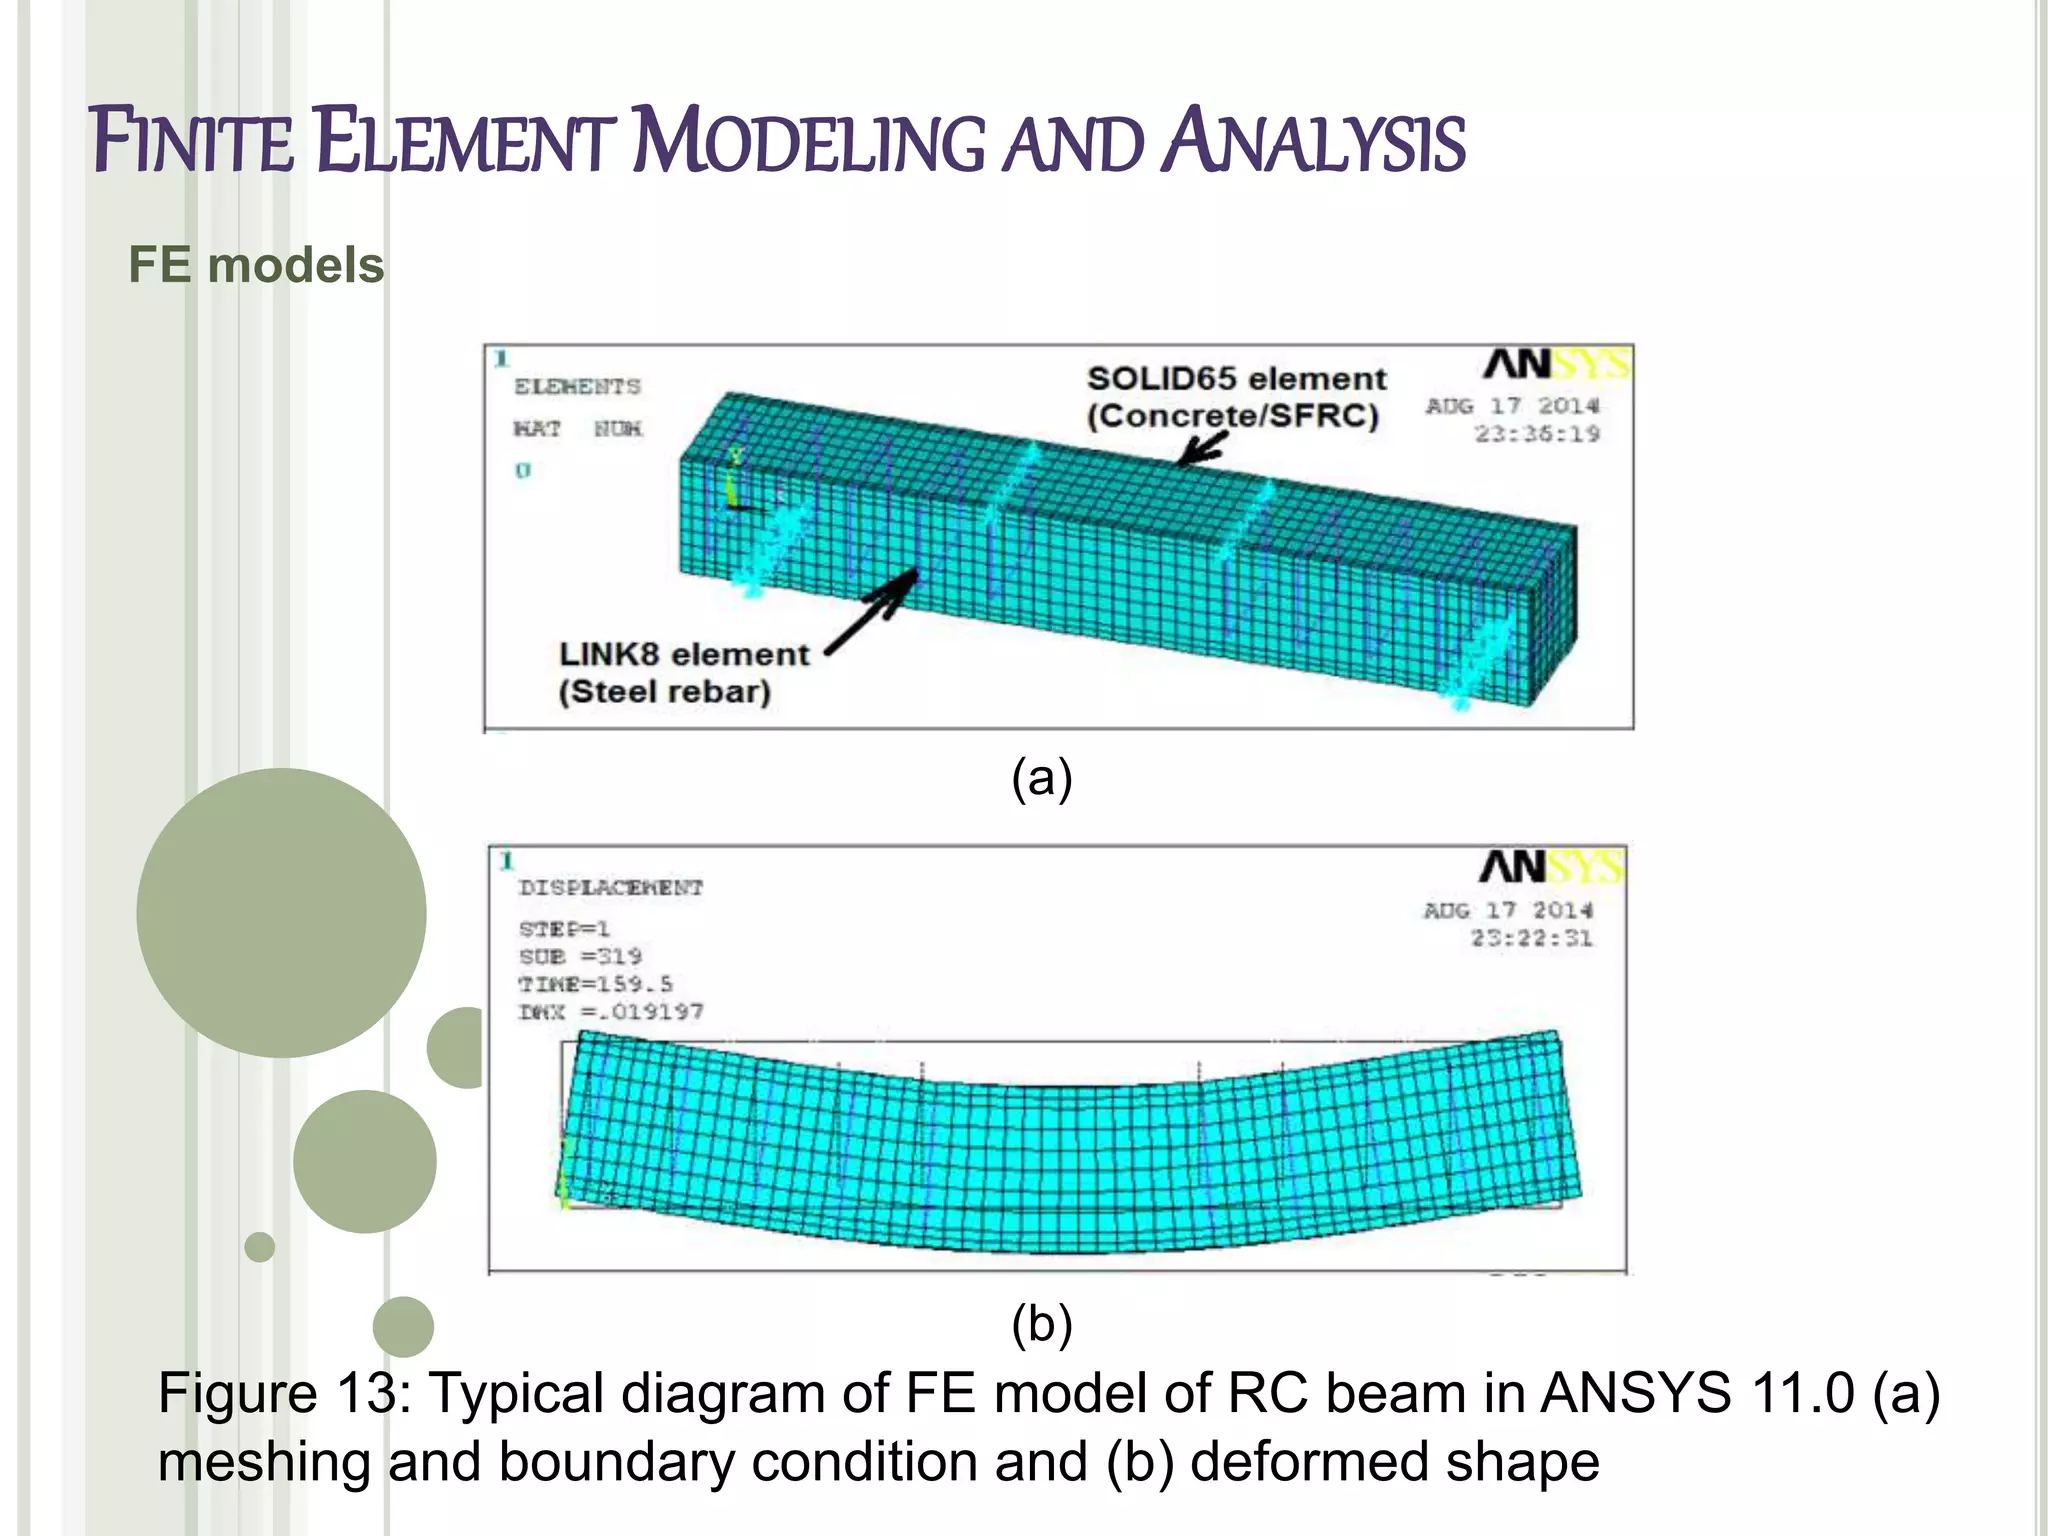
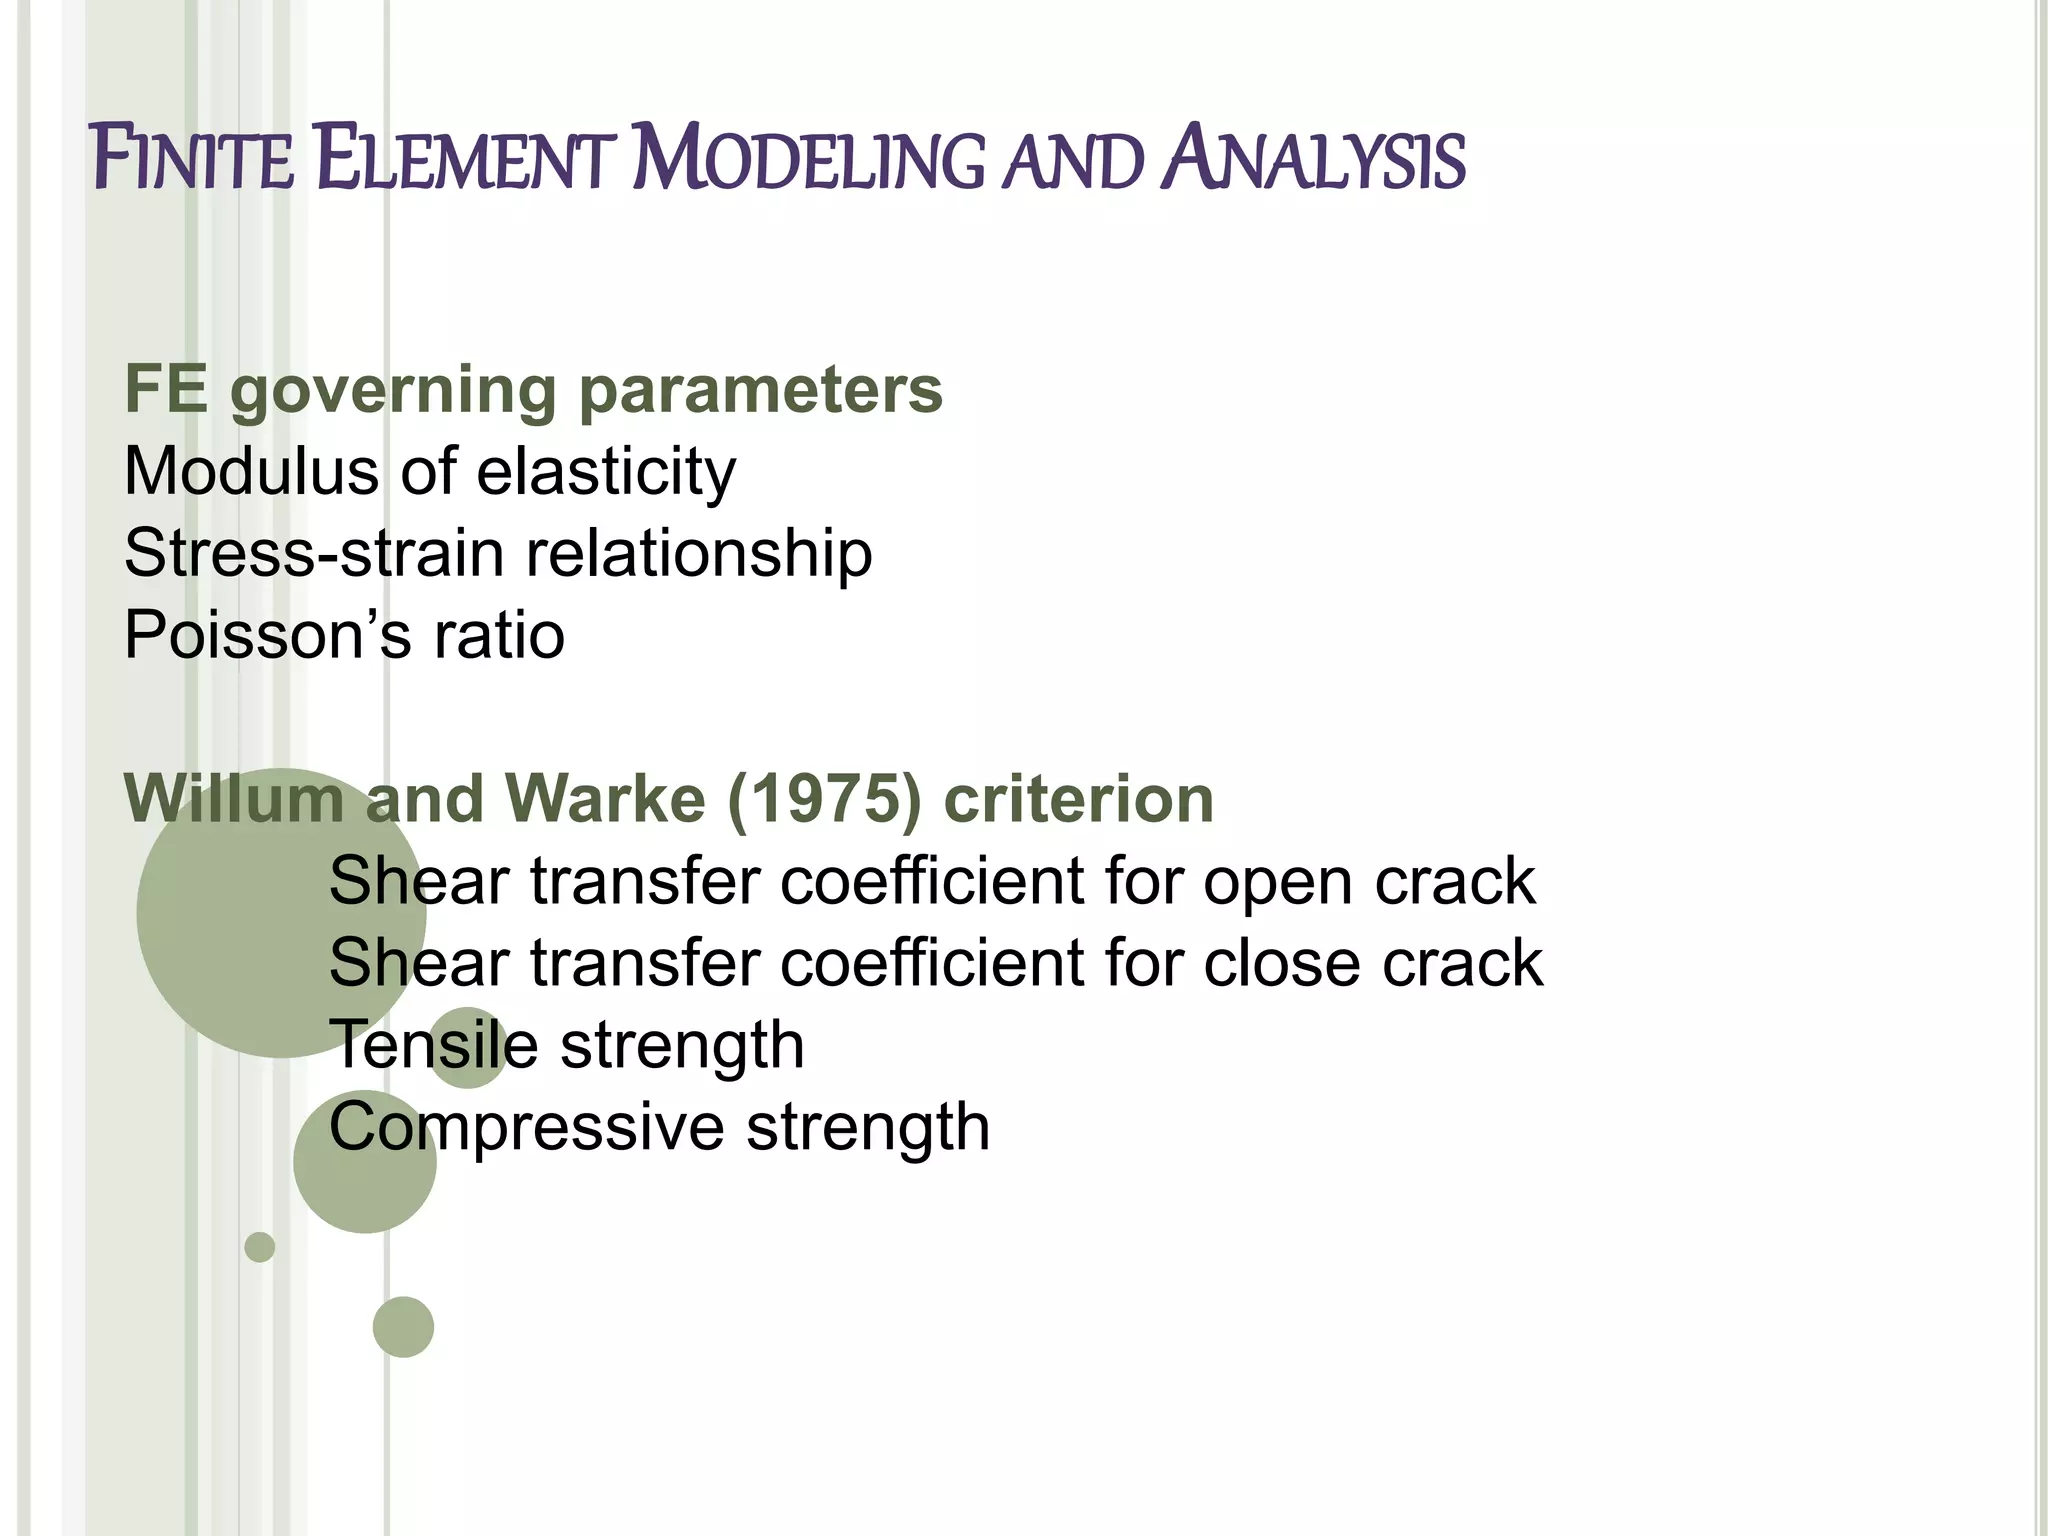
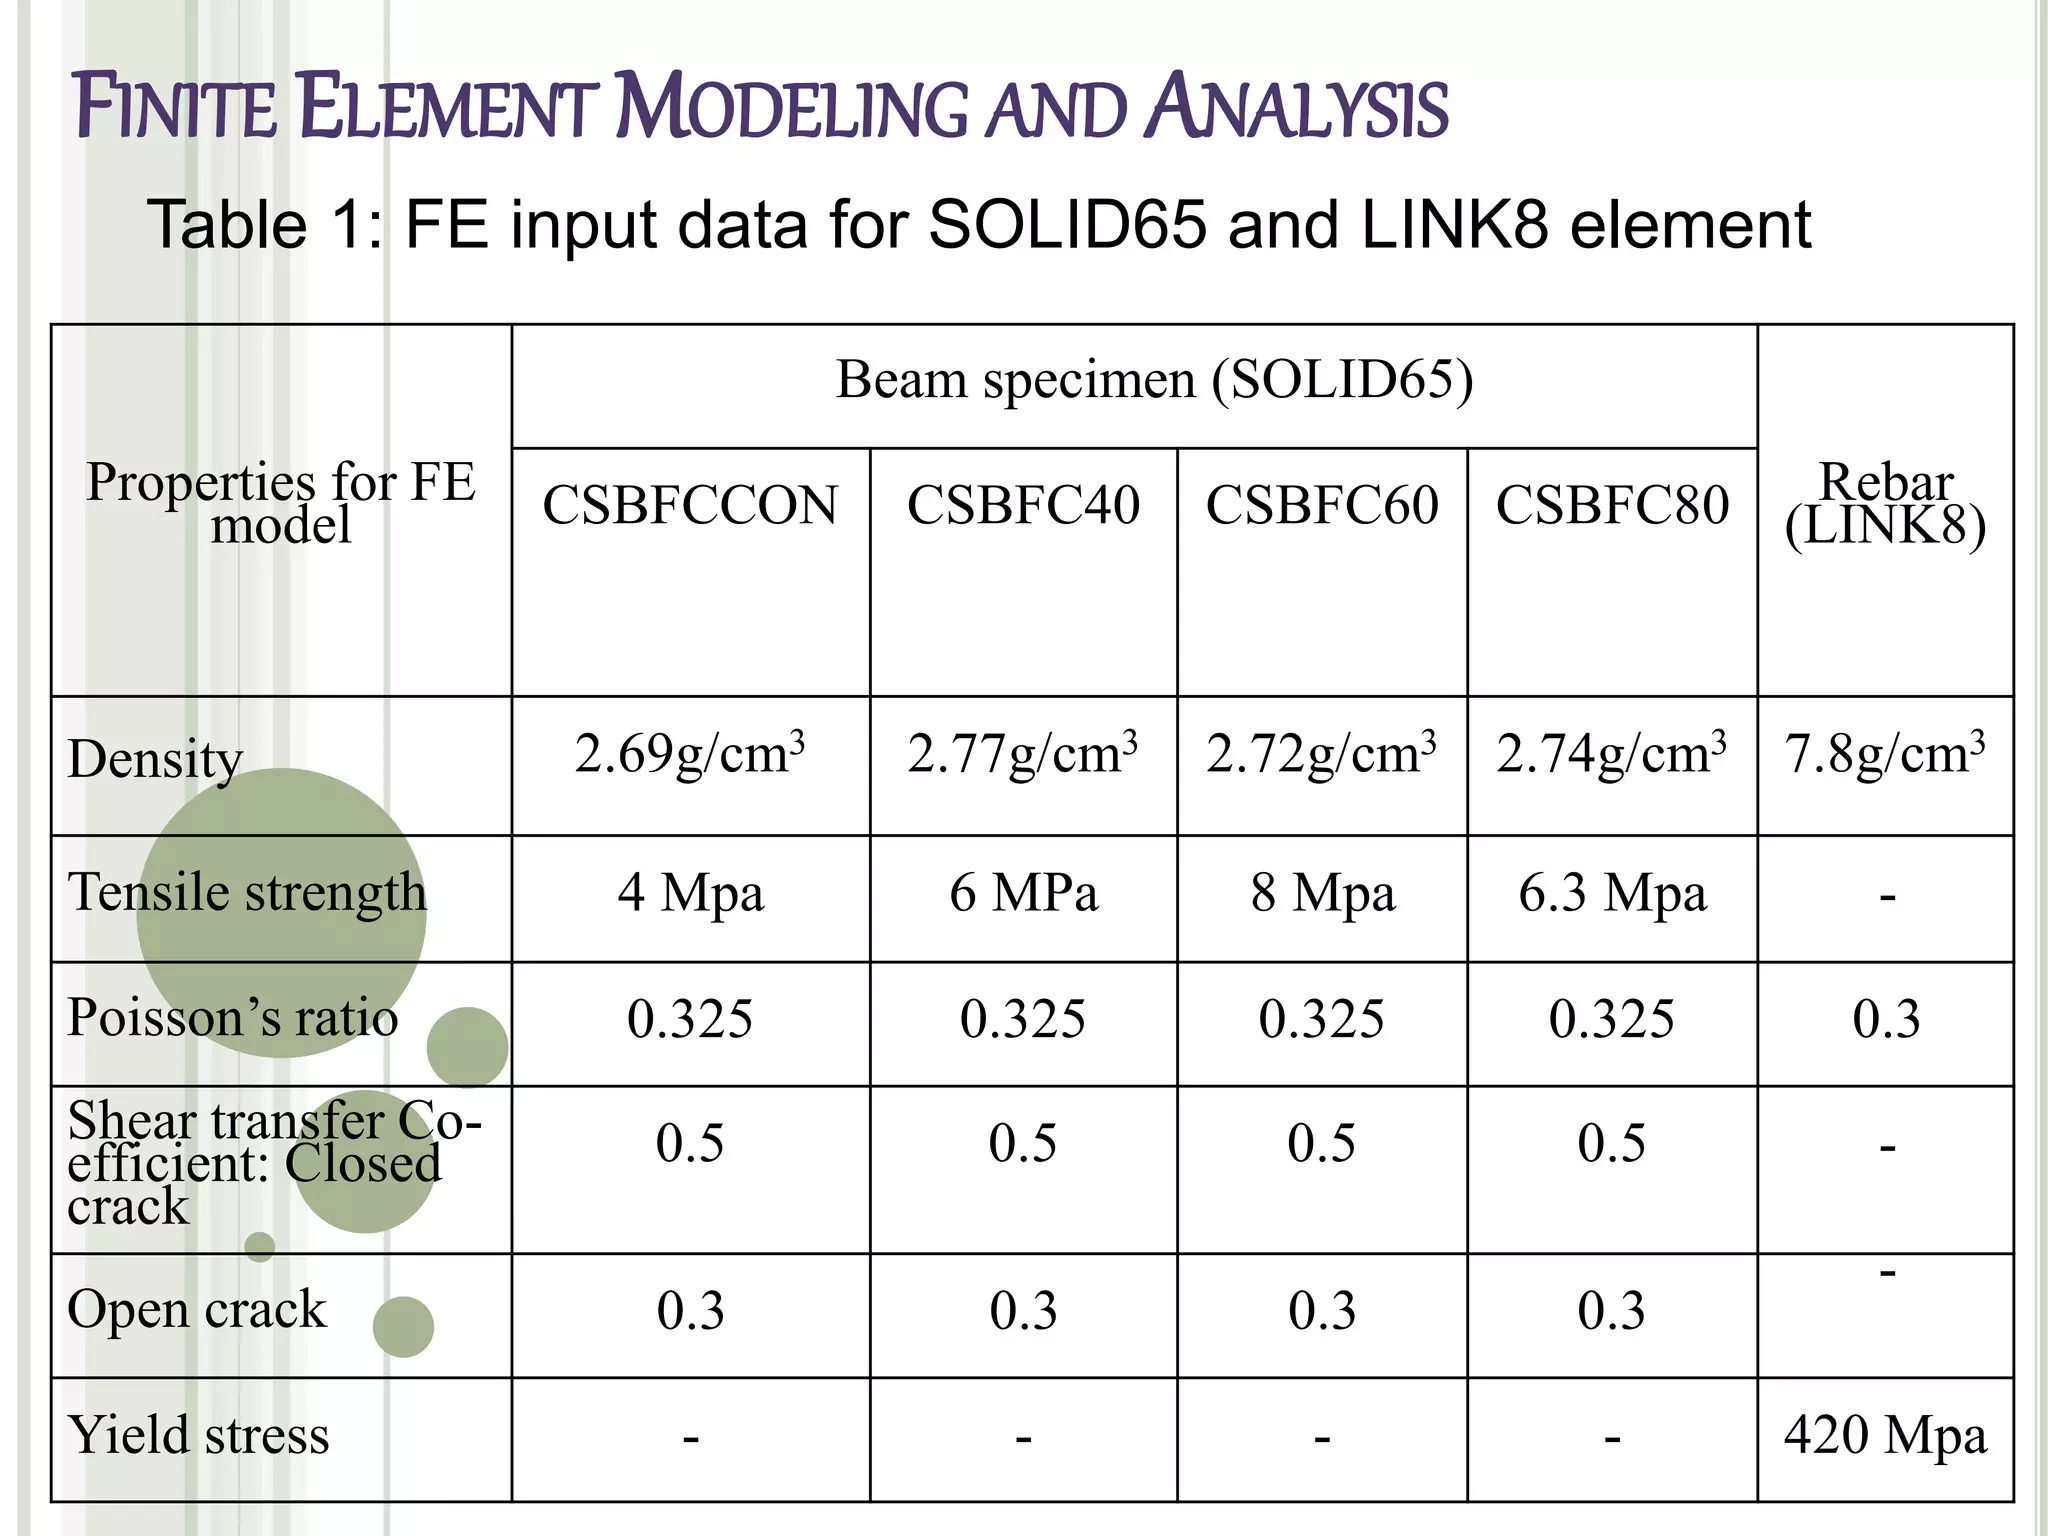
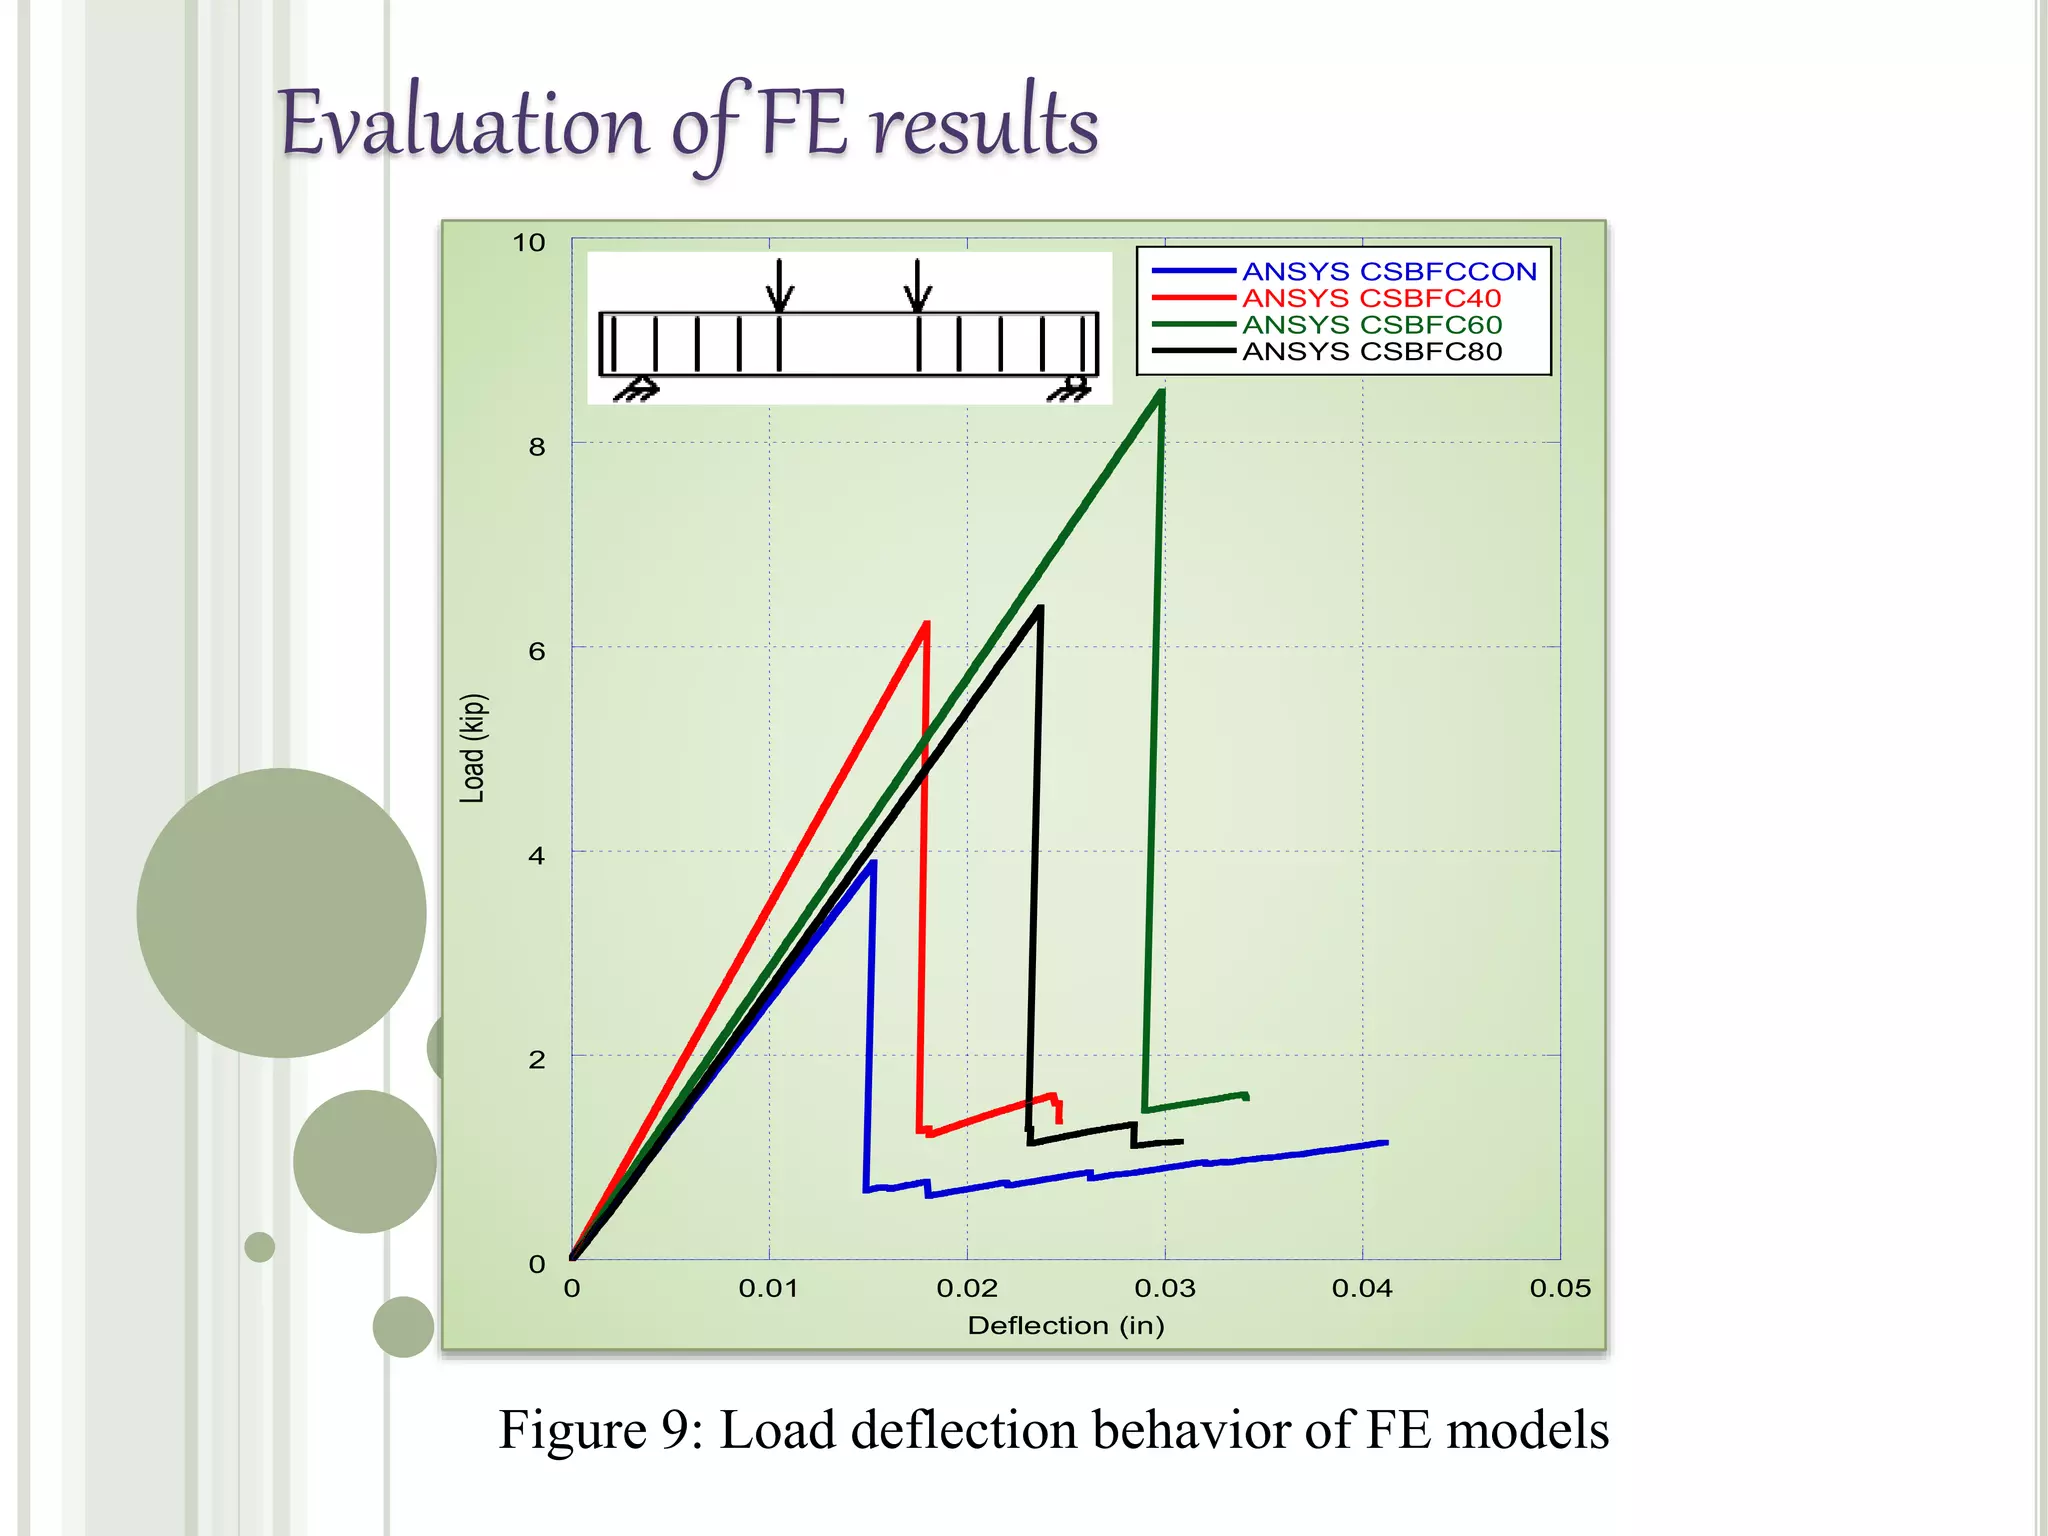
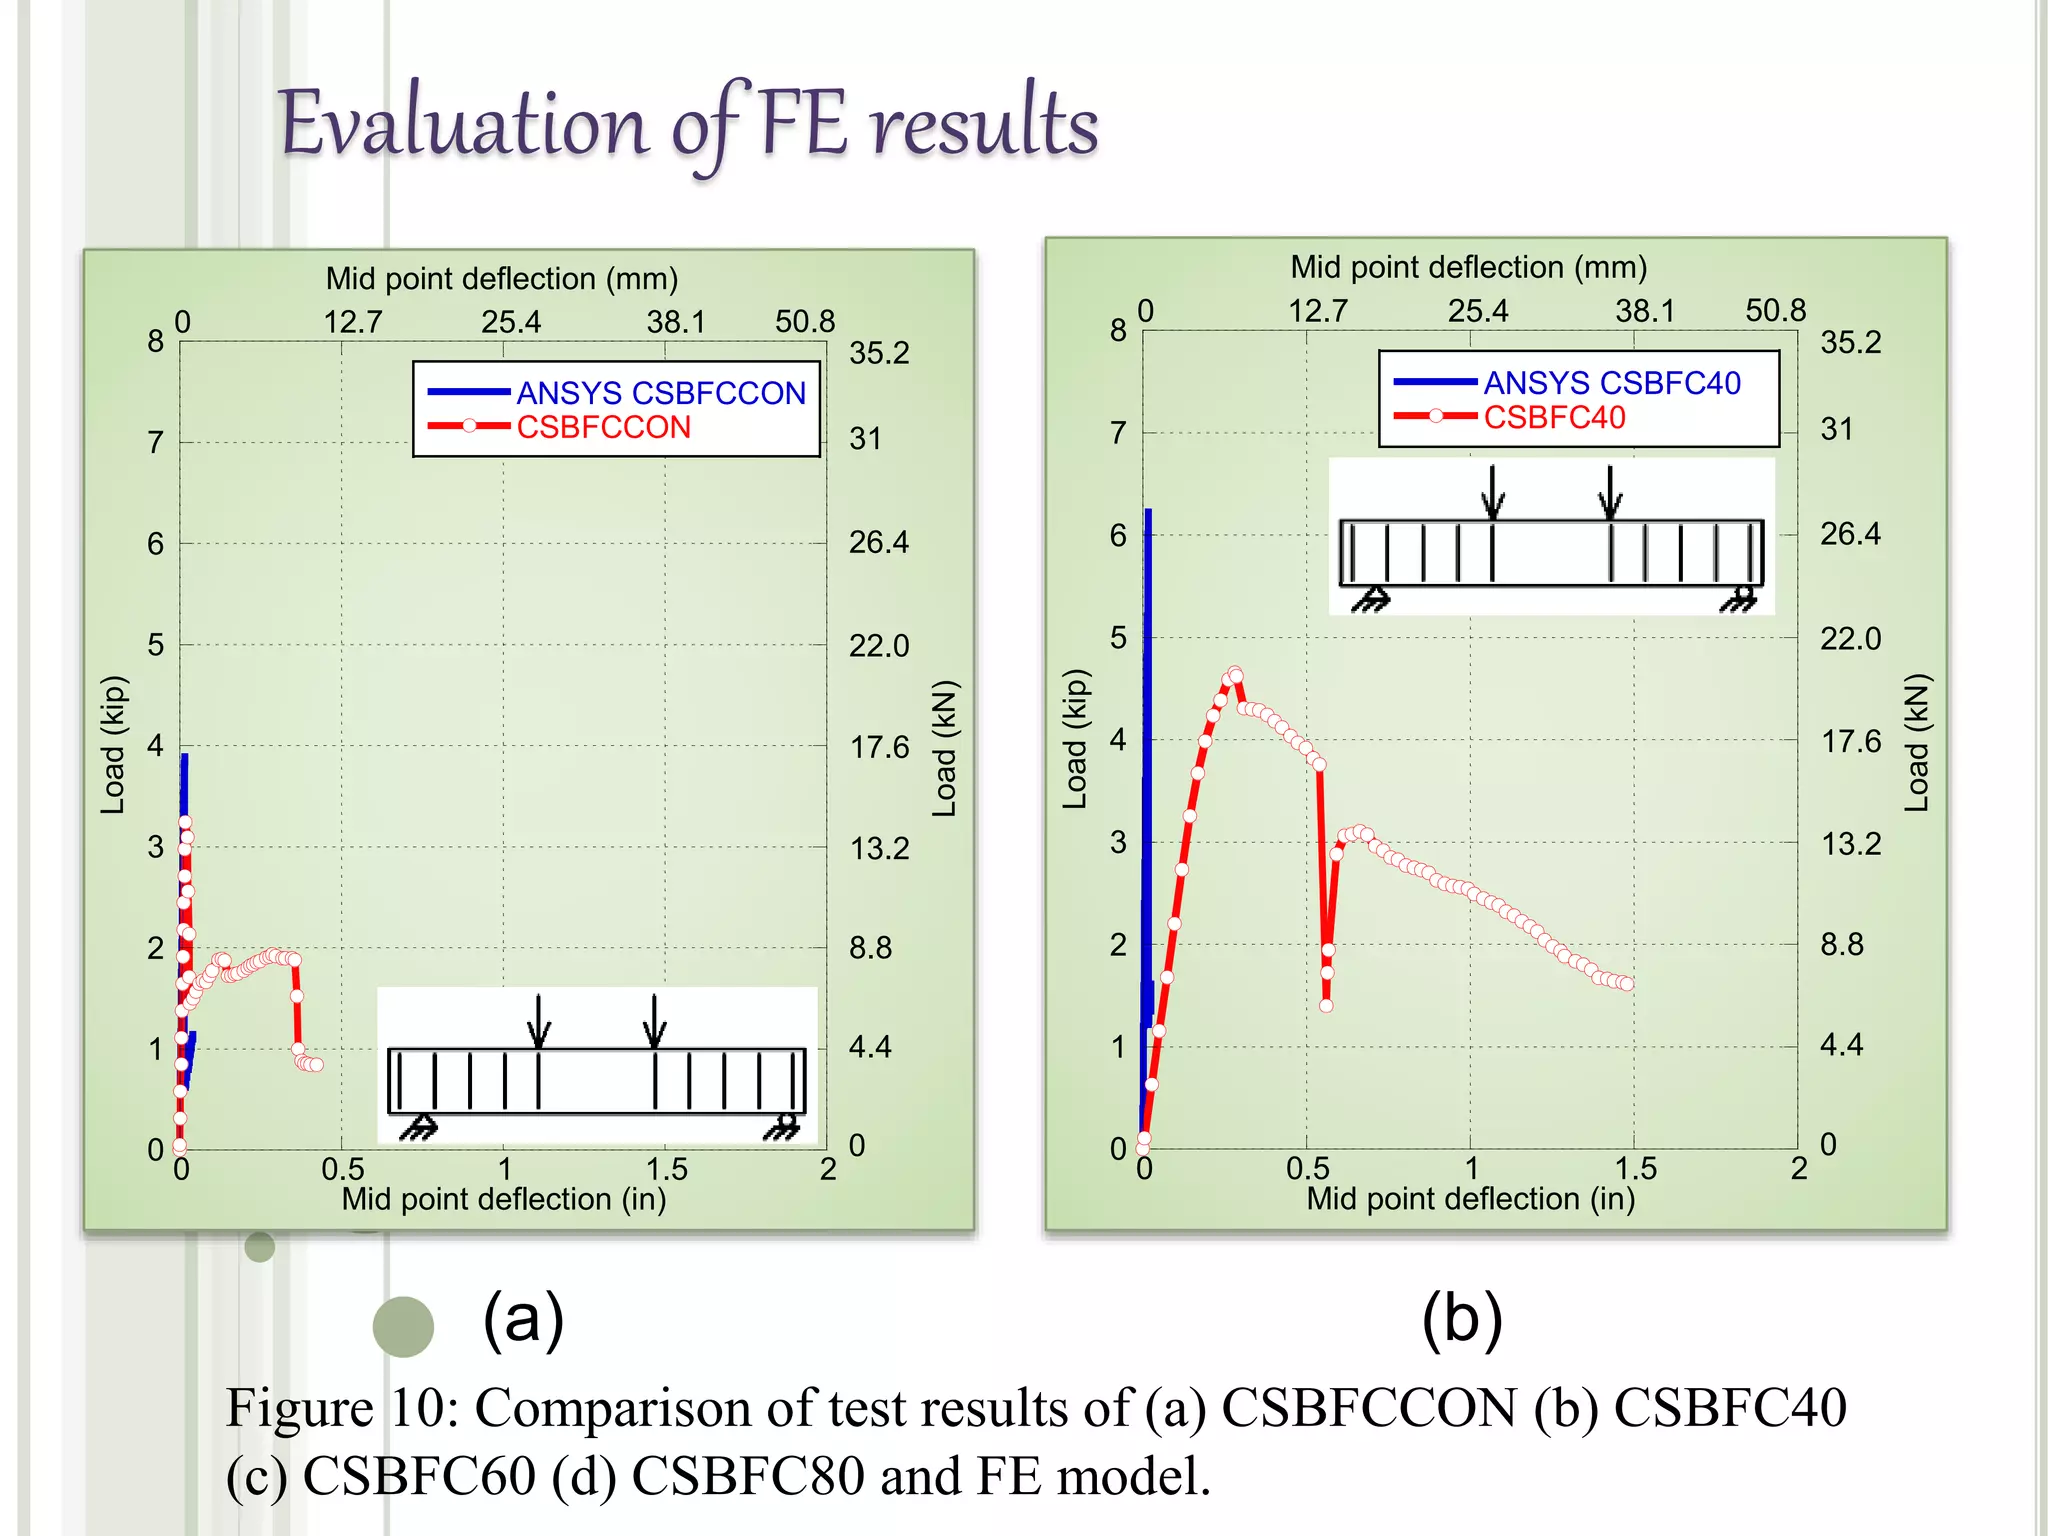
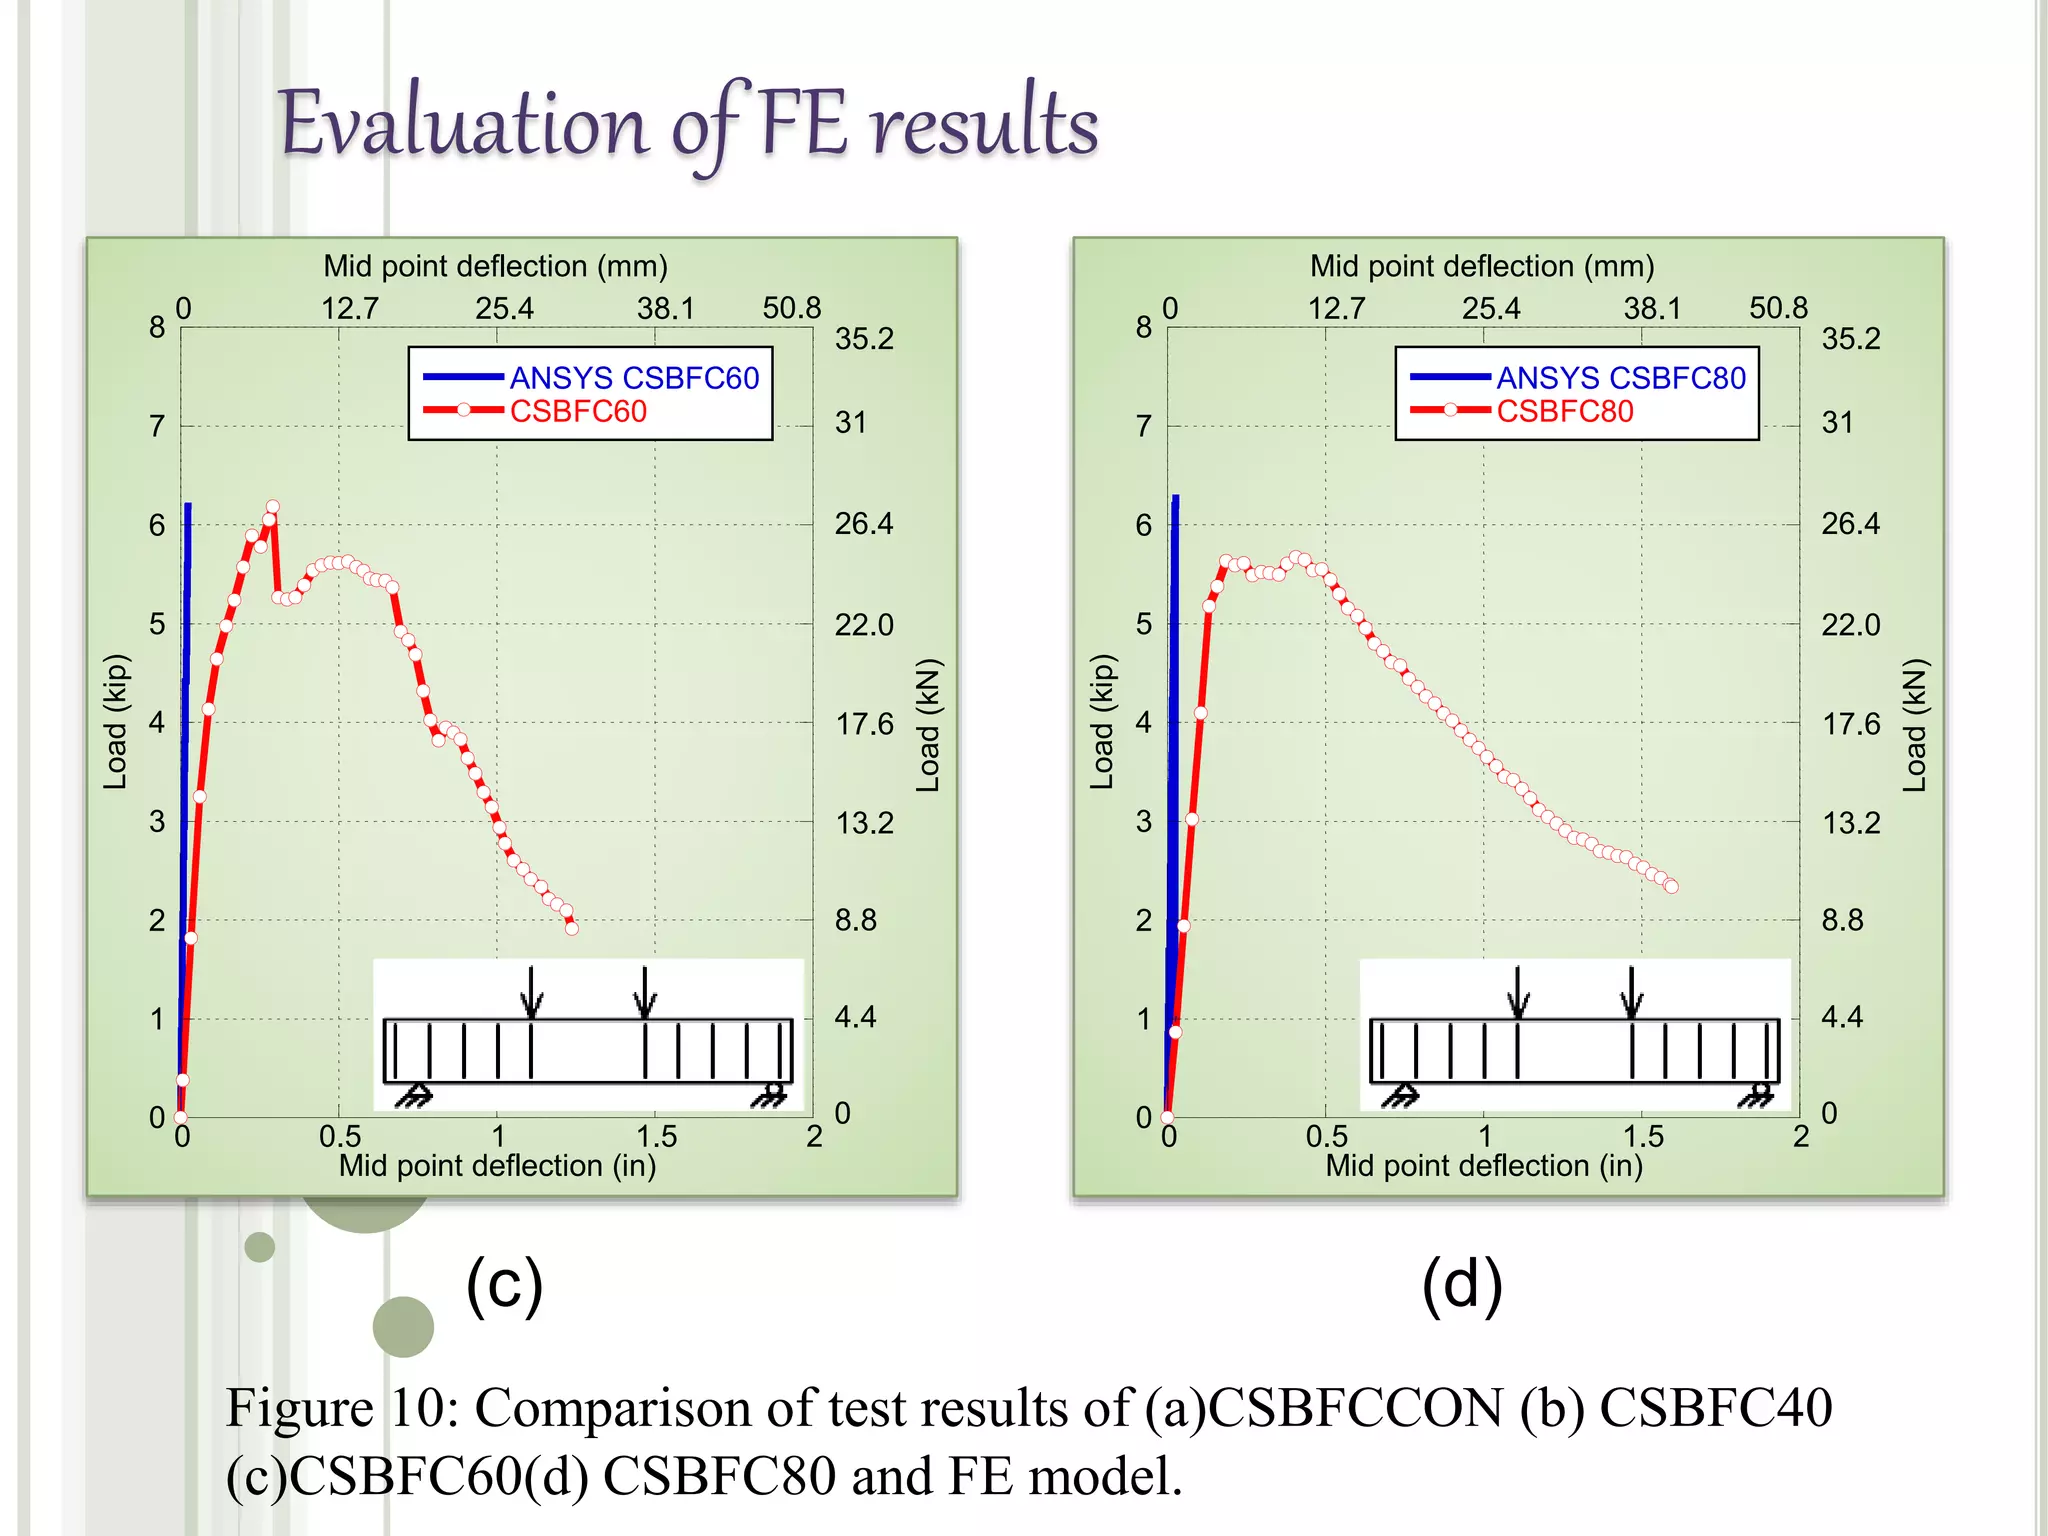
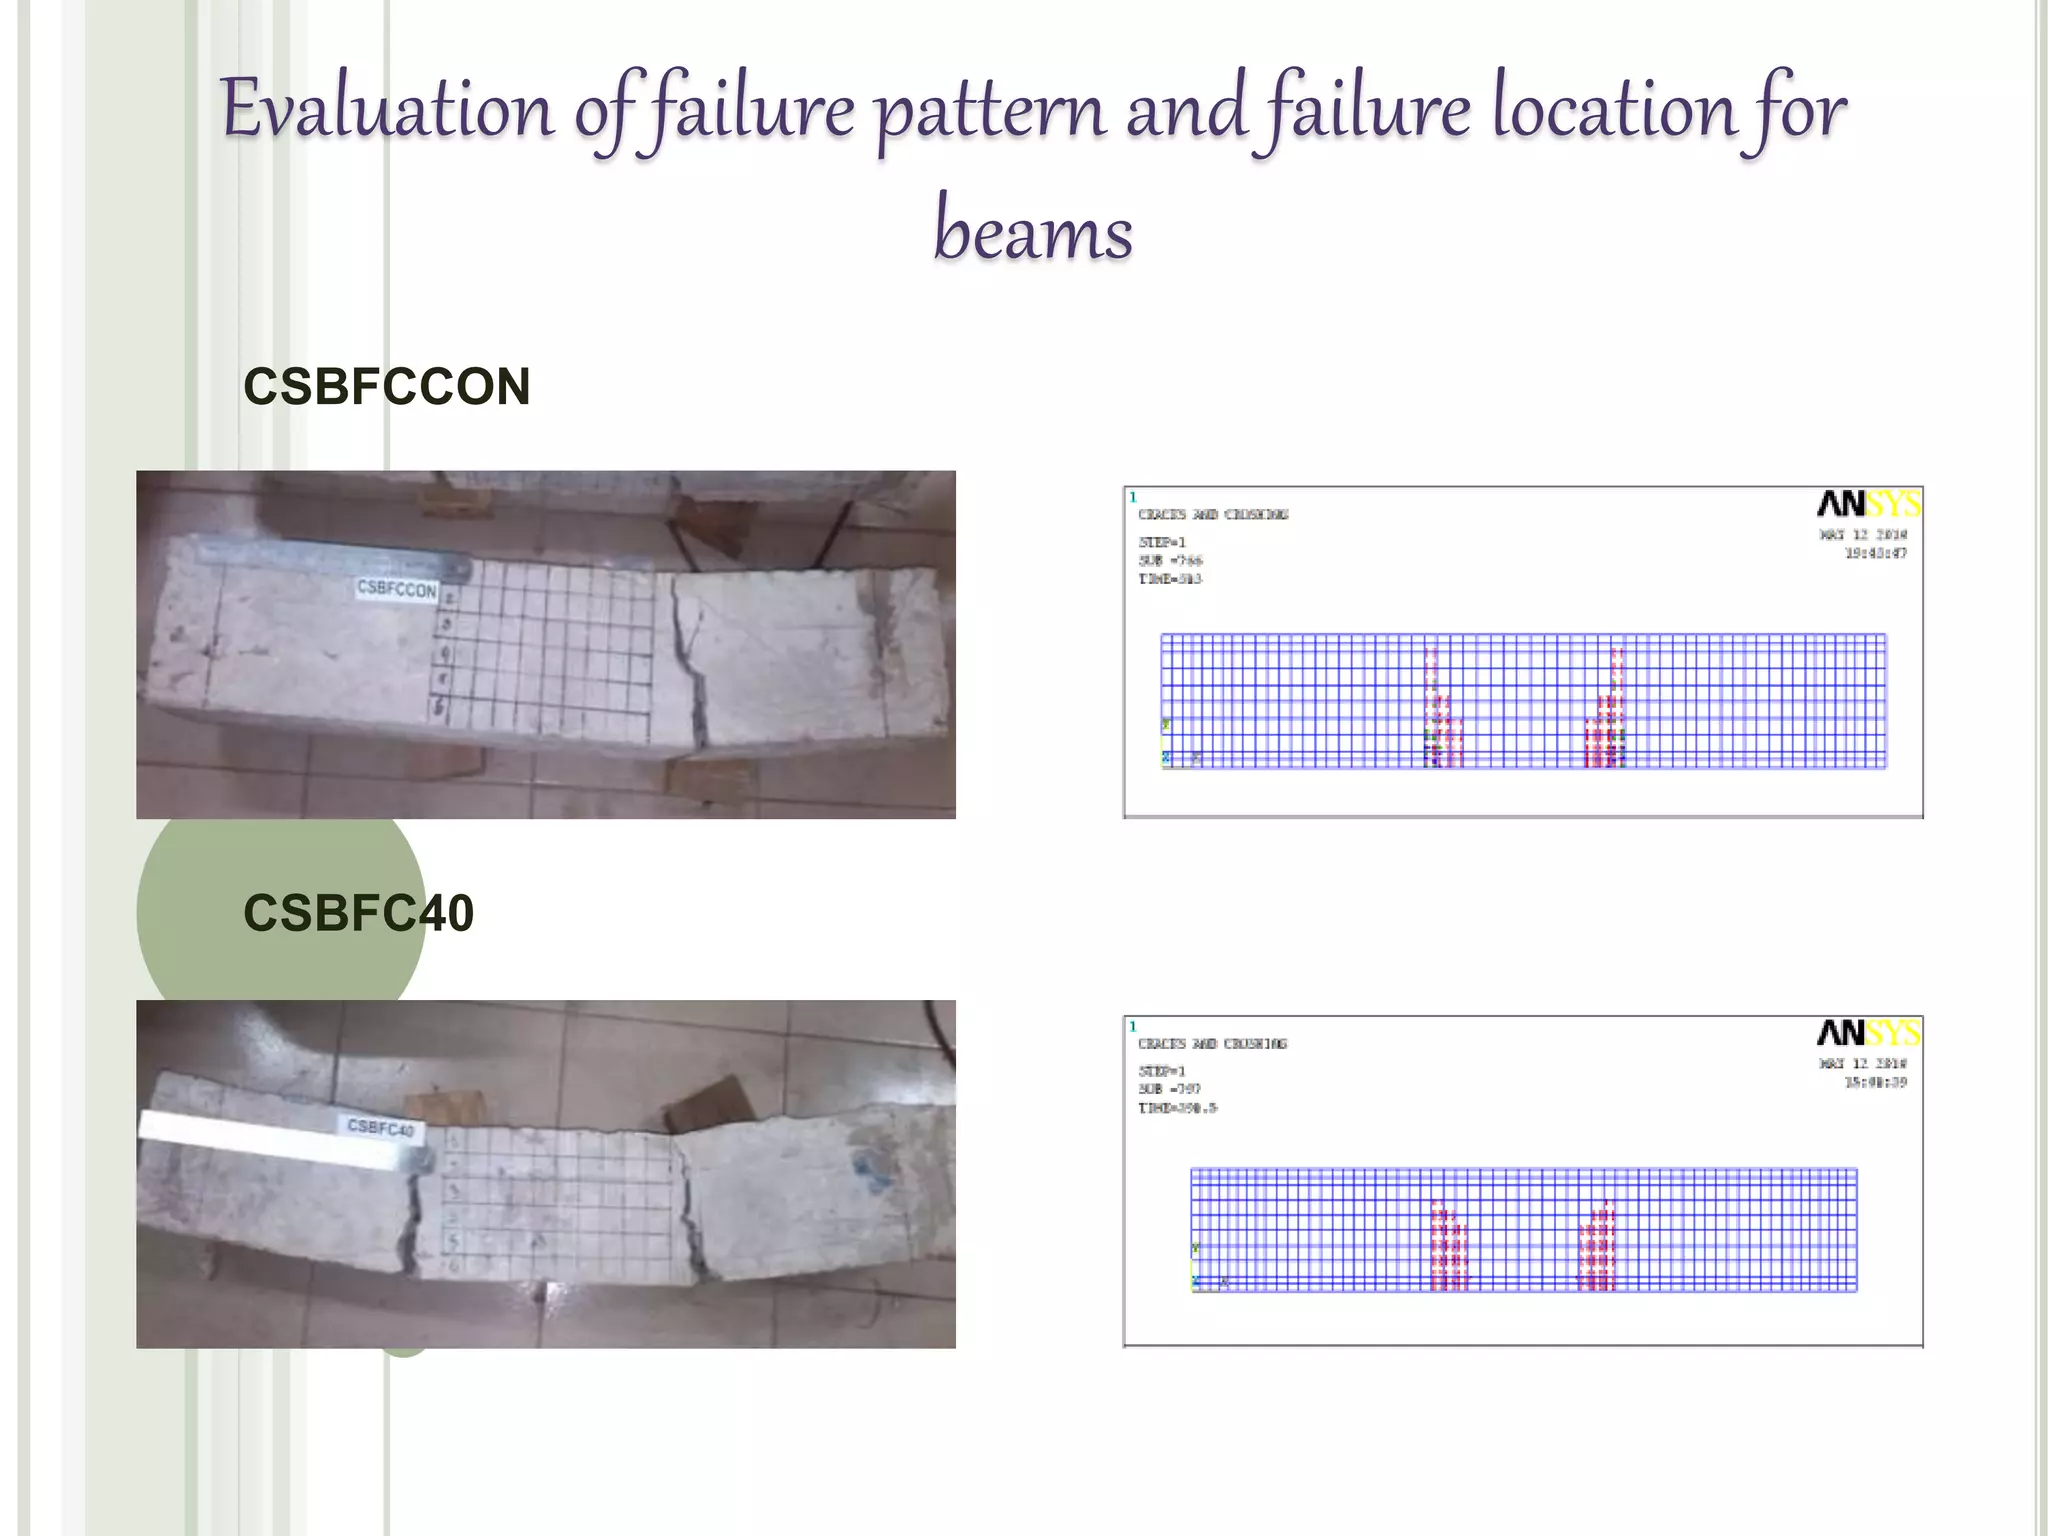
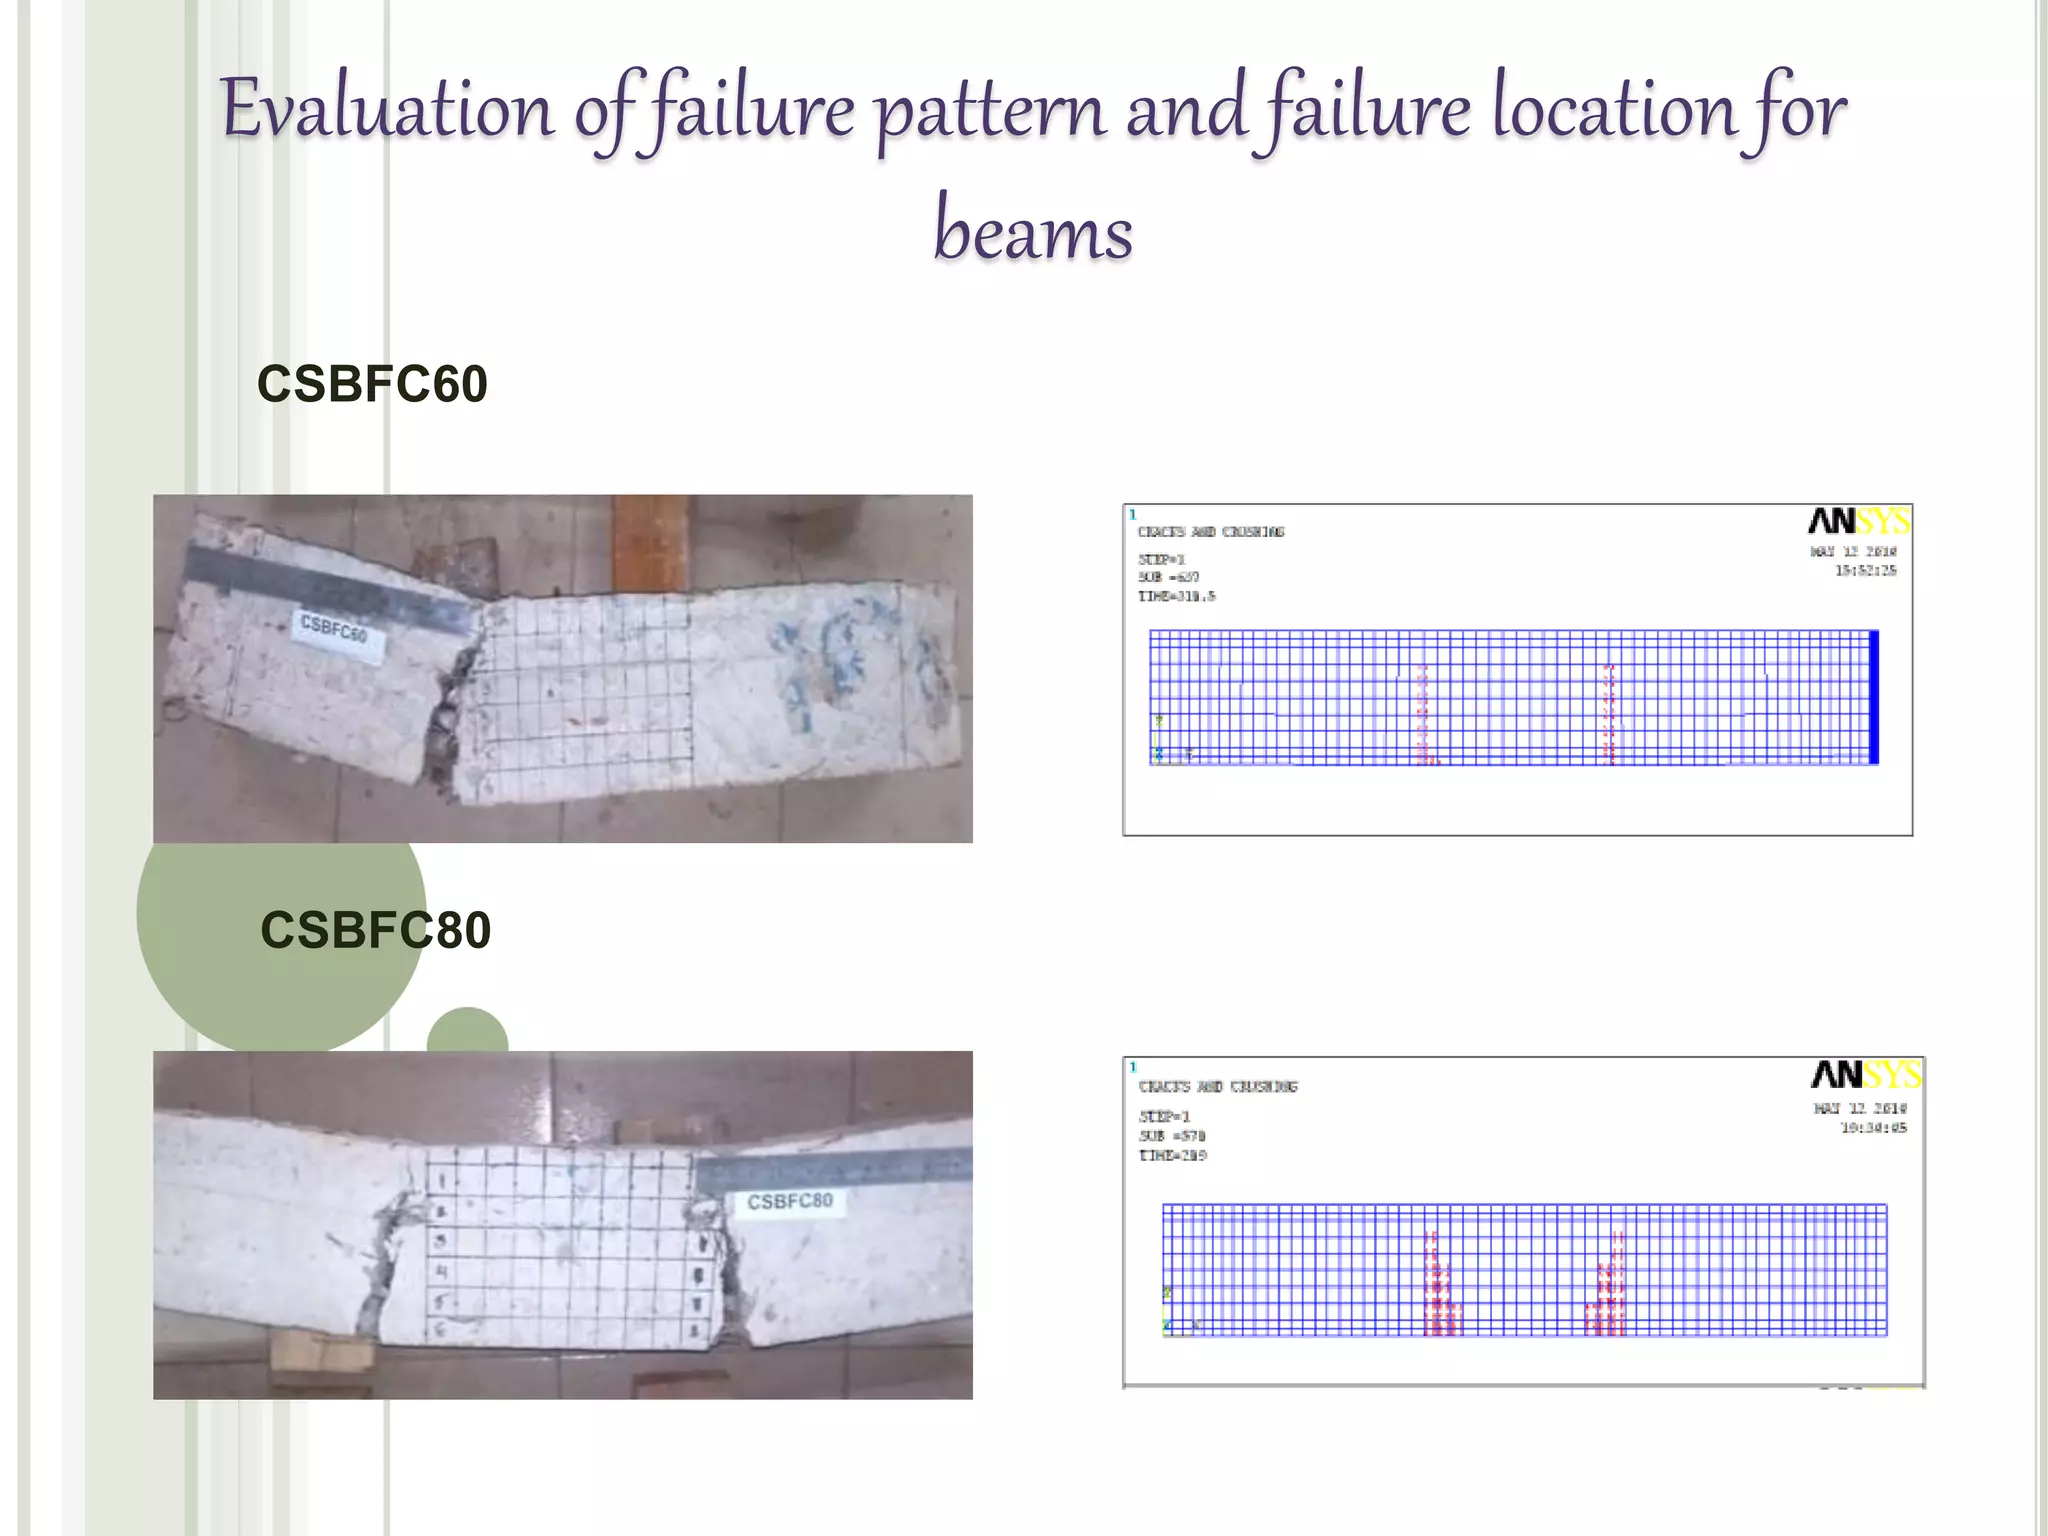


This document presents research on modeling the flexural capacity of steel fiber reinforced concrete (SFRC) beams. It describes an experimental program that tested RC beams with different steel fiber aspect ratios. A finite element analysis was conducted using ANSYS to model the beams. The FE models were validated by comparing their load-deflection behavior and failure patterns to the experimental test results. The research found that adding steel fibers increased the beams' compressive strength, tensile strength, flexural strength, and ductility. The validated FE models can help predict the performance benefits of using SFRC in construction.


