Financialization and Student Funding in Higher Education
1. Malte
Nyfos
Mathiasen
University
of
California
at
Berkeley
May
12,
2014
Professor
Neil
Fligstein
SOC
280Q
1
Financialization
and
Student
Funding
in
Higher
Education
Malte
Nyfos
Mathiasen
2. Malte
Nyfos
Mathiasen
University
of
California
at
Berkeley
May
12,
2014
Professor
Neil
Fligstein
SOC
280Q
2
Table
of
Contents
Abstract
..........................................................................................................................................
3
Introduction
.................................................................................................................................
4
Historical
brief
of
the
U.S.
field
of
Higher
Education,
1947-‐2010
..............................
5
Literature
review
........................................................................................................................
6
Detailing research design
...........................................................................................................
10
Research
question
...................................................................................................................
10
Variables
.....................................................................................................................................
10
Empirical
evidence
..................................................................................................................
12
Conclusion
..................................................................................................................................
17
Literature
...................................................................................................................................
18
Appendix
A
.................................................................................................................................
20
3. Malte
Nyfos
Mathiasen
University
of
California
at
Berkeley
May
12,
2014
Professor
Neil
Fligstein
SOC
280Q
3
Abstract
The paper investigates the relationship between types of higher educational in-
stitutions and student loans. It briefly reviews the expansion of higher education since
WW2 and captures other theories of welfare retrenchment and privatization of risk
around the Millennium, which argue for a substantial shift in, who and how actors pay
for higher education.
The paper explores the IPEDS dataset for 3.321 public, private non-profit and
private for-profit institutions for the period of 2000-11 and identifies that the increase
in student loans follows a general trend for the field of educational institutions, espe-
cially 4-year institutions and private for-profit institutions have steeply increased from
an average 4486 dollars to 9727.
4. Malte
Nyfos
Mathiasen
University
of
California
at
Berkeley
May
12,
2014
Professor
Neil
Fligstein
SOC
280Q
4
Introduction
Student
loans
are
becoming
a
huge
issue
in
the
United
States,
as
they
grow
and
disproportionally
are
turned
to
by
underprivileged
groups
and
students,
who
have
a
hard
time
repaying
their
education
after
graduation
and
getting
a
return
for
their
initial
investment
(Eaton
&
Stewart,
2013:
9f).
Arguments
have
been
made
that
student
loans
put
a
to
hard
burden
on
students
expectations
for
future
wages
and
do
not
reflect
the
realization
of
the
current
state
of
the
American
Dream
and
wage
premiums
after
graduation.
Though
the
wage
premium
make
it
costly
choice
also
not
to
aspire
for
the
college
premium.
Illustratively,
Rothstein
and
Rouse
find
that
the
college
wage
premium
from
1993
to
2005
rose
with
23
%,
as
the
tuition
fees
in
public
and
private
colleges
rose
by
63
%
and
43
%
(2011:
1)
In
this
competi-‐
tive
field
institutions
might
specialize
and
establish
niches
to
attract,
invest
in
and
profit
on
students.
Others
state
that
loans
are
a
necessary
precondition
for
educational
invest-‐
ments
and
competitive
advantages
among
other
states,
and
here
at
Berkeley
one
can
see
that
the
increase
in
student
loans
reflect
an
institutional
change
from
rela-‐
tive
inexpensive
or
free
education
funded
by
the
state
government
to
a
larger
eco-‐
nomical
burden
on
the
students
to
provide
their
own
funding.
This
is
what
Hackert
calls
an
individualization
of
risk,
where
the
system
of
higher
education
as
one
of
many
institutions
(another
example
is
the
pension
system
in
the
U.S.
case)
experi-‐
ence
a
shift
from
collective
utility
and
risk
to
an
individual
risk
(Hackert,
2004).
Higher education can also be considered a public good in the sense that it creates
positive externalities in forms of rising productivity and taxable income.
These
different
arguments
correspond
in
general
to
the
narratives
we
find
in
public
media
and
5. Malte
Nyfos
Mathiasen
University
of
California
at
Berkeley
May
12,
2014
Professor
Neil
Fligstein
SOC
280Q
5
scholarly
approaches
emphasizing
how
finance
disciplines
borrowers
(Rajan,
2011)
and
reshapes
citizens
(Davis,
2009)
in
the
subfield
of
education
and
with
in-‐
dividual
impact
for
a
long
period
after
graduation.
Yet
it
is
not
so
well
theorized
how
increasing
tuition
fees
and
student
loans
coincide
with
changes
in
the
field
of
higher
education
and
emergence
of
financiali-‐
zation.
Most
have
been
written
in
the
field
of
economy,
and
more
is
needed
on
how
the
actors
interact,
and
loans
and
finance
rewrite
the
meaning
of
higher
education.
Another
interesting
next
step
would
be
to
compare
student
loans,
other
household
loans
and
financialization
of
higher
education
internationally
and
situate
it
in
the
literature
of
varieties
of
capitalism
(Hall
&
Soskice,
2001),
because
there
are
large
variation
in
different
types
of
debt,
e.g.
there
are
Scandinavian
and
European
coun-‐
tries
with
huge
housing
debt
but
little
student
debt
that
complicates
a
straightfor-‐
ward
theory,
where
varieties
of
capitalism
could
explain
the
variation.
Instead
in
this
paper
I
emphasize
the
U.S.
and
dynamics
at
a
state
level.
Through
the
paper
I
aim
to
explore
the
mechanism
that
links
financialization
and
student
loans,
and
how
it
impacts
different
types
of
institutions
and
students.
Historical
brief
of
the
U.S.
field
of
Higher
Education,
1947-‐2010
The G.I. bill with its benefits for WW2 veterans launched the educational boom in the
U.S. in the period of 1947-65. With The Great Society program President Johnson
addressed poverty and racial injustice in 1965 but also tripled the funds for higher ed-
ucation and made a centralized funding metric to allocate the resources, instituting the
federal government as a central player across the variation from different states. In
1972 President Richard Nixon expanded the grant and loan system and established the
precondition for the today’s funding system. The system had a clear division between
grants and loans and worked as a voucher system, where individual students had a
6. Malte
Nyfos
Mathiasen
University
of
California
at
Berkeley
May
12,
2014
Professor
Neil
Fligstein
SOC
280Q
6
right to access and direct federal and state level subsidies often mediated through edu-
cational institutions, private accredited agencies and private-public businesses, such
as the loan agency Sally Mae (Eaton et al., 2014: 8f).
Literature
review
I
believe
Polanyi
and
Granovetter’s
theory
of
embeddedness
is
an
adequate
starting
point
to
explain
how
state
and
nation
play
an
evident
and
clearly
embed-‐
ded
role
in
the
market
of
student
loans
and
are
pivotal
for
valuing
the
price
and
in-‐
terest
rate
of
student
loans.
The
case
of
student
loans
can
with
the
terminology
from
Fligstein
and
McAdam
(2011)
illustrate
a
strategic
action
field,
where
domi-‐
nating
interests
of
finance
has
contributed
to
the
current
student
distribution,
and
influences,
who
and
how
students
are
educated
and
dispose
over
their
further
work
life.
In
this
broad
perspective
we
might
also
expect
student
loans
to
coincide
with
lower
subsidies
for
universities
and
alternative
payment
possibilities
than
through
parental
saving.
The
definition
of
financialization
as
a
dual
process,
where
public
actors
contest
and
imitate
finance
as
the
dominant
actor,
can
be
helpful
to
understand
emergence
of
new
actors
and
partnerships,
institutional
norms,
per-‐
ceptions
and
regulations
(Scott,
1995).
Based
on
the
above
assumption
and
the
in-‐
troduction
one
might
make
some
preliminary
characterization
about
who
the
in-‐
debted
students
in
the
field
of
education
are
and
how
they
provide
the
ongoing
cash
flow:
A)
Increased
dependence
on
loans
through
financial
channels
is
associat-‐
ed
with
a
decline
of
1)
not
indebted
students
and
2)
students
from
lower
socioeconomic
background.
7. Malte
Nyfos
Mathiasen
University
of
California
at
Berkeley
May
12,
2014
Professor
Neil
Fligstein
SOC
280Q
7
B)
Student
loans
are
affected
by
state
and
federal
embeddedness
and
po-‐
litical
will
to
differentiate
the
cost
and
investment
of
higher
education
and
diversify
control
to
private
actors
in
the
immediate
past.
New
institution-‐
al
actors,
who
can
balance
student
tuition
and
expenses
differently,
will
therefore
attract
different
subsamples
of
the
student
population.
Another
important
matter
is
that
the
division
between
public
and
private
interest
and
agency
often
is
overstated.
Higher
education
is
a
prominent
case,
where
business
and
public
community
create
value
and
cooperate.
A
larger
in-‐
volvement
of
finance
and
business
need
to
be
carefully
comprehended,
and
if
my
hypothesis
that
student
loans
is
associated
with
decline
from
lower
socioeconomic
background,
turns
out
to
be
true,
the
socioeconomic
consequences
of
indebtedness
can
be
disclosed.
By
attentive
studying
the
different
types
of
institutions
we
might
explore
a
contin-‐
uum
in-‐between
public
and
private
education
that
can
reflect
how
the
pattern
of
educational
institutions
over
time
evolve.
Lin
and
Tomaskovic-‐Devey
(2013:
1291)
argue
that
financialization
is
a
major
factor
for
wage
inequality
and
can
explain
a
substantial
part
of
the
varia-‐
tion,
constituting
equal
parts
as
education
and
deunionization.
They
define
fi-‐
nancialization
since
the
late
1970
as
two
interdependent
processes,
where
one
is
the
rising
dominance
of
the
finance
sector
and
the
other
is
non-‐finance
firms’
in-‐
volvement
in
financial
services
and
investments.
Thus,
in
the
field
of
higher
edu-‐
cation
one
might
expect
to
find
rising
involvement
by
finance
sector’s
actors
and
universities
and
others
governance
structures
appropriating
strategies
of
fi-‐
nance.
8. Malte
Nyfos
Mathiasen
University
of
California
at
Berkeley
May
12,
2014
Professor
Neil
Fligstein
SOC
280Q
8
Due
to
student
loans’
entanglement
in
the
financial
system,
one
might
ex-‐
pect
student
loans
to
have
a
similar
relationship
with
financialization
as
Lin
and
Tomaskovic-‐Devey
find
with
wages.
One
might
even
expect
a
stronger
relation-‐
ship,
since
student
loans
reflect
households’
ability
to
pay
for
education
with
their
savings
and
thus
consist
of
intergenerational
asset
inequality
rather
than
income
inequality.
One
might
expect
to
find
a
stronger
relationship
between
financialization
and
private
institutions.
One
might
also
expect
to
see
a
larger
shift
to
financiali-‐
zation
in
larger
institutions,
which
have
the
capacities
to
incubate
financial
in-‐
vestment
and
withstand
external
pressure
and
at
the
same
time
is
a
sizable
tar-‐
get
for
Wall
Street.
Though,
one
might
also
expect
community
colleges
and
public
universities
to
be
more
receptive
to
communal
students’
needs.
Meister
(2011)
states
that
there
has
been
a
strategical
turn
from
Universi-‐
ty
of
California
to
accommodate
more
out-‐state
students,
from
whom
they
profit
more,
than
in-‐state
students.
By
informal
agreement
between
UC
and
the
State
of
California
the
University
have
been
allowed
to
treat
tuition
fees
as
capital
rather
than
public
revenue.
In
this
way
Meister
argues
that
the
state
and
federal
gov-‐
ernment
through
the
Student
Loan
Program
subsidize
privatization
and
finan-
cialization of Higher Education.
Eaton et al. (2014) find that a rising share of spending on education is finan-
cialized and channelized as financial profit from $21 billion in 2002 to $45 billion in
2012 on Wall Street either by 1) growing interest on student loan debts, 2) through
interest paid by colleges’ on their own institutional debts, and 3) through profits ac-
crued by equity investors in for-profit colleges. The three mechanisms all impact how
the average indebted student’s prospects will look like
9. Malte
Nyfos
Mathiasen
University
of
California
at
Berkeley
May
12,
2014
Professor
Neil
Fligstein
SOC
280Q
9
Eaton
et
al.
(2013)
display
that
for
UC
debt
General
Revenue
Bonds
are
half
the
share
and
Medical
Center
Revenue
Bonds,
Limited
Projects
revenue
Bonds
and
State
Public
Works
Board
Bonds
share
the
other
half.
In
Swapping
our
Future
they
argue
that
UC
should
renegotiate
its
swapped
fixed
interest
rate,
since
it
does
not
reflect
the
current
interest
rate
after
the
financial.
Mettler
calls
U.S.
social
governed
programs
for
the
submerged
state,
be-‐
cause
the
consumer
does
not
directly
interact
with
federal
institutions
(2010).
Instead
private
providers,
who
are
funded,
regulated
and
subsidized,
handle
the
interaction.
Similarly,
Morgan
&
Campbell
phrase
it
a
delegated
state
to
emphasize,
how
federal
power
and
money
is
delegated
to
private
providers
on
behalf
of
the
state
(2011).
In
sum,
the
theories
place
the
federal
level
as
very
central
for
the
field
of
higher
education
through
it
capability
to
sublease
other
actors,
though
the
system
is
very
decentralized
with
many
accredited
and
subsidized
private
actors
and
difficult
to
navigate
in
for
students
as
consumers.
The
institute
for
College
Access
and
Success
reports
that
federal
loans
of-‐
ten
are
supplemented
with
private
loans.
So
far
I
have
only
encountered
good
statistics
for
federal
loans,
which
also
tend
to
be
easier
to
distinguish
from
loans
and
credits
used
for
other
amenities.
A
good
reason
not
to
emphasize
on
other
types
of
private
student
loans
and
consumer
loans,
can
be
found
in
Eaton
et
al.
(2014).
Here
they
find
that
the
federal
government
directly
guarantees
90
%
of
student
loans
and
private
loan
originators
have
imploded
in
the
market
for
stu-‐
dent
loan
(ibid.
13f).
10. Malte
Nyfos
Mathiasen
University
of
California
at
Berkeley
May
12,
2014
Professor
Neil
Fligstein
SOC
280Q
10
Detailing research design
I need a data source, where it is possible to crosstab types of higher education
institutions with average debt levels for student. For the purpose I use a large dataset
from IPEDS, which is part of the U.S Department of Education and has been generat-
ed by the National Center for Education Statistics. The dataset has 933 variables and
consists of aggregated institutional data from 2000-2010. Unfortunately, the dataset
does not provide individual level variables on student, why it is unsuitable to explain
how race, gender and class are mediated through loan levels in different types of insti-
tutions. As mentioned initially and reported by Eaton & Stewart (2013: 9f) earlier stud-
ies clearly indicate that minorities and students with lower socioeconomic status are par-
ticularly affected and increasingly turn to student loans
Research
question
How
have
different
types
of
private
and
public
institutions
of
higher
educa-‐
tion
impacted
students
differentially
through
provision
of
loans?
Variables
As dependent variable I choose the average student loan debt over time. Another
possibility to answer hypothesis A1 is to measure the probability for being an indebted
student. As seen below the two different variables show the same tendency and almost a
doubling in average student loans in the period from 2002 to 2012.
As data from the Federal Reserve Bank of New York Consumer Credit Panel shows the
average student loan debt owed by Californians rose from 16.600 $ in 2004 to 25.700 $
in 2012. Concurrently, the share of current and former students with student debt in-
11. Malte
Nyfos
Mathiasen
University
of
California
at
Berkeley
May
12,
2014
Professor
Neil
Fligstein
SOC
280Q
11
creased from 15 % in 2004 to 23 % in 2012 (Eaton & Stewart, 2013: 8f). It is plausible
that my findings will confirm some of the above findings.
As the primary independent variable I use the different types of institutions. The
college and university system in United States consist of three different types of institu-
tions. 1) Public community colleges and universities, 2) private non-profit institutions
and 3) private for-profit institutions. The national Institute for Education science also
divides institutions according to the length of enrollment, which also is a relevant pa-
rameter for how long students can accumulate student loans. The three types of institu-
tions above are therefore in the following analysis and in the database split between in-
stitutions with enrollment length of a) 4-year and b) 2-year. There is prior evidence to
suggest that the composition of lower income groups at private institutions is higher, and
more students at private for-profit institutions turn to loans. E.g. the College Board finds
that students here cover 37 % expenses through loans compared to an average of 26 %
(College Board, March 2013).
Type of
institution
Public,
4-year
or above
Private not-
for-profit,
4-year or
above
Private
for-profit,
4-year or
above
Public, 2-
year
Private not-
for-profit,
2-year
Private
for-
profit,
2-year
Frequency
in %
15 34 10 21 4 17
Type of institution
12. Malte
Nyfos
Mathiasen
University
of
California
at
Berkeley
May
12,
2014
Professor
Neil
Fligstein
SOC
280Q
12
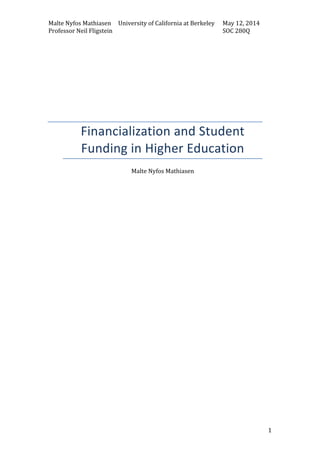
Empirical
evidence
For the selected data there was 36534 unique cases distributed over 11 years
with 3.321 unique institutions of higher education. Public institutions form 36 % and
private not-for-profit institutions form 38 %. In contrast private not-for-profits only
represent 4 % of 2-year institutions, whereas public 2-year institutions and private for-
profit institutions represent respectively 21 % and 17 % of the institution population.
The institutional data do not adjust for how many students each institution has.
Figure
1
0
1000
2000
3000
4000
5000
6000
7000
8000
Public,
4-‐year
or
above
Private
not-‐for-‐prodit,
4-‐year
or
Private
for-‐prodit,
4-‐year
or
above
Public,
2-‐year
Private
not-‐for-‐prodit,
2-‐year
Private
for-‐prodit,
2-‐year
Total
Average
amount
of
student
loans
received
by
full-‐time
Qirst-‐time
degree/
certiQicate-‐seeking
undergraduates
*
Sector
of
Institution
13. Malte
Nyfos
Mathiasen
University
of
California
at
Berkeley
May
12,
2014
Professor
Neil
Fligstein
SOC
280Q
13
Figure
2
Figure 1 and 2 show students’ amount of student loan from different types of institu-
tion. Both figures indicate that private for-profit institutions have students with the
highest amount and percentage of student loans, followed by private not for profits.
Public institutions have less student loans and are the only ones with a below average
amount. Except, for 2-year private for-profit, where the average amount of student
loans also is below the average, indicating that students in private non-profit institu-
tion tend not to accumulate too much student loans in two years. This theory is rein-
forced by a clear tendency for all 2-year institutions to be below corresponding 4-year
institutions in student loans.
0
20
40
60
80
Public,
4-‐year
or
Private
not-‐for-‐
Private
for-‐prodit,
4-‐
Public,
2-‐year
Private
not-‐for-‐
Private
for-‐prodit,
2-‐
Total
Percentage
of
full-‐time
Qirst-‐time
degree/
certiQicate-‐seeking
undergraduates
receiving
student
loans
*
Sector
of
Institution
14. Malte
Nyfos
Mathiasen
University
of
California
at
Berkeley
May
12,
2014
Professor
Neil
Fligstein
SOC
280Q
14
Figure
3
Figure
4
Figure 3 and 4 show a clear correlation between percentage of student with student
loans and average amount of student loans. These indicate that student is affected
equally on their tendency to collect student loans and their tendency to acquire larger
amount of student loan.
Remarkably, the percentage with student loans is constant for 2000-2003, though the
average amount increases over the whole period from 2000 to 2010. The total amount
of student loans increases significantly steep from 2008 to 2009, especially for the
total amount of student loan. Thus, the data indicate that the total amount of student
loans composes the largest variation, and the period of 2008-2009, as the financial
0
1000
2000
3000
4000
5000
6000
7000
8000
2000
2003
2006
2009
Average
amount
of
student
loans
received
by
full-‐time
Qirst-‐time
degree/certiQicate-‐seeking
undergraduates
*
Academic
Year
0
10
20
30
40
50
60
70
2000
2003
2006
2009
Percentage
of
full-‐time
Qirst-‐time
degree/certiQicate-‐seeking
undergraduates
receiving
student
loans
*
Academic
Year
15. Malte
Nyfos
Mathiasen
University
of
California
at
Berkeley
May
12,
2014
Professor
Neil
Fligstein
SOC
280Q
15
crisis kicks in and households and educational institutions respond, has a large impact
for the amount of student loans that today’s student population faces.
All
types
of
educational
institutions
follow
the
same
trend
whether
you
visualize
student
loans
as
index
starting
in
2000
or
as
the
total
amount.
Private
for-‐profit
4-‐
year
institutions
are
the
only
type,
which
deviate
noticeable
from
the
general
pat-‐
tern.
As
the
type
with
highest
average
amount
of
student
loan
they
differ
with
a
slightly
larger
amount
of
student
loans
in
2000-‐2003,
a
steep
decrease
to
the
level
0
2000
4000
6000
8000
10000
12000
1995
2000
2005
2010
2015
Average
amount
of
student
loan
in
$
Public,
4-‐year
or
above
Private
not-‐for-‐prodit,
4-‐year
or
above
Private
for-‐prodit,
4-‐year
or
above
Public,
2-‐year
Private
not-‐for-‐prodit,
2-‐year
Private
for-‐prodit,
2-‐year
0
50
100
150
200
250
2000
2001
2002
2003
2004
2005
2006
2007
2008
2009
2010
Average
amount
of
student
loan
(index
2000)
Public,
4-‐year
or
above
Private
not-‐for-‐prodit,
4-‐
year
or
above
Private
for-‐prodit,
4-‐year
or
above
Public,
2-‐year
Private
not-‐for-‐prodit,
2-‐
year
Private
for-‐prodit,
2-‐year
16. Malte
Nyfos
Mathiasen
University
of
California
at
Berkeley
May
12,
2014
Professor
Neil
Fligstein
SOC
280Q
16
of
all
other
types
of
institutions
in
2004
and
a
steeper
increase
than
the
rest
since
then
and
very
obvious
since
2008.
Thus,
the
private
for-‐profit
4-‐year
seem
to
re-‐
spond
to
the
general
rising
trend
in
student
loans
not
by
lowering
their
relative
amount
of
student
loans
but
instead
expanding
it.
This
is
noticeable
especially
for
the
two
last
years
in
the
dataset,
2009
and
2010,
where
we
see
that
the
increase
in
student
loans
is
larger
than
the
average
annual
increase.
This
trend
is
visible,
as
the
latest
cases
for
all
types
of
institutions
tend
to
be
above
the
trendline
in
figure
5
and
6.
17. Malte
Nyfos
Mathiasen
University
of
California
at
Berkeley
May
12,
2014
Professor
Neil
Fligstein
SOC
280Q
17
Conclusion
The average debt in student loans correlates unambiguously with the length of
study and different types of institutions. Private institutions and especially for-profit
institutions tend to have student with higher odds to have student loans and a higher
average for the student loan.
The results show large increase in the overall student loan absorbed by stu-
dents. One noticeable finding is that private-for-profit institutions tend to be slightly
more responsive and vary, when exogenous chock, such as the period of 2003-2004
and the financial crisis, affect student loans over time. In this manner Mettler theory
of the submerged state and Morgan & Campbell theory of the delegated state can ac-
count for, why we see a variation in student loans by different educational institutions.
This preliminary study calls for further studies of students loan in international
perspective and analysis of the actors involved and outcomes in forms of interest rates
on loans, default for student and especially, a disaggregated analysis of the composi-
tion of student. So far we can only can assume but not substantiate, how socioeco-
nomic variables affect the analysis and the IPEDS dataset. Thus, one way forward is
to link the IPEDS data to other resources, such as the U.S. Survey of Consumer Fi-
nance.
18. Malte
Nyfos
Mathiasen
University
of
California
at
Berkeley
May
12,
2014
Professor
Neil
Fligstein
SOC
280Q
18
Literature
College Board (2013), Visited April
16,
2014
at
https://www.collegeboard.org
Davis,
G.
F.
(2009).
Managed
by
the
markets:
How
finance
re-‐shaped
America.
Ox-‐
ford
University
Press.
Eaton,
Charlie
and
Stewart,
Brian,
(2013)
Wall
Street
&
California’s
Student
Debt
Crisis,
Issue
brief,
Center
On
Culture,
Organizations
and
Politics,
Institute
for
Re-‐
search
on
Labor
and
Employment,
University
of
California,
Berkeley
Eaton,
C.,
Goldstein,
A.,
Habinek,
J.,
Kumar,
M.,
Stover,
T.
L.,
&
Roehrkasse,
A.
(2013
A).
Bankers
in
the
Ivory
Tower:
The
Financialization
of
Governance
at
the
University
of
California.
Eaton,
Charlie,
Jacob
Habinek,
Mukul
Kumar,
Tamera
Lee
Stover
and
Alex
Roehr-
kasse, (2013 B) Swapping our Future
Eaton, Charlie, Dioun, Cyrus, Godoy, Daniela García Santibáñez,
Goldstein, Adam, Habinek, Jacob and Osley-Thomas, Robert (2014). Financialization
and Higher Education: Accumulation from Postsecondary Education Activities to the
Financial Sector, 2002 to 2012
Hall, P. and Soskice, D., Varieties of Capitalism, 2001; p. 1-68
Hacker, Jacob S. The Divided Welfare State:
The
Batle
over
Public
and
Private
Social
Benefits
in
the
United
States.
New
York,
NY:
Cambridge
University
Press,
2002.
Hacker, J. S. (2004). Privatizing risk without privatizing the welfare state: The hidden
politics of social policy retrenchment in the United States. American Political Science
Review, 98(02), 243-260.
Fligstein
N.
and
McAdam,
D.,
“Towards
a
theory
of
strategic
action
fields”,
2011,
Sociological
Theory
Granovetter
M.,
“Economic
action
and
social
structure:
the
problem
of
embed-‐
dedness”
American
Journal
of
Sociology
Lin
,K.
and
Tomaskovic-‐Devey,
D.
“Financialization
and
U.S.
Income
Inequality,
1970–2008”
American
Journal
of
Sociology
2013
118:
1284–1329
Meister,
B.
(2011).
Debt
and
Taxes:
Can
the
Financial
Industry
Save
Public
Uni-‐
versities?.
Representations,
116(1),
128-‐155.
Morgan, K. J., & Campbell, A. L. (2011). The delegated welfare state: Medicare,
markets, and the governance of social policy (Vol. 1). Oxford University Press.
19. Malte
Nyfos
Mathiasen
University
of
California
at
Berkeley
May
12,
2014
Professor
Neil
Fligstein
SOC
280Q
19
Mettler, S. (2010). Reconstituting the submerged state: The challenges of social poli-
cy reform in the Obama era. Perspectives on Politics, 8(03), 803-824.
Polyani
K.,
The
Great
Transformation,
1944
Rajan,
R.
G.
(2011).
Fault
lines:
How
hidden
fractures
still
threaten
the
world
econ-‐
omy.
Princeton
University
Press.
Scott
W.R.
“Contemporary
institutional
theory”
ch.
3
in
W.R.
Scott
Institutions
and
Organizations,
Sage,
1995
The Institute for College
Access
&
Succes
(2014)
(http://projectonstudentdebt.org
-‐
visited
April
16,
14)
Rothstein,
J.,
&
Rouse,
C.
E.
(2011).
Constrained
after
college:
Student
loans
and
early-‐career
occupational
choices.
Journal
of
Public
Economics,
95(1),
149-‐163.
20. Malte
Nyfos
Mathiasen
University
of
California
at
Berkeley
May
12,
2014
Professor
Neil
Fligstein
SOC
280Q
20
Appendix
A
Sector of Institution
Frequen-
cy Percent
Valid Per-
cent
Cumulative
Percent
Valid 1 5393 14,8 14,8 14,8
2 12247 33,5 33,5 48,3
3 3454 9,5 9,5 57,7
4 7575 20,7 20,7 78,5
5 1459 4,0 4,0 82,5
6 6406 17,5 17,5 100,0
Total 36534 100,0 100,0
Average amount of student loans received
by full-time first-time degree/certificate-
seeking undergraduates * Academic Year
Average amount of student loans received by
full-time first-time degree/certificate-seeking un-
dergraduates
Academic
Year Mean N
Std. Devia-
tion
2000 3333,26 3092 1704,347
2001 3460,23 3139 1817,024
2002 3689,80 3205 1974,977
2003 4017,58 3269 2429,492
2004 3954,13 3286 1918,094
2005 4209,67 3282 2023,039
2006 4500,14 3409 2443,316
2007 4793,82 3464 2605,908
2008 5530,84 3518 2535,083
2009 6691,60 3165 2726,120
2010 6696,00 3705 2571,083
Total 4662,19 36534 2557,583
Average amount of student loans received by
full-time first-time degree/certificate-seeking
undergraduates * Sector of Institution
Average amount of student loans received by full-
time first-time degree/certificate-seeking under-
graduates
21. Malte
Nyfos
Mathiasen
University
of
California
at
Berkeley
May
12,
2014
Professor
Neil
Fligstein
SOC
280Q
21
Sector of Insti-
tution Mean N
Std. Devia-
tion
1 3909,56 5393 1500,209
2 4937,14 12247 2237,736
3 7210,15 3454 3500,506
4 2882,42 7575 1245,056
5 4336,23 1459 2286,051
6 5575,16 6406 2736,077
Total 4662,19 36534 2557,583
Percentage of full-time first-time de-
gree/certificate-seeking undergraduates re-
ceiving student loans * Academic Year
Percentage of full-time first-time de-
gree/certificate-seeking undergraduates receiv-
ing student loans
Academic
Year Mean N
Std. Devia-
tion
2000 50,22 3092 27,623
2001 50,43 3139 27,765
2002 50,63 3205 27,780
2003 52,75 3269 27,850
2004 54,07 3286 28,219
2005 54,82 3282 27,535
2006 55,85 3409 27,187
2007 55,73 3464 27,637
2008 57,28 3518 27,546
2009 61,00 3165 26,831
2010 61,96 3705 26,846
Total 55,11 36534 27,784
Percentage of full-time first-time de-
gree/certificate-seeking undergraduates re-
ceiving student loans * Sector of Institution
Percentage of full-time first-time degree/certificate-
seeking undergraduates receiving student loans
Sector of Insti-
tution Mean N
Std. Devia-
tion
1 47,06 5393 18,829
2 63,40 12247 20,452
3 74,94 3454 22,345
22. Malte
Nyfos
Mathiasen
University
of
California
at
Berkeley
May
12,
2014
Professor
Neil
Fligstein
SOC
280Q
22
4 22,51 7575 19,709
5 60,06 1459 24,711
6 72,79 6406 21,542
Total 55,11 36534 27,784
Report
Average amount of student loans received by full-time first-time
degree/certificate-seeking undergraduates in $
Sector of Insti-
tution
Academic
Year Mean N
Std. Devia-
tion
1 2000 2866,87 490 1015,366
2001 2966,89 493 982,162
2002 3067,33 490 935,236
2003 3175,59 491 945,381
2004 3368,72 493 968,678
2005 3683,27 496 1150,010
2006 3815,44 501 1142,004
2007 4040,43 501 1185,269
2008 4770,86 505 1289,201
2009 5633,01 414 1483,663
2010 5760,65 519 1336,418
Total 3909,56 5393 1500,209
2 2000 3720,21 1087 1715,900
2001 3673,97 1105 1495,679
2002 3889,55 1112 1527,956
2003 4263,88 1130 1948,487
2004 4353,13 1116 1721,282
2005 4587,84 1125 1785,506
2006 4816,44 1134 2203,309
2007 5062,65 1141 2153,391
2008 6019,39 1149 2131,352
2009 7057,91 997 2237,234
2010 6956,91 1151 2025,312
Total 4937,14 12247 2237,736
3 2000 4485,96 217 1784,267
2001 5372,19 237 2488,786
2002 5964,73 246 3109,786
2003 6403,31 265 3845,409
2004 5453,76 270 2815,619