Download as PDF, PPTX
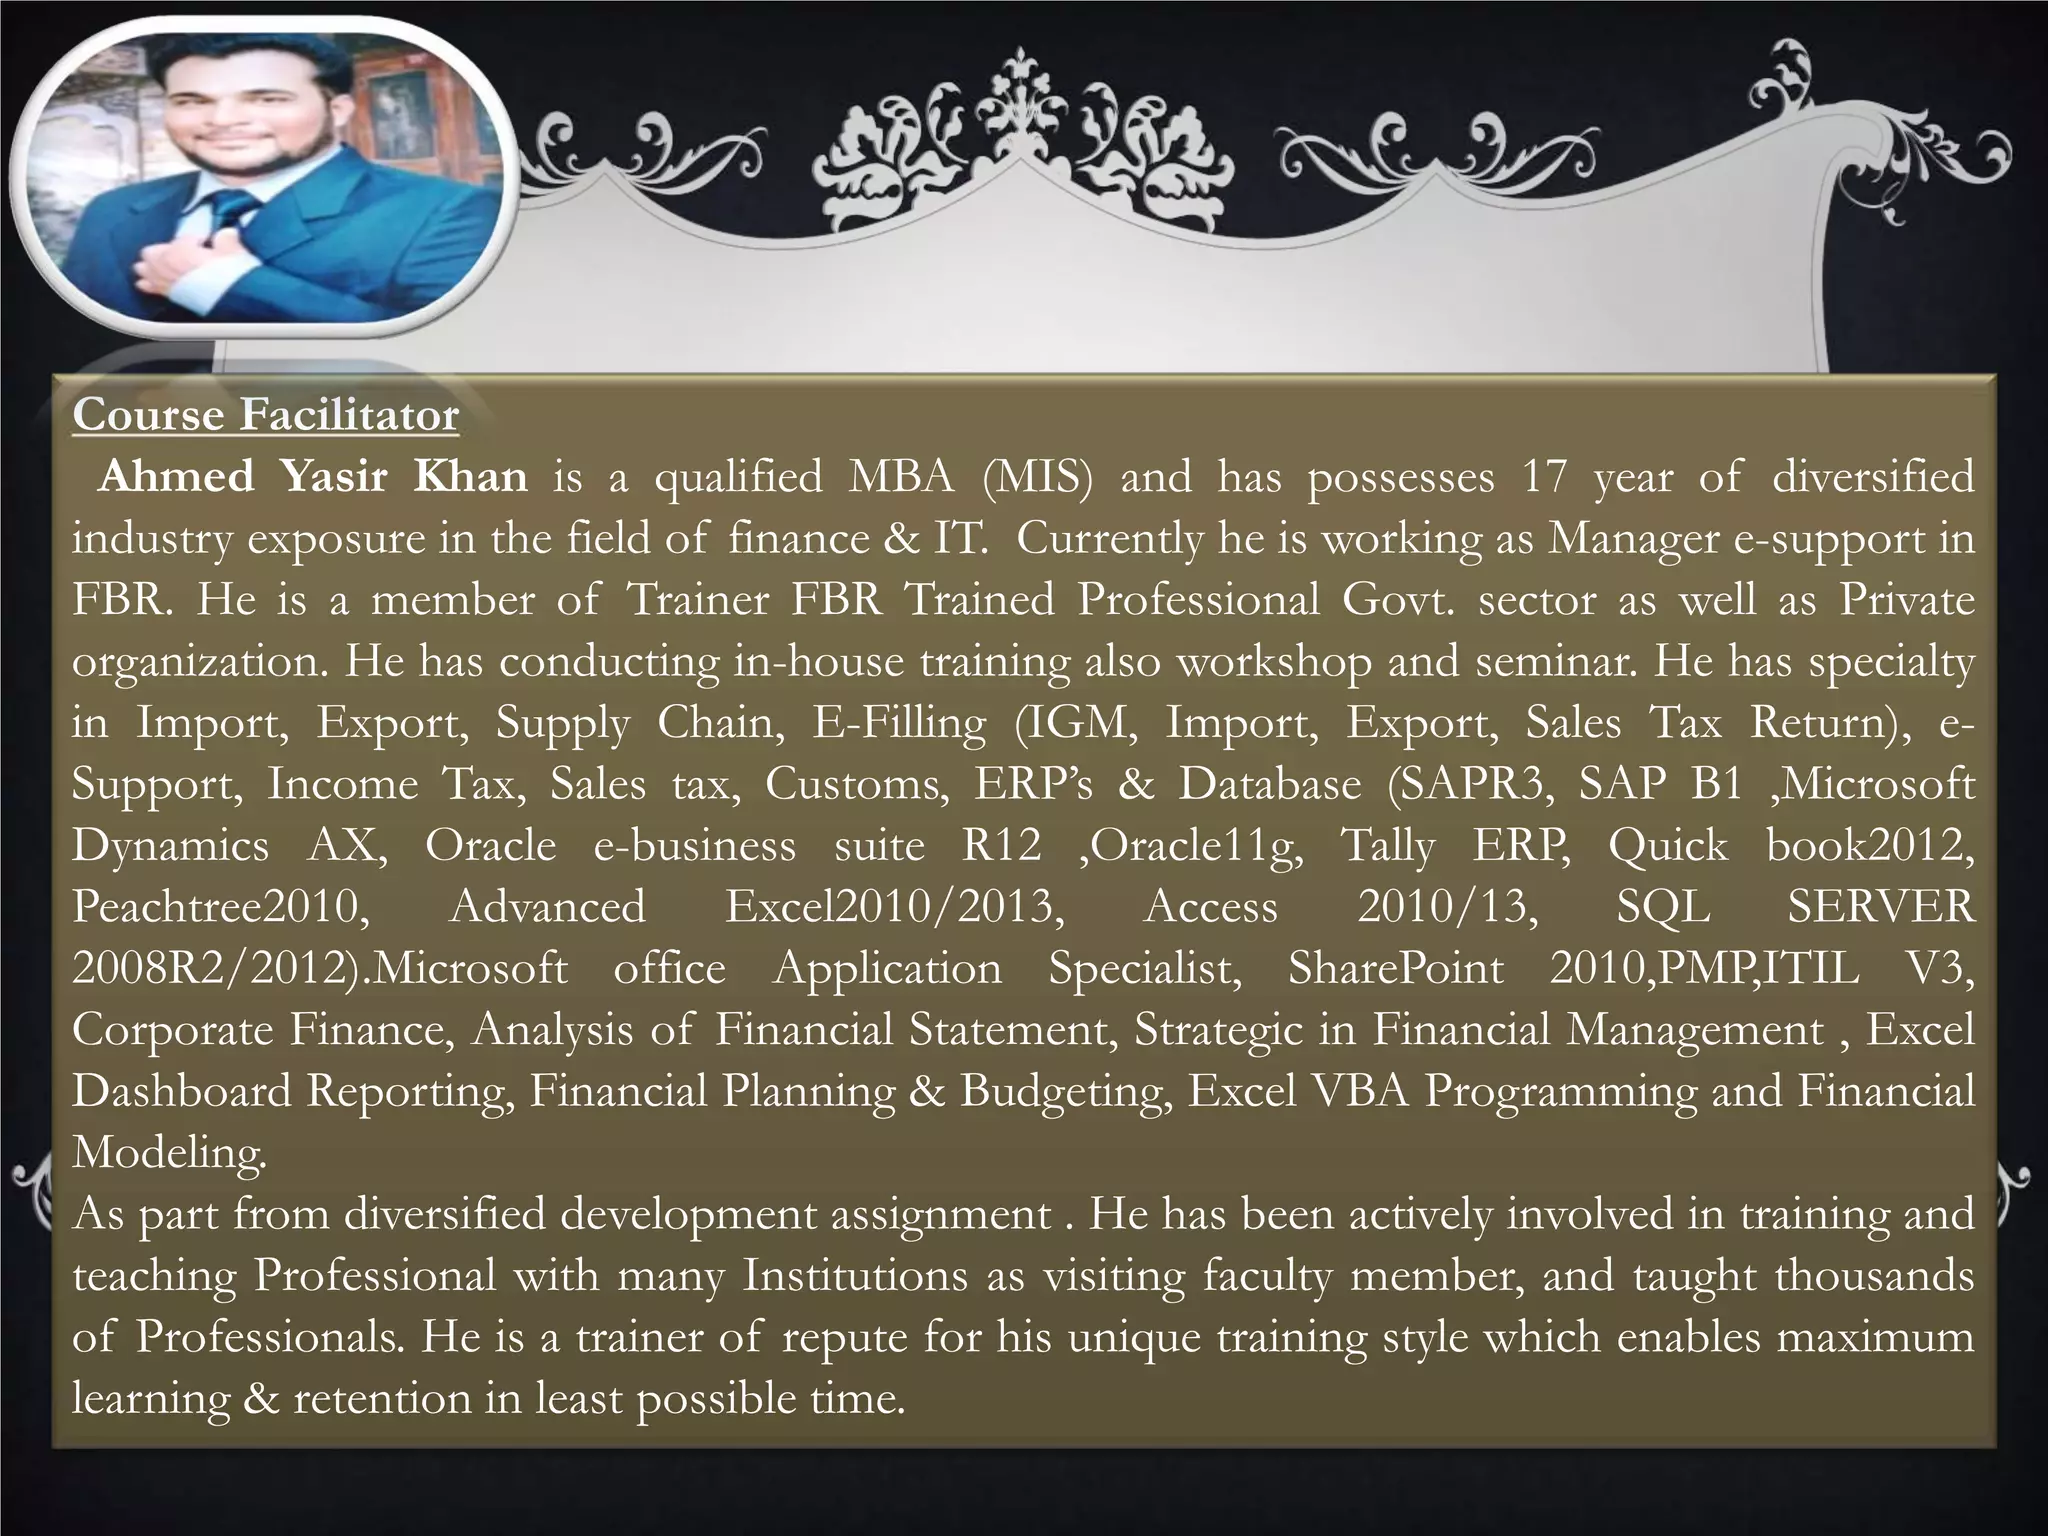
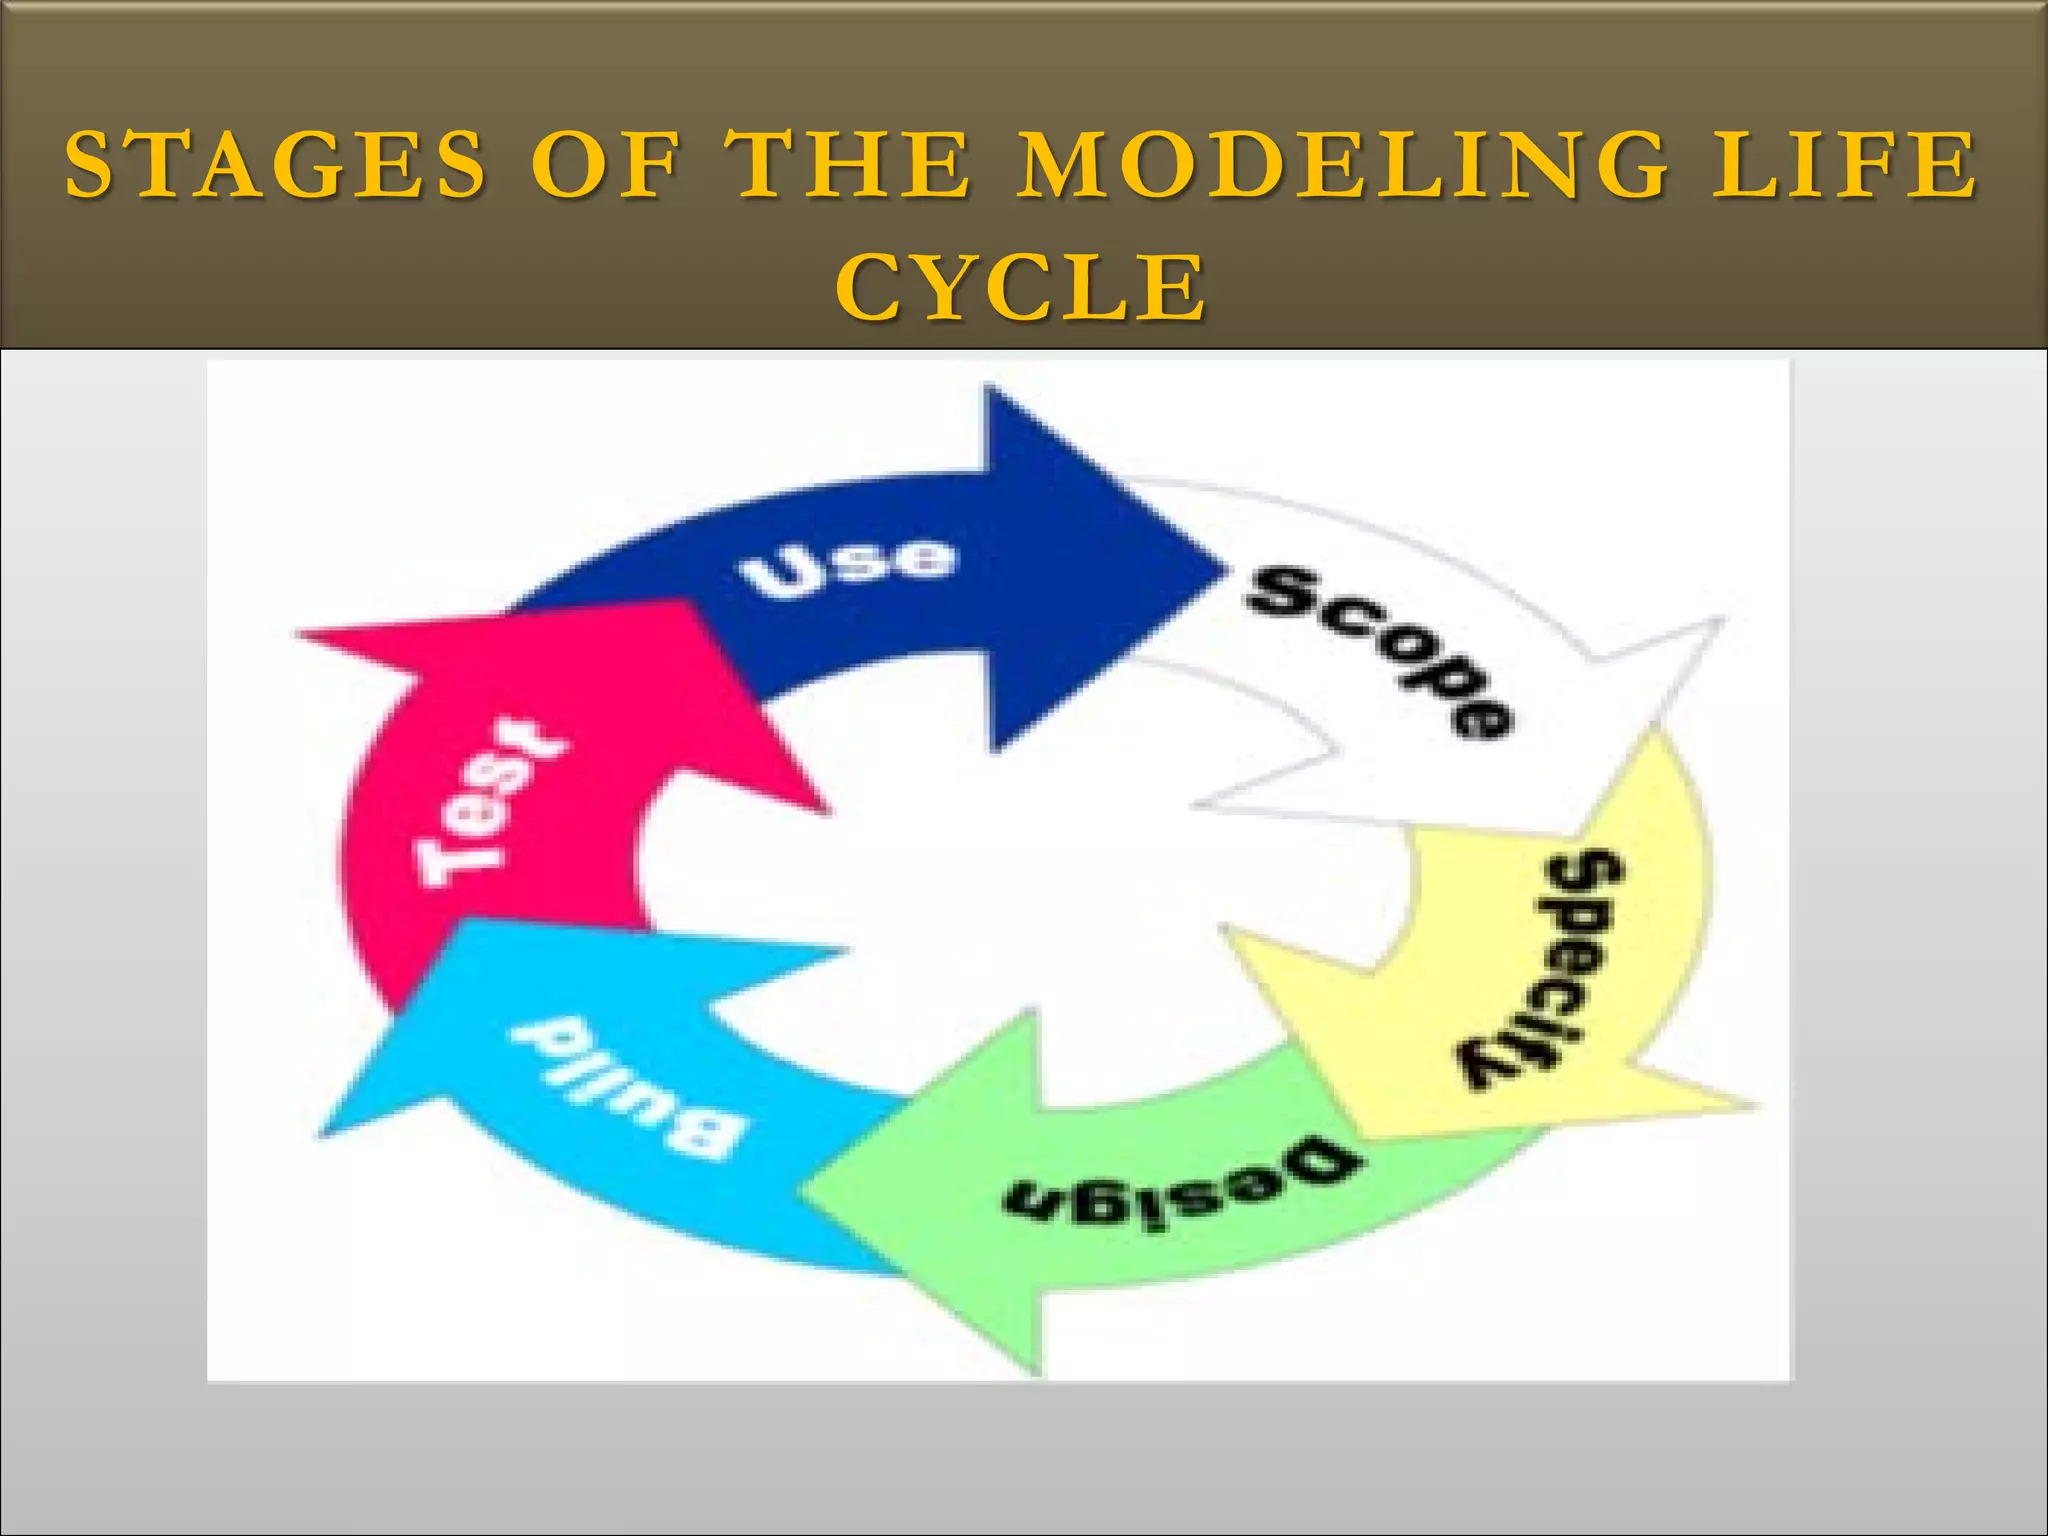


This document describes a two-day workshop on financial modeling facilitated by Ahmed Yasir Khan. It provides information on the facilitator's qualifications and experience in finance, IT, training and modeling. The document then defines what financial models are and their uses in communication and comparison. It outlines the agenda for the workshop, which will use Excel to create financial models and discuss best practices. Key topics that will be covered include roles in modeling, risk factors, types of models, and stages of the modeling life cycle such as scope, specification, design and more.


