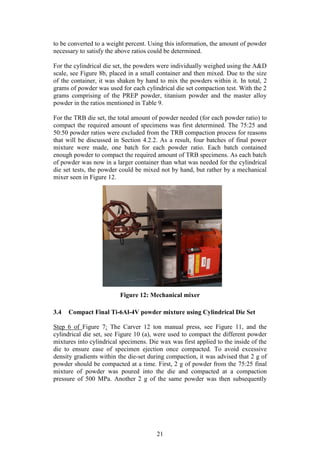
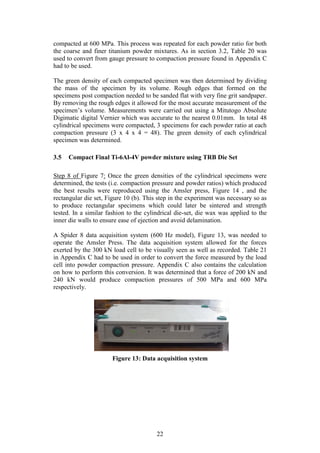
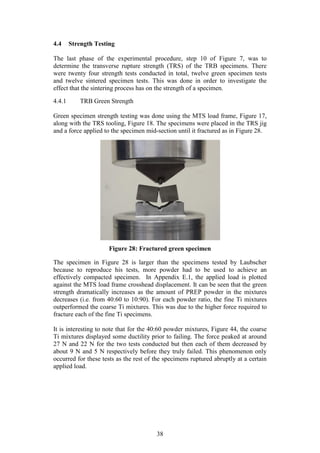
The document summarizes a project to improve the usability of waste Ti-6Al-4V powder from Boeing's plasma rotating electrode process (PREP). The objectives are to identify the most effective method for improving the compressibility of coarse PREP Ti-6Al-4V powder while maintaining the alloy stoichiometry. Two proposed solutions are to use a pre-alloyed or blended elemental approach to mix the coarse powder with finer powders. The project aims to compact, sinter and test strength of the improved powder blends to determine if the methodology provides a feasible way of using the wasted powder.


![15
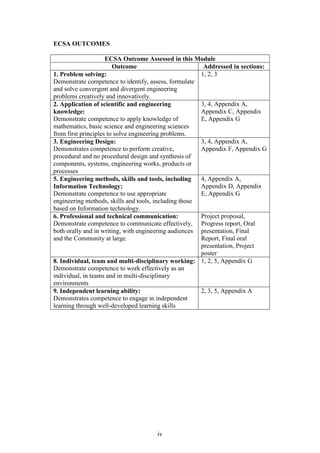
TRB Specimens – Average Green Density
(compaction pressure 300-500 MPa) (g/cm3
)
3.51
Sintering
Sintered [@ 1300 o
C] Density (g/cm3
) 4.05
Sintered [@ 1300 o
C] Strength (MPa) 1260
Table 7 and Table 8 summarise the results obtained by Kirchener (2009) and
Laubscher (2012), respectively, in their final year projects. Both Kirchener and
Laubscher used varied sizes of elemental titanium powder in their studies.
Although titanium is not an extensively used material, these results will be an
appropriate benchmark against which the current studies PREP Ti-6Al-4V powder
performance can be compared.
As previously mentioned, this project does not pick up from a previous students
work. However, this project does use previous student’s results and testing
procedures/parameters as a point of reference for the tests that will be conducted.
Also, these projects made use of equipment which is particularly applicable to the
current study such as the Amsler and Carver presses, vacuum furnace and MTS
load frame.
A problem which occurred in Kirchener’s study is that of delamination in some
of his samples after compaction. In particular, this problem occurred in his TRB
samples. The delamination was caused by inadequate lubrication of the TRB die
walls prior to compaction which caused significant friction between the die wall
and powder compact during ejection. The significant frictional forces caused the
compacts to crack during ejection.
The use of an industry proven die-wall lubricant is a suggestion made by
Kirschener to solve the issue of delamination. This may be a viable solution
however; the die-wall lubricant has the potential to contaminate the microstructure
of the compact samples. It is the hope that because of the larger size powder
particles used in this project, the issue of delamination will be less persistent. If it
is found that delamination is severe in the execution of this project then the die-
wall lubricant will be considered.](https://image.slidesharecdn.com/b6282932-68f9-47fe-9940-44d6b2a42e22-150813114556-lva1-app6892/85/Final-Year-Engineering-Dissertation-26-320.jpg)
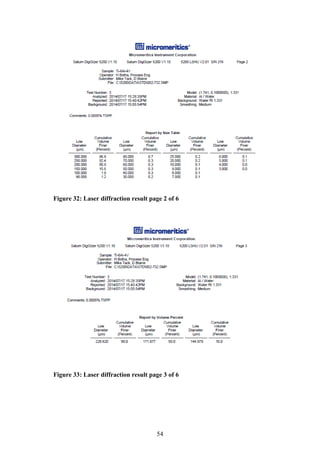
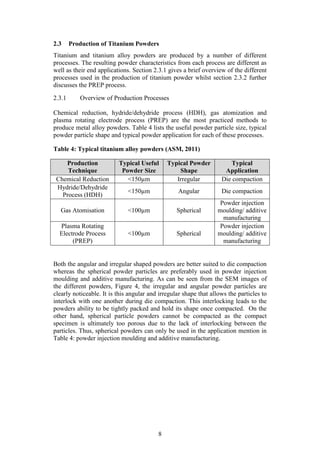
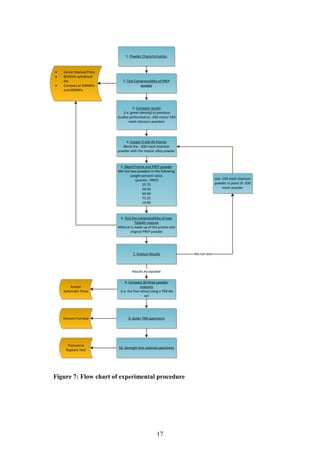
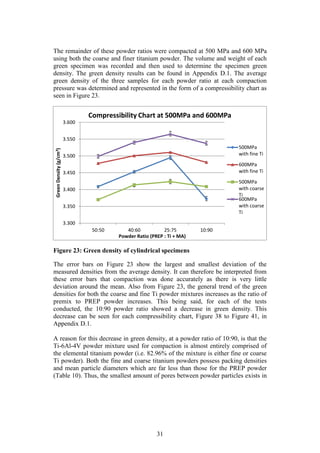
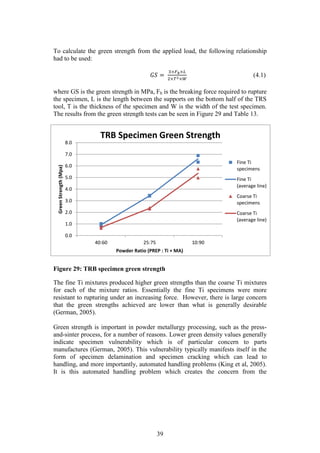
![16
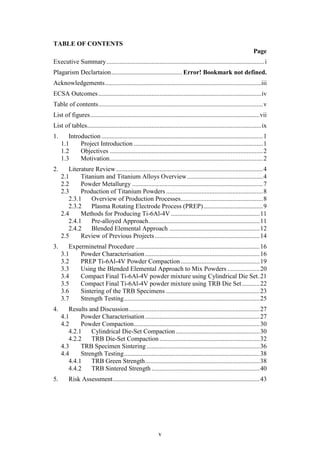
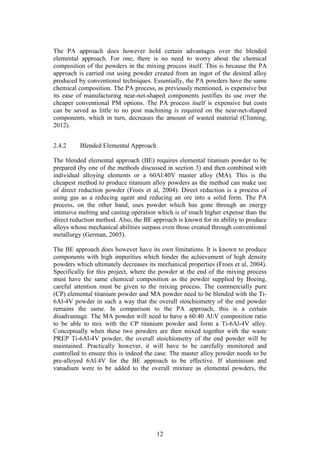
3. EXPERMINETNAL PROCEDURE
The procedure followed in executing the project experiment is represented
visually by the flow chart in Figure 7 below. Each step from the flow chart is
elaborated as follows:
3.1 Powder Characterisation
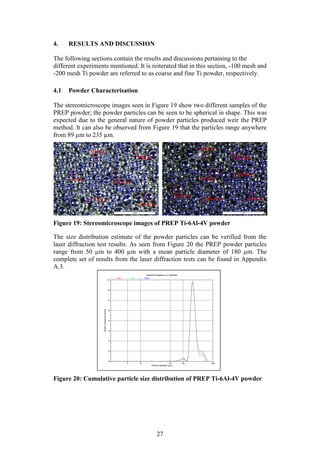
Step 1 in Figure 7: The PREP Ti-6Al-4V powder was characterised in order to
determine the particle size and distribution, flow rate, apparent density and
composition. These characteristics are important as they help to provide a better
understanding of the powder and its behaviour (German, 2012).
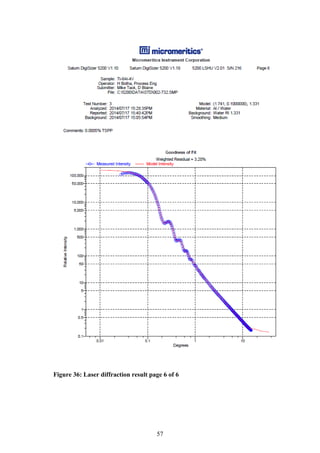
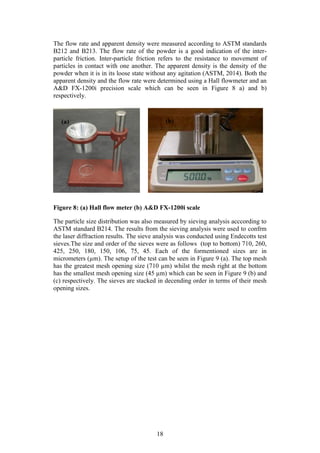
The particle size distribution of the PREP powder was measured using laser
diffraction. This technique measures the angular variation in intensity of light
scattered as a beam passes through a dispersed particle sample. The principle on
which this process is based is the theory that large particles scatter light at small
angles relative to the laser beams whilst small particles scatter light at large
angles. Therefore based on the angular scattering intensity data measured, the
particle size responsible for creating the scatter pattern can be determined (ASM,
1998).
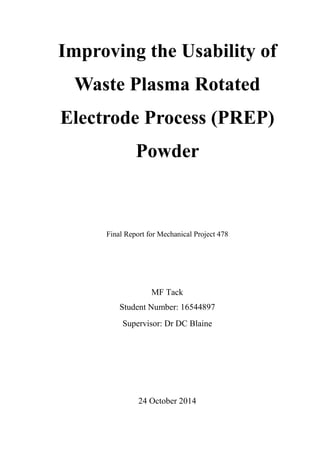
The laser diffraction size distribution of the PREP powder was measured by Mrs
H Botha from the Process Engineering Department of Stellenbosch University.
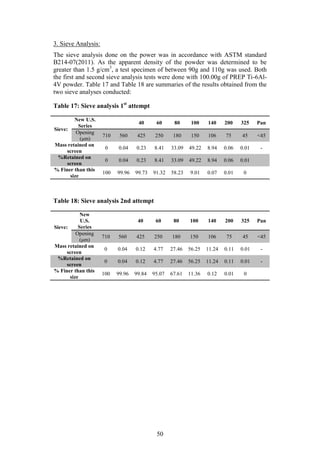
The equipment needed to conduct the laser diffraction size distribution can be
seen in Figure 6 (a) [Make: Micromeritics®, Model: Saturn Digitizer]. The laser
diffraction results were then visually confirmed using a stereomicroscope system,
see Figure 6 (b). [Make: Olympus Model: SZX7 unit, KL 1600 LED light source,
ACH1X objective/camera, SC30 observation tube].
Figure 6: (a) Micrometrics Saturn DigiSizer (b) Olympus SZX7
stereomicroscope system
(a) (b)](https://image.slidesharecdn.com/b6282932-68f9-47fe-9940-44d6b2a42e22-150813114556-lva1-app6892/85/Final-Year-Engineering-Dissertation-27-320.jpg)
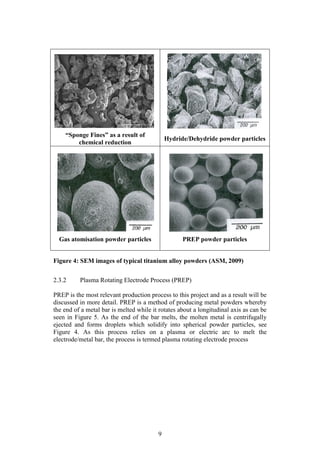
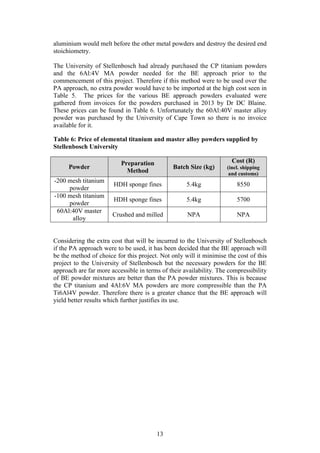
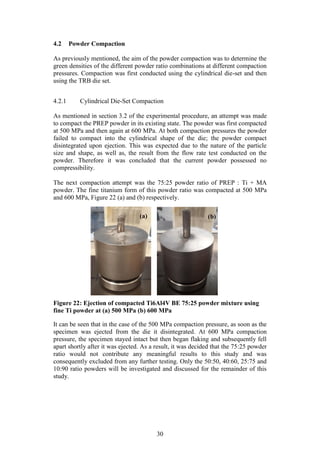
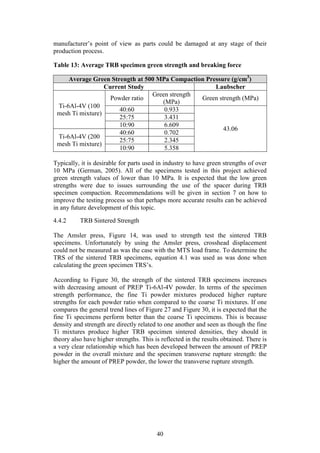
![23
There were a total of 24 TRB specimens compacted. For reasons explained in
section 4.2.2, the TRB specimens were only compacted at 500 MPa. The
specimen green densities were determined in a similar manner to the cylindrical
specimen green densities. All the rough edges were removed using the fine grit
sandpaper and then the specimen was measured and weighed from which, the
green density could be calculated.
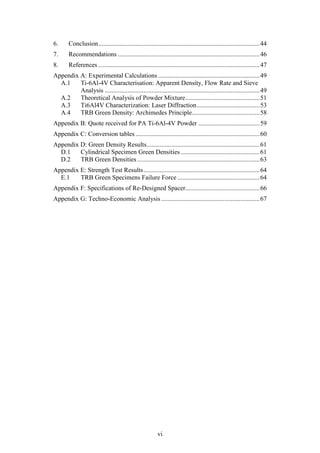
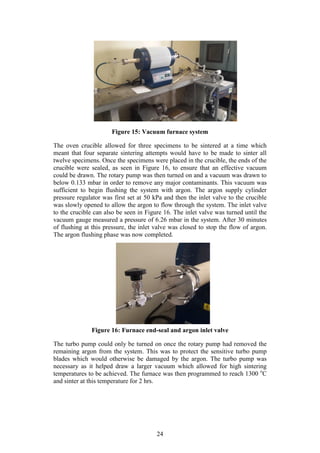
3.6 Sintering of the TRB Specimens
Step 9 of Figure 7: Only halve of the compacted TRB specimens were sintered so
that a comparison could be made between their green strength and sintered
strength in the next phase of testing. The sintering system that was used
comprised of a vacuum system combined with a sintering oven. The vacuum
system is made up of an Adixen rotary vane pump [Model: Pascal 2012SD],
Varian turbo pump [Model: Turbo-V 81-M] and an Adixen vacuum gauge
[Model: ACS 2000] (Laubscher, 2012). The sintering oven used was an Elite 1500
o
C Horizontal tube furnace [Model: TSH 15-50-180]. Figure 15 below shows the
vacuum furnace system in its entirety.
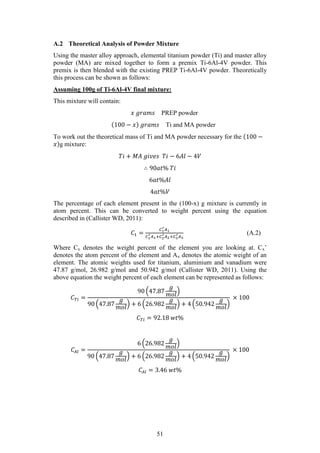
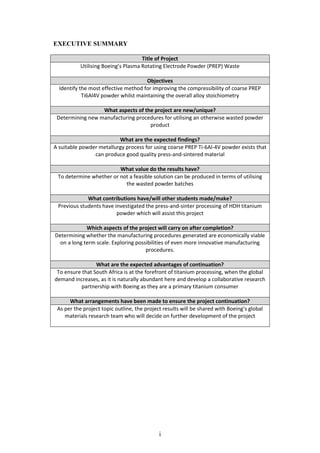
Figure 14: Amsler 25 ton automatic press](https://image.slidesharecdn.com/b6282932-68f9-47fe-9940-44d6b2a42e22-150813114556-lva1-app6892/85/Final-Year-Engineering-Dissertation-34-320.jpg)
![47
8. REFERENCES
Boyer R, R, 2010, “Attributes, Characteristics, and Applications of Titanium and
its Alloys”, [Online] Available From:
http://www.tms.org/pubs/journals/JOM/1005/boyer-1005.html
Campbell, K. 2013,”SA moves to use titanium-ores platform to build new high-
tech industry” [Online] Available From:
http://www.engineeringnews.co.za/article/sa-moves-to-use-titanium-ores-
platform-to-build-new-high-tech-industry-2013-08-30
Clark, J, 2012, “R5bn titanium Industry Planned for South Africa by 2020”,
[Online] Available From: http://www.moneyweb.co.za/moneyweb-south-
africa/r5bn-titanium-industry-planned-for-sa-by-2020?sn=2009+Detail
Van Vuuren, D.S, 2009 “Titanium—an opportunity and challenge for South
Africa.” , Keynote Address ,The 7th International Heavy Minerals Conference
‘What Next’, The Southern African Institute of Mining and Metallurgy
Pohlman N.A, Roberts J.A, Gonser M.J, 2012, “Characterization of titanium
powder: Microscopic views and macroscopic flow” [Online] Available From:
http://www.sciencedirect.com/science/article/pii/S0032591012003154
ASM International, 1998 “ASM Handbook. Vol 7, Powder metal technologies
and Application”, Handbook Committee
ASM International, 2011 “ASM Handbook. Vol 7, Powder metal technologies
and Application”, Handbook Committee
German R M, 2005.“Powder Metallurgy and Particulate Processing”. Metal
Powder Industries Federation
H.H. Laubscher. 2012. “Press and Sinter Processing of HDH Ti Powder”,
Mechanical Project 478 Final Report, Department of Mechanical Engineering.
Stellenbosch
Groover, M P, 2007, “Fundamentals of Modern Manufacturing”. John Wiley &
sons inc.
Callister WD, R. D. (2011). Material Science and Engineering. Asia: John Wiley
& Sons Pte Ltd.
Goso, X and Kale, A. 2010. “Production of Titanium Powder by the HDH
Process”, Advanced Metals Initiative, Light Metals Conference](https://image.slidesharecdn.com/b6282932-68f9-47fe-9940-44d6b2a42e22-150813114556-lva1-app6892/85/Final-Year-Engineering-Dissertation-58-320.jpg)
![48
Froes, F H and Eylon, D, 1990, “Powder Metallurgy of Titanium Alloys”, Int.
Mater Rev, Vol 35
Moxson, V, Senkov, O N, Froes, F H, 1997, “Production and Charaterization of
Titanium Powder Products for the Environtal, Medical and Other Applications”,
Advanced Particulate Materials and Processes, F.H. Froes and J.C. Hebeisen, Ed.,
American Powder Metallurgy Institute
Froes, F H and Aeolian, D, 1984, “Production of titanium Powder”, Metals
Handbook 9th
ed. , American Society for Metals ,Colorado
Robertson, I M and Schaffer, G B, 2010, “Comparison of Sintering of Titanium
and Titanium Hydride Powders”, Powder Metallurgy, 53(1), pp. 12-19
Froes, F H, Suryanarayana, C, 1993, “Powder Processing of Titanium Alloys”,
Vol 1, pg. 223-275
Clinning, N, 2012, “Thermomechanical Processing of Blended Elemental Powder
Ti-6Al-4V Alloy”, Masters Dissertation, University of Cape Town
FH Froes, SJ Mashl, JC Hebeisen, VS Moxson, and VA Duz,2004, “The
technologies of titanium powder metallurgy”.JOM Journal of the Minerals, Metals
and Materials Society, 56(11):46–48
ASM, 2014, “ASM Aerospace Specification Metals inc.” [Online] Available
From: http://asm.matweb.com/search/SpecificMaterial.asp?bassnum=MTP641
P King, G Poszmik, R Causton , 2005, “Higher Green Strength Materials for
Green Handling”, Hoeganaes Corporation. Presented at PM2
Tec 2005, Montreal,
Canada](https://image.slidesharecdn.com/b6282932-68f9-47fe-9940-44d6b2a42e22-150813114556-lva1-app6892/85/Final-Year-Engineering-Dissertation-59-320.jpg)