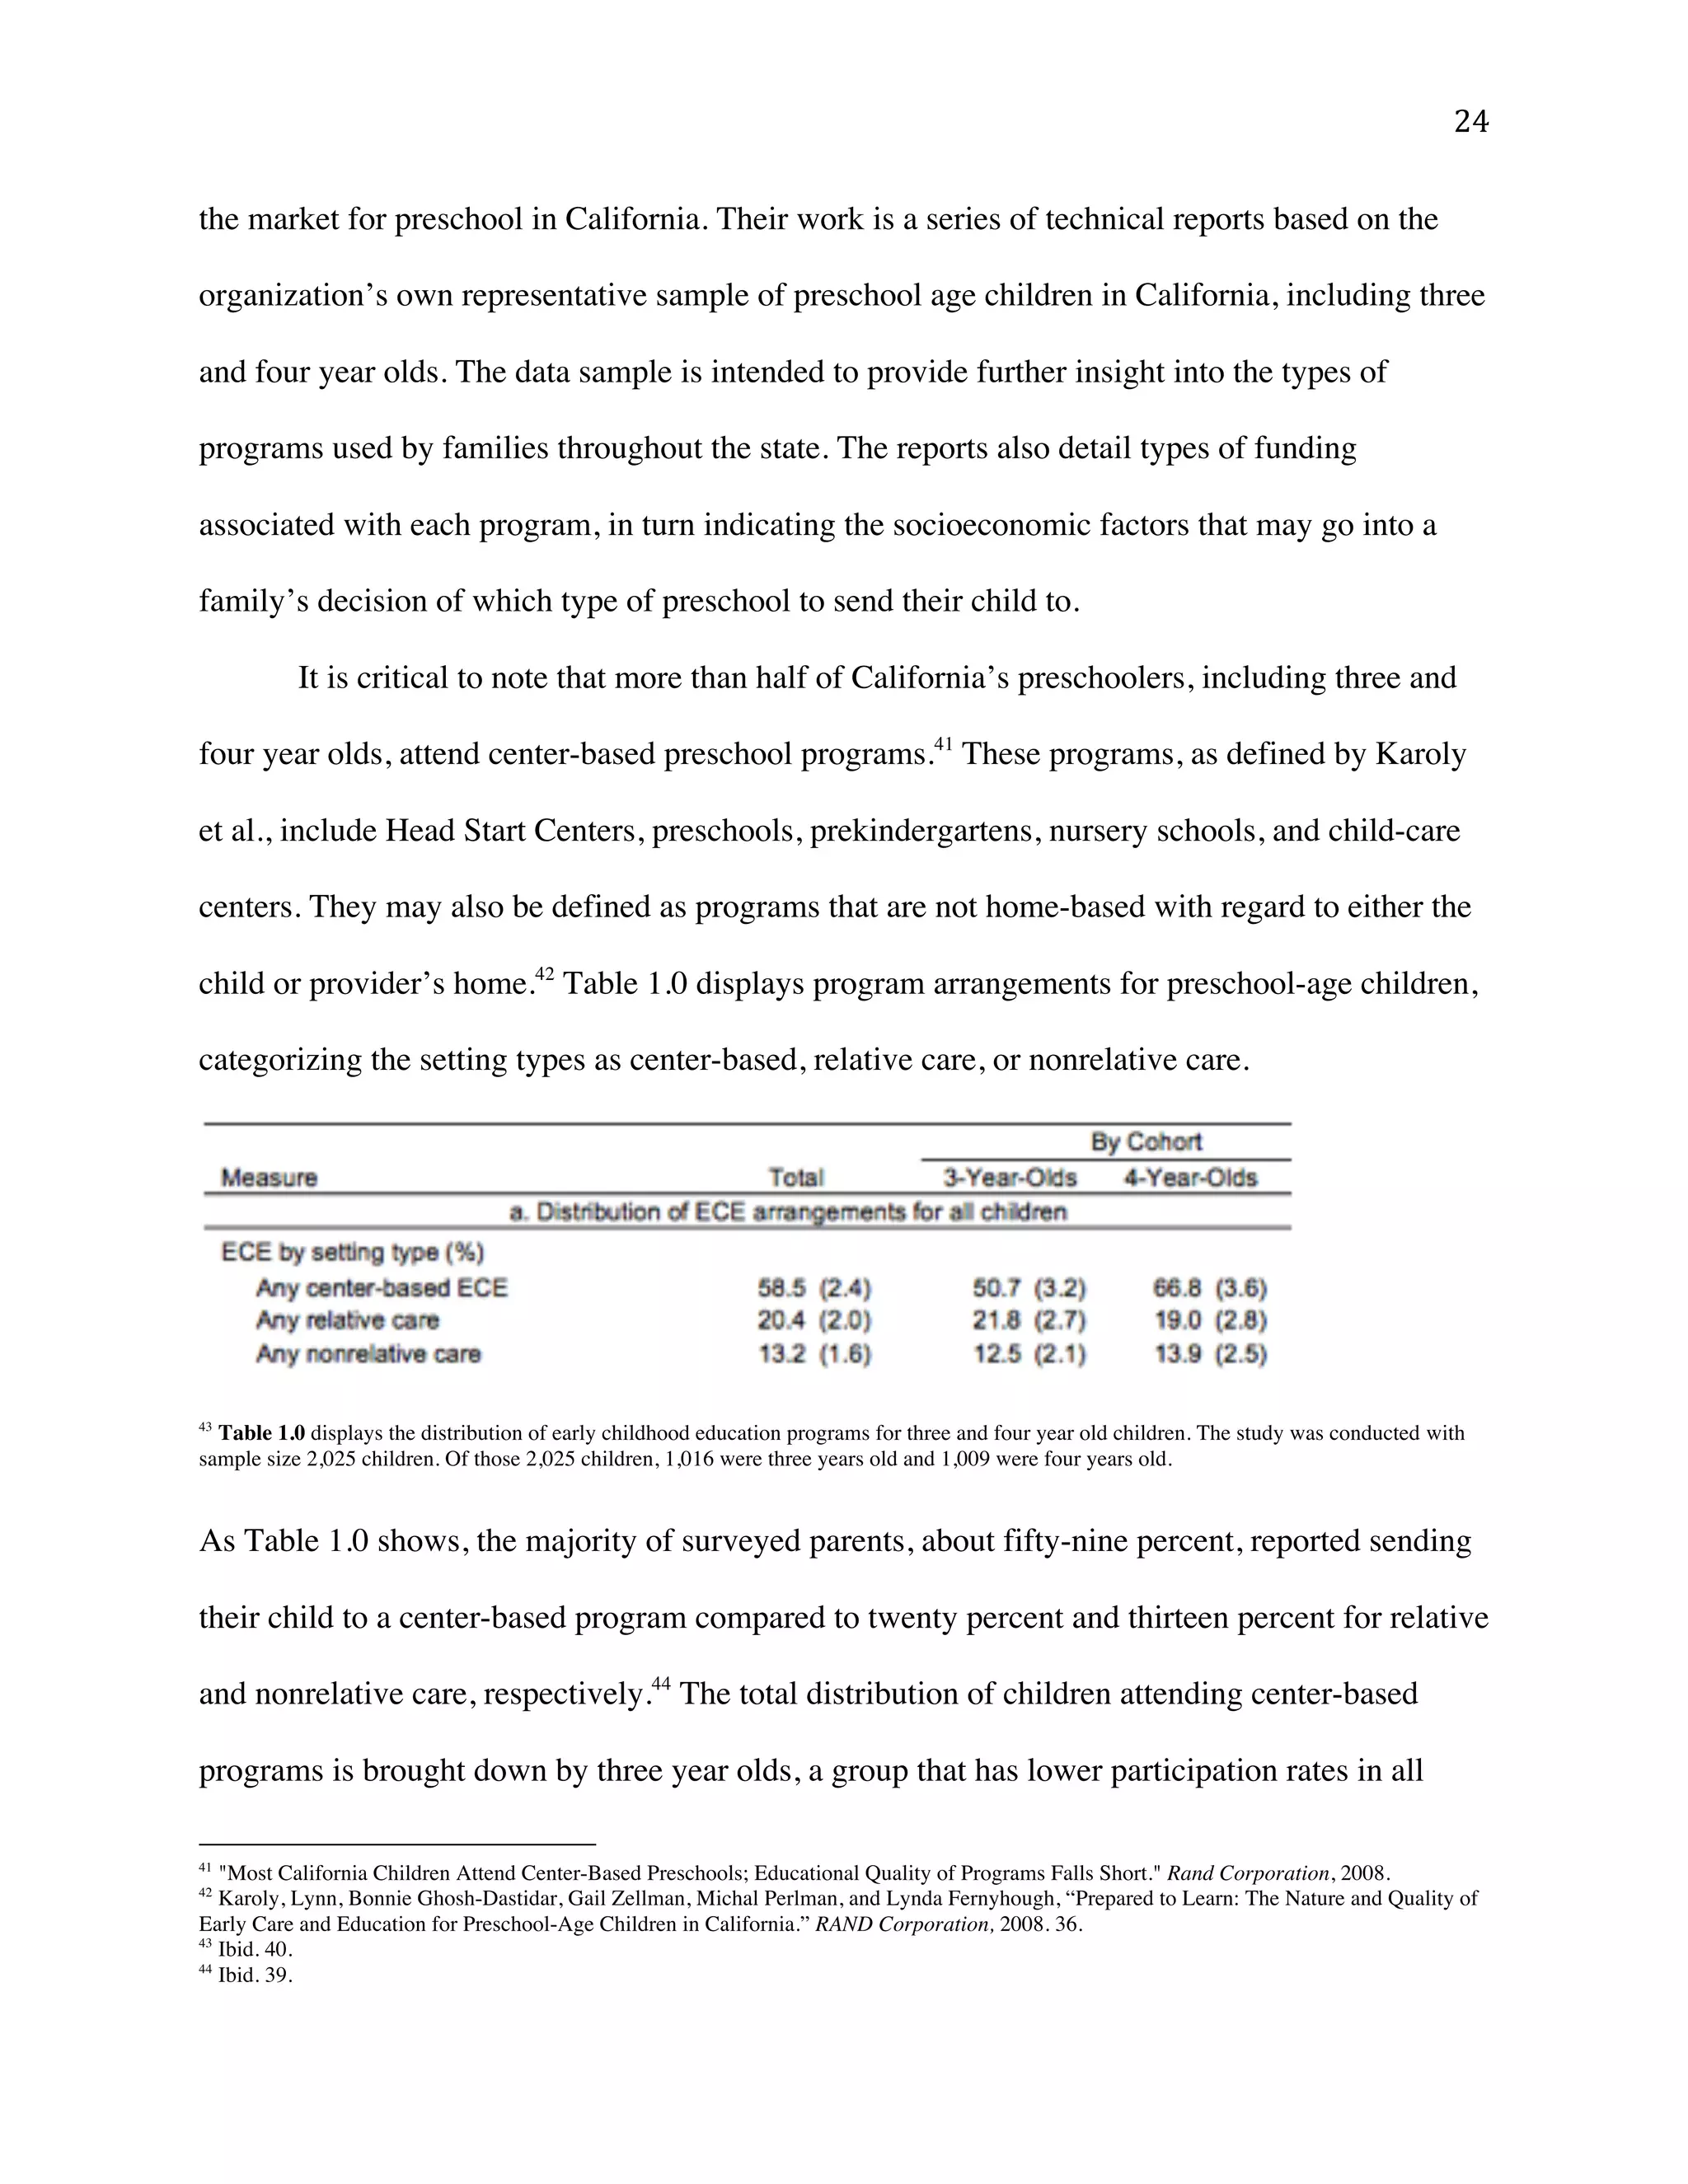
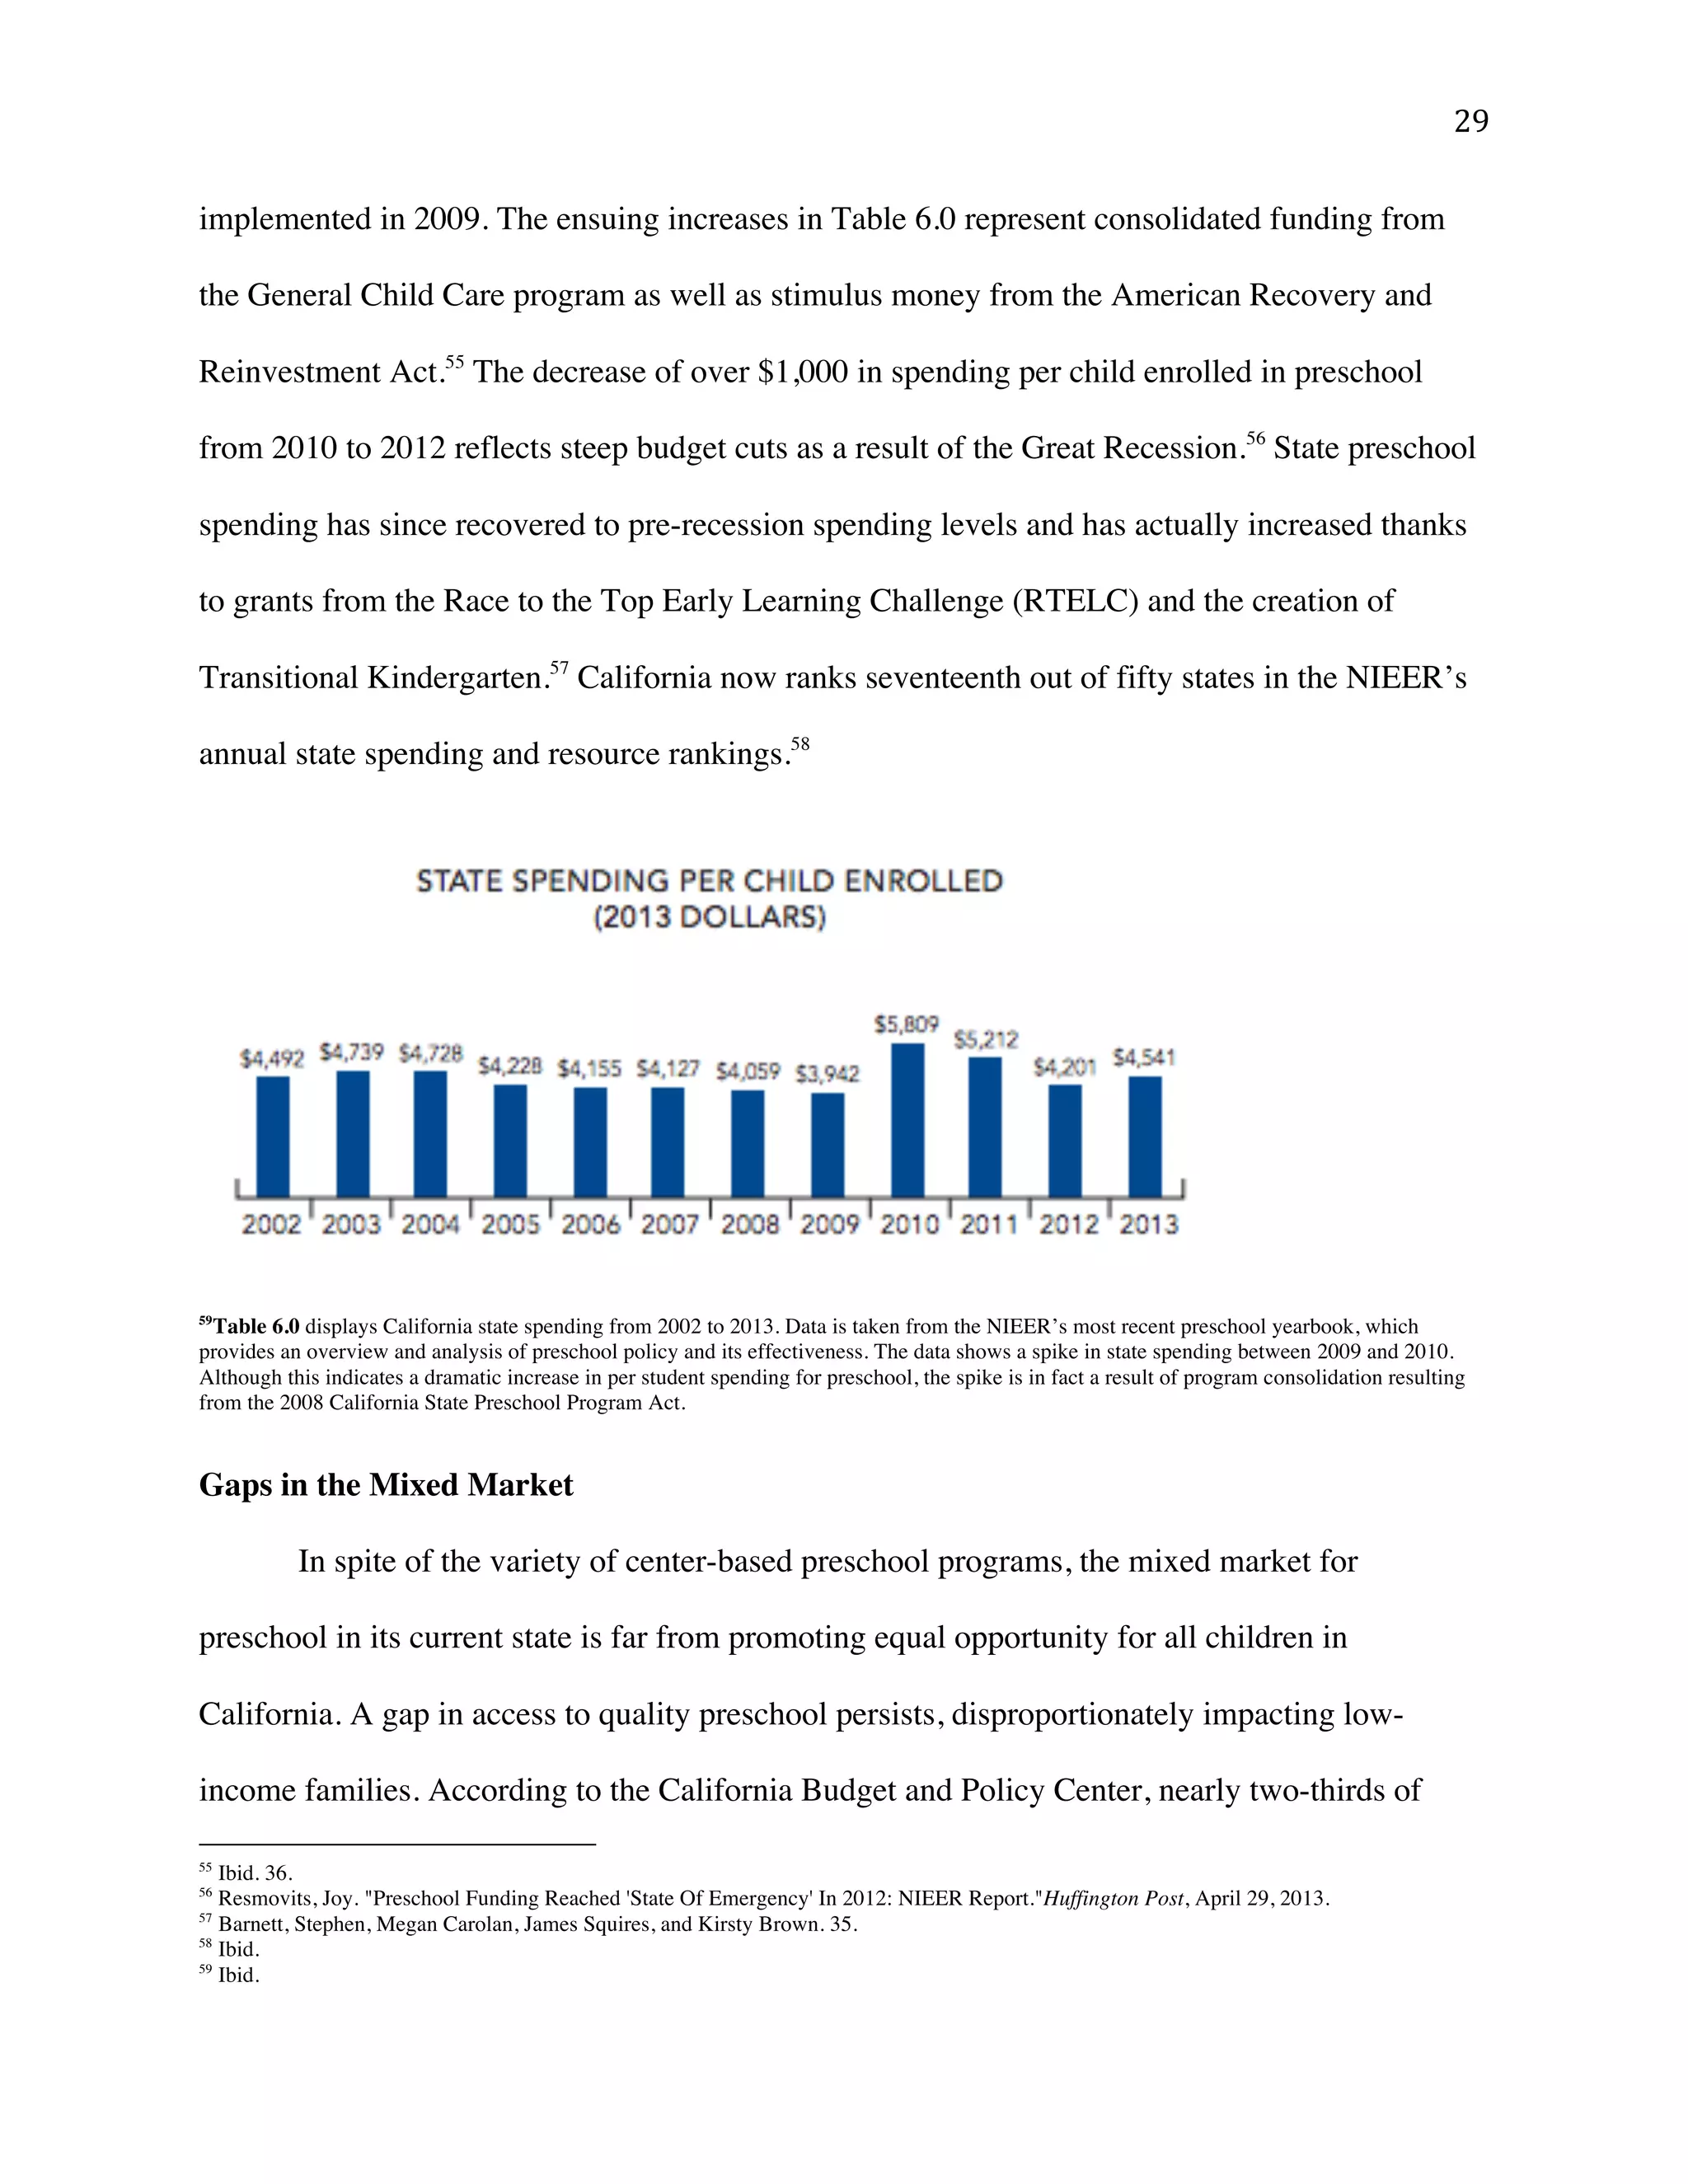
! "!
University of California, Berkeley
Preschool For All:
Increasing Access and Quality in California
By Daniel Sparks
Senior Honors Thesis
Political Economy
! #!
Table of Contents
Introduction 3
Methodology 6
Literature Review 8
The Mixed Market for Preschool 22
San Francisco’s Preschool For All Program 34
Policy Recommendations and Limitations 63
Conclusion 72
List of Acronyms
ASQ Ages and Stages Questionnaire
CSPP California State Preschool Program
DRDP Desired Results Developmental Profile
ECE Early Childhood Education
ERS Environment Rating Scale
FCCH Family Child Care Home
NIEER National Institute for Early Education Research
PFA Preschool For All
PKFLP Prekindergarten and Family Literacy Program
QRIS Quality Rating and Improvement System
RTELC Race to the Top – Early Learning Challenge
SFUSD San Francisco Unified School District
SPP State Preschool Program
Special thanks to Professors David Kirp and Alan Karras for their guidance on this project and
their commitment to teaching
! $!
“Justice is the first virtue of social institutions, as truth is of systems of thought. A theory
however elegant and economical must be rejected or revised if it is untrue; likewise laws and
institutions no matter how efficient and well-arranged must be reformed or abolished if they are
unjust.”
! John Rawls, A Theory of Justice
This story begins with Max Vasilio, a four year old enrolled at Capp Street Head Start
Center. Located in the heart of the Mission District in San Francisco, Max’s preschool is one of
nine child development centers operated by Mission Neighborhood Centers, Inc. The
organization was established in 1959 as a means of consolidating local community centers and
has since specialized in child development and youth services. These centers throughout the
Mission serve as delegate agencies for San Francisco Head Start, offering services to more than
380 economically disadvantaged children and their families. Max’s preschool also partners with
the city’s Preschool For All (PFA) program, a citywide initiative that aims to provide all of San
Francisco’s four year olds with a quality preschool education.
Max is finishing his final months of preschool as he prepares to transition to kindergarten
next year. Mrs. Vasilio had nothing but praise for the program. “It’s good for the kids, and Max
gets to learn English,” she said. 85% of the families at Max’s school are recent US immigrant
families whose primary language is Spanish.1
Through a bilingual curriculum, Max is able to
build on his native language and learn English as a second language. Like many preschools
throughout San Francisco, Mission Neighborhood Centers’ partnership with the PFA program
has enabled it to provide quality and affordable preschool to hundreds of children. PFA’s
financial support and quality improvements to Mission Neighborhood Centers have opened the
door for Max and many others to receive a quality preschool education. Mrs. Vasilio pays no
!!!!!!!!!!!!!!!!!!!!!!!!!!!!!!!!!!!!!!!!!!!!!!!!!!!!!!!!
1
"Mission Head Start." Mission Neighborhood Centers, Inc.2014. www.mncsf.org.
! %!
cost for her son’s preschool, and the center even provides her with various family services and
bimonthly food distribution. “San Francisco is expensive, but Max’s school helps us stay in the
city,” Mrs. Vasilio said as she collected her free produce. Without subsidized early education,
many families cannot afford to live in the city let alone send their children to quality preschool.
Preschool policy impacts thousands of children like Max throughout the state of
California. In the absence of affordable and quality preschool programs, many families either
forego sending their child to preschool or settle for schools that fail to meet acceptable quality
standards. The inequities in access to quality preschool result in alarming gaps in school
readiness between children from low and high-income families. By kindergarten and first grade,
a disproportionate number of children from low-income families, the majority of whom are
Black and Hispanic, are already behind their wealthier peers.
Access to quality preschool is critical in ensuring that all children are prepared for their
primary education. The benefits of preschool are extensive and well documented: children who
receive a high quality preschool education have higher high school and college graduation rates,
are less likely to be held back or become involved in crime, and even earn higher salaries in their
careers.2
By developing and refining key social and academic skills for three and four year olds,
preschool prepares children for future development and learning; in the absence of preschool
learning, children forego numerous benefits and begin their academic careers well behind their
peers.
In spite of extensive research on the benefits of preschool, access to quality programs
remains limited for California’s three and four year olds, especially for children from low-
income families. Preschool policy is extremely political, and there are a number of arguments
!!!!!!!!!!!!!!!!!!!!!!!!!!!!!!!!!!!!!!!!!!!!!!!!!!!!!!!!
2
"Research Shows: The Benefits of High Quality Learning." Early Edge California. 2015. http://www.earlyedgecalifornia.org/resources/research-
-studies/making-the-case.html.
! &!
both for and against state preschool expansion. This paper provides an introduction to the
different viewpoints on preschool expansion in California that ultimately shape the preschool
policy debate. These arguments are broken down into the economic and political framing of
preschool policy in California. This includes but is not limited to discussions of preschool as an
economic investment and the role of government in expanding access to quality preschool
programs. The paper then offers an overview of the current mixed market for preschool in
California, which includes a variety of public and private programs. The overview and analysis
of the market for preschool offers an outline of the different programs families can send their
children to as well as insight into the supply and demand for public and private options. This
section argues that the current mixed market for preschool is of mixed quality; there are key
areas of market failure that require government to fix, namely increasing access to quality
preschool for low-income families.
Using this overview of preschool policy framing and the mixed market for preschool, the
paper then provides a case study of San Francisco’s Preschool For All initiative. PFA is one
example of a universal preschool policy that has focused explicitly on increasing access to
quality preschool programs for all four year olds in the city, but especially children from low-
income families. The analysis of PFA and its impact over the past decade concentrates on
funding, quality, access, and potential areas for improvement, such as expanding the program to
incorporate three year olds. By providing an in depth analysis of PFA, this paper offers one
policy model for increasing preschool access and quality for all children but particularly for
those most in need and who stand to benefit the greatest. The benefits of preschool are too great
and the stakes too high for any child to miss out on a quality preschool education. Access to
quality preschool is a right, not a privilege. The state has an obligation to fill the gaps in access
! '!
to preschool that exist in the current market and ensure all children’s right to a fair start to their
education. This paper analyzes the policy frameworks and market for preschool to see how the
state of California can increase access to quality preschool for all of its three and four year olds.
The PFA initiative in San Francisco shows the potential for policy to increase access to
preschool without jeopardizing quality and serves as one possible model for creating a more just
and inclusive preschool system in California.
Methodology
The methodologies employed in this paper include interviews, text analysis of media
discourse, and quantitative and qualitative data analysis. These research methodologies were
used to support the central goal of this paper: to provide insight into preschool policy in
California and to point out the potential for policy to increase access to quality preschool for all
children, but especially those from low-income families. Interviews cited throughout this paper
include personal interviews with policy officials, members of the Preschool For All program in
San Francisco, and families who currently send their children to a PFA partner preschool. The
interviews directly cited in the paper were all conducted through an informal interview process;
conversations with policy advisors, officials, and families were intended to generate a dialogue
regarding preschool policy in California, paying close attention to the topics of access and
quality. Accordingly, there was no formal questionnaire used in interviews with Scott Moore,
Chief Policy Advisor at Early Edge California, Matthew Rector, Program Administrator for
PFA, Xavier Morales, Data Analyst for PFA, and families currently participating in the PFA
program in San Francisco, which are cited throughout the paper.
! (!
In order to observe trends in media discourse surrounding preschool policy in California,
I used data mining and text analysis. I collected a sample of 203 newspaper articles related to
preschool education in California. These articles were selected on the basis of relevance and
newspaper source. Each article selected is tagged by its respective newspaper source in the
“preschool education” category and was published between 2005 and present. Articles were not
discriminated on the basis of preschool policy level, meaning that the sample of articles includes
topics ranging from local to national preschool policy. All articles were sourced from the top ten
newspapers in California based on subscription rates, a list that includes the San Francisco
Chronicle, Los Angeles Times, Sacramento Bee, San Diego Union-Tribune, Fresno Bee, Orange
County Register, San Francisco Examiner, and the San Jose Mercury.3
Article content was then
mined on the basis of three criteria: most frequently used words, bigrams, and trigrams. This
criteria excludes stock words, such as articles and prepositions, which were removed in the data
mining process. Bigrams and trigrams refer to two and three word phrases, respectively, used in
the sample of articles. A full list of most frequently used words, bigrams and trigrams from the
sample can be found in the appendix.
Last, this paper uses qualitative and quantitative data analysis of both original and cited
data sets. Qualitative data analysis of cited sources includes more in depth exploration of data
sets in the chapter on the mixed market for preschool in California. The qualitative analysis of
cited sources such as the Rand Corporations series of reports on the nature and quality of
preschool and the National Institute for Early Education Research’s annual yearbooks offers
valuable data on the breakdown of the preschool market in California and state spending. Data
specific to PFA in San Francisco was prepared by First 5 SF and the PFA program and
!!!!!!!!!!!!!!!!!!!!!!!!!!!!!!!!!!!!!!!!!!!!!!!!!!!!!!!!
3
"Top 10 Daily California Newspapers." Cision. March 3, 2010.
!
! )!
forwarded to me for the purposes of this project. This includes tables that detail the enrollment of
four year olds in PFA programs versus Proposition H funding allocation, percent of children
enrolled in PFA preschools compared to non-PFA preschools based on family income, San
Francisco Quality Rating and Improvement System ratings by neighborhood, program funding
type, and the number of children enrolled in PFA preschools by neighborhood. Analysis of this
data provides essential information for better understanding the effectiveness of PFA as
measured through quality and access.
The chapter on San Francisco PFA also includes quantitative and qualitative analysis of
original data sets. Using the most recent Census data, I was able to break down San Francisco
neighborhoods with participating PFA preschools by median household income. I then compared
this data with tables on PFA preschool quality and child enrollment provided by First 5 and the
PFA program to see if a correlation exists between median household income and access to
quality preschool. Tables displaying the highest and lowest five neighborhoods by median
household income along with the number and percentage of children enrolled in PFA preschools
offer useful information on who the program is serving and the quality of preschools these
children are attending. Interviews, text analysis of media discourse, and data analysis comprise
the primary research methodologies employed in this paper and offer both qualitative and
quantitative data for better understanding the market for preschool, its gaps, and potential
policies for improving access to quality preschool for three and four year olds in California.
I. Literature Review
The changing dynamics of policy framing in California by both scholars and government
can be broken down into several categories, namely economics, the role of government, and
recent policy innovations. Within each of these categories are sometimes nuanced arguments in
! *!
support of or against preschool expansion initiatives. Within some of these categories, arguments
and scholarly works offer diametrically opposed views of Early Childhood Education (ECE). In
both cases, the following literature review presents the various opinions, arguments and
theoretical foundations of early education that very much shape the way in which preschool is
framed in policy debates throughout California. The literature included is meant to highlight the
predominant arguments for and against preschool expansion and to provide a foundation for
better understanding preschool policy in California.
An Economic Perspective
The issue of early education is often framed in economic terms. Economists use
cost/benefit analysis to assess whether or not various early education initiatives are sound policy.
While there is extensive literature and research on the matter, there is no consensus on the issue.
Economic perspectives on early education shape its framing by defining preschool as either a
positive or negative net investment. A number of scholars, journalists, and other professionals
offer the compelling argument that greater access to preschool will lead to long-term economic
growth, thereby framing preschool initiatives as a sound investment in California’s future.
For instance, Lynn Karoly argues in “Preschool Adequacy and Efficiency in California”
that quality preschool is a necessary investment in California’s children and in ensuring
economic growth moving forward. The author argues throughout that “benefits to government or
society will exceed program costs” with regard to quality preschool programs because said
initiatives will increase investment in human capital for children in families of all income levels.4
The Packard Foundation draws on previous Rand research reports in its support for initiatives
that expand access to preschool in California: $2.50 to every dollar would go back to the state if
!!!!!!!!!!!!!!!!!!!!!!!!!!!!!!!!!!!!!!!!!!!!!!!!!!!!!!!!
4
Karoly, Lynn. "Preschool Adequacy and Efficiency in California." RAND Corporation, 2009.
! "+!
universal preschool became policy.5
This is a conservative estimate for economic Nobel laureate
James Heckman, who argues that every dollar spent on preschool offers a return of seven dollars
to society.6
Their framing of the issue is straightforward – preschool benefits the state economy
and represents a positive investment opportunity in California’s future.
Karoly and Bigelow expand on the economic framing of preschool in California. The
authors again suggest that preschool offers the state a positive net investment. More specifically,
they argue the previous estimates of economic return to the state are undervalued because they
fail to incorporate other social benefits that result from attending preschool. Increased access to
high-quality preschool reduces crime and dependence on public welfare as well as increases
health and labor force participation.7
In turn, these benefits offer positive returns to the state and
support calls to expand access to quality preschool programs.
Scott Moore, the former executive director of the California Early Learning Advisory
Council and current chief policy advisor at Early Edge California, offers a direct and transparent
explanation of his support for state-sponsored preschool. Much like the aforementioned authors,
Moore frames preschool as an economic investment, but goes a step further in suggesting that
not investing in it is equivalent to “mortgaging our future.”8
Moore addresses opponents of
preschool expansion, namely those who bring up fiscal constraints and economic instability as
counterarguments, by arguing that early education is in fact the best area for state investment in
terms of improving the economy moving forward. In emphasizing that “the best return on our
!!!!!!!!!!!!!!!!!!!!!!!!!!!!!!!!!!!!!!!!!!!!!!!!!!!!!!!!
5
"Preschool Adequacy and Efficiency in California: Issues, Policy Options, and Recommendations." The David and Lucile Packard Foundation.
January 1, 2009.
6
!Kirp, David. "California Should Give All Kids the Pre-K Advantage." Los Angeles Times, January 1, 2014.!
7
Karoly, Lynn, and James Bigelow. "The Economics of Investing in Universal Preschool in California." RAND Corporation, 2005.
http://www.rand.org/pubs/monographs/MG349z1.html.
8
Mongeau, Lillian. "Not Investing in Preschool Is 'Mortgaging Our Future'"EdSource, March 11, 2013.
! ""!
investment is early education,” Moore offers a very basic economic framework for better
understanding the potential benefits of expanding quality preschool programs.9
While numerous articles and reports tout the economic benefits of investing in preschool,
there is a tremendous amount of dissent that also uses economics to justify their viewpoints. As
with almost any policy involving taxes and additional state spending, the issue has become quite
contentious, especially after the Great Recession when California was struggling to manage its
budget. It should already be apparent that, because spending and taxes are highly sensitive
political issues, the economics and politics of preschool expansion do not always coincide and
point in the same policy direction.
Those against state expansion of preschool use their own economic data in framing
policy. Michael Boskin, professor of economics at Stanford University, labels preschool
expansion initiatives as pet projects for state government. He states that increased state spending
on preschool and, specifically, universal pre-K is poor spending and tax policy.10
Instead of
focusing on the investment in human capital, as the aforementioned authors in favor of preschool
expansion do, Boskin argues that the likely increase in sales or income tax (or both) will further
detract from the California economy and discourage business investment. From a conservative
economic perspective, Boskin points out that increased spending on preschool is fiscally
irresponsible and unsustainable. By reducing the incentives for businesses and firms to operate in
California, increased taxes and spending will result in capital flight from the state economy.11
In her piece “Is Universal Preschool beneficial,” Lisa Snell evokes similar economic
concern in her framing of ECE and preschool in California. Snell contrasts sharply with the view
!!!!!!!!!!!!!!!!!!!!!!!!!!!!!!!!!!!!!!!!!!!!!!!!!!!!!!!!
9
Ibid.
10
Boskin, Michael. "Quit Taxing the Rich to Fund Your Pet Projects." Los Angeles Times, May 1, 2006. Note: pre-K is different from preschool
in that all pre-K programs have program standards and focus specifically on school readiness. Pre-K programs serve three and four year olds,
which is usually the case for preschool programs but not always. In general, pre-K programs are associated with higher quality learning
environments than preschool, although this is not always the case.
11
Ibid.
! "#!
that increased state investment in preschool will actually promise a return on investment. Snell
argues that it is will cost taxpayers billions of dollars to expand preschool, and adds that many of
its benefits are overestimated by think-tanks like Rand.12
Furthermore, the author’s work
suggests that optimistic economic forecasts leave out the state’s track record in maintaining a
fiscally responsible budget. As such, the potential economic benefits of preschool are heavily
outweighed by the economic impacts of increased taxes and state spending.
Still, the economic framing of preschool policy in California is not limited to the
traditional liberal and conservative viewpoints just mentioned. While cost/benefit analyses play a
crucial role in the framing of early education, calls for greater efficiency and proper management
of programs already in place also have a significant role in the framing of preschool policy. For
instance, Loeb, Bryk and Hanushek argue that “the ways in which the available resources” are
used matter most in increasing the return on the investment in early education (as well as primary
education).13
The authors suggest that in framing the debate on preschool expansion, policy-
makers should focus less on investment or divestment and more on using resources efficiently
for programs already in place. They further contend that preschool programs “spend money as
the regulations demand, not necessarily to meet the needs of their students.”14
Focusing solely on
the return on investment can detract from efficiency. Accordingly, any economic justification for
preschool expansion must first address the proper allocation of resources and efficient use of
these resources already supporting programs.
Role of Government
!!!!!!!!!!!!!!!!!!!!!!!!!!!!!!!!!!!!!!!!!!!!!!!!!!!!!!!!
12
Burke, Lindsey, and Lisa Snell. "Universal Pre-K May Not Be as Good as It Sounds." Reason Foundation, 2014.
http://reason.org/news/show/universal-pre-k-may-not-be-as-good.
13
Loeb, Susanna, Anthony Bryk, and Eric Hanushek. Getting Down to Facts: School Finance and Governance in California. Stanford
University, 2007: 7.
14
Ibid.
! "$!
The scope of preschool policy depends on what is considered to be the proper role of the
state: is access to quality preschool a responsibility of the state, and what role should government
play in the market for preschool? Much of the literature regarding this topic is highly political
and draws on theoretical foundations of the role of the state. The existing body of research and
literature highlights the fact that ideology, specifically on the role of government, is inseparable
from the issue of increasing access to quality preschool.
“Preschool For All” and several other articles published by the Goldwater Institute, a
libertarian policy think tank, address supporters of preschool expansion in California as “nanny-
statists.”15
The authors borrow the term “nanny-statism” from previous political debates (such as
Head Start in the 1960s), in which conservatives felt the role of government was extending too
far into the realm of personal choice. The authors do not reject the notion that early education has
the potential to help many children, but rather that the means of creating such a system would
result in the largest “expansion of government into education since the creation of public
schools.”16
While preschool may indeed benefit children, the authors suggest that the magnitude
of government expansion is not justified for a problem that the current mixed market and
programs already in place can solve. Families and the current preschool system should account
for child development and school readiness, as the Goldwater Institute claims, not additional
government expansion.
In a similar fashion, Olsen and Snell characterize the expansion of preschool and ultimate
adoption of universal preschool in California as “de facto institutionalization” and an
“entitlement program that subsidizes the preschool choices of middleclass and wealthy
!!!!!!!!!!!!!!!!!!!!!!!!!!!!!!!!!!!!!!!!!!!!!!!!!!!!!!!!
15
"Preschool For All!" Goldwater Institute. October 8, 2007. http://goldwaterinstitute.org/article/preschool-all-0.
16
Ibid.
! "%!
families.”17
In this way, the authors expand on anti-early education arguments by incorporating
market and limited government ideology. The current market for preschool is mixed, meaning
children can receive their preschool education from either publicly supported or private
preschools.18
However, the authors argue that preschool expansion in California would
completely restructure the market by creating a state controlled monopoly and thereby limit
families’ freedom of choice. The extension of state would impede the already efficient
functioning of the mixed market for preschool and allow state government to make decisions that
should otherwise be limited to family discretion.
Los Angeles Times reporter Karin Klein offers another critical perspective on preschool.
She denounces calls for preschool expansion in California, raising concerns over the potential for
a “scary preschool utopia.”19
Her argument is based on the ideological assumption that state
government has no right to obstruct or substitute for family choice. Rather than building
bureaucracy, Californians should focus on building better families.20
Klein does not refute the
benefits of ECE and preschool specifically; instead, she suggests that government is already
doing enough to promote access. Klein holds that the current state-market relationship has led to
an efficient preschool system and that less emphasis should be placed on state-led preschool
expansion.
Others, such as David Kirp of UC Berkeley’s Goldman School of Public Policy, view
access to quality preschool as a primary responsibility of the state. From his numerous articles,
such as “California Should Give All Kids the Pre-K Advantage,” he argues that the state is
!!!!!!!!!!!!!!!!!!!!!!!!!!!!!!!!!!!!!!!!!!!!!!!!!!!!!!!!
17
Olsen, Darcy, and Lisa Snell. "Assessing Proposals for Preschool and Kindergarten." Reason Foundation, 2006.
http://reason.org/news/show/assessing-proposals-for-presch.
18
Note: please see chapter two, “The Mixed Market for Preschool,” for an in depth explanation and analysis of the market for preschool in
California.!!
19
Klein, Karin. "Scary Preschool Utopia." Los Angeles Times, June 5, 2005.
20
Ibid.
! "&!
responsible for leveling “the playing field for hundreds of thousands of poor children.”21
In
reviewing the array of benefits that come with a quality preschool education, such as increased
graduation rates and participation in higher education, Kirp suggests that the government should
ensure the right for all children to have access to quality preschool programs. On a more
ideological level, Kirp holds that the state has a responsibility in addressing poverty, and state-
sponsored early education offers one such way to ensure that poverty is not destiny.22
The issue
of ECE is not just about freedom of choice or nanny-statism. Preschool policy begs the all-
important question of who is responsible for solving some of the grave inequities that exist in
society. According to Kirp, the state can be the principal agent in reducing such inequities, and
expanding access to preschool offers one policy area that can help to accomplish this.
Education reporter Sarah Garland also frames the issue of preschool expansion as a state
responsibility in narrowing the well-known and reported gap between students in California. In
her report, the author highlights the fact that the achievement gap starts early in California; in
fact, studies have shown that an achievement gap exists before children even begin attending
school.23
As a result, Garland points to increased access to quality preschool as one possible state
solution for creating a more equitable education system – one that addresses inequalities in
access that exist between different racial and socioeconomic groups. By expanding and
improving the preschool quality, the state of California may better fulfill its responsibility of
providing an equitable and just education system that offers all children a fair chance to succeed.
Indeed, preschool policy can be framed as a matter of the state ensuring fairness and
justice in education for all children in California. Bernstein, a political and policy correspondent
for Reuters, identifies preschool as critical in upholding all kids’ right to a fair start. She notes
!!!!!!!!!!!!!!!!!!!!!!!!!!!!!!!!!!!!!!!!!!!!!!!!!!!!!!!!
21
Kirp, David. 2014.
22
Ibid.
23
Garland, Sarah. "More, Better Early Education Could Help Close California's Achievement Gap." The Hechinger Report, October 24, 2011.
! "'!
that “higher income families are already making sure their children have access” to high quality
early education; it should be up to the state to ensure access to the many families who cannot
afford such a luxury.24
Bernstein suggests that the state is not only responsible for closing the
achievement gap in California, but is the only viable actor in closing the gap. The market alone
will not address the inequities inherent in the current system. The significance of preschool
policy is framed such that access to quality preschool is a right, not a privilege, of all children
and a direct obligation of the state.
Policy analyst Linda Jacobson expands on this framework in her comprehensive report,
“On The Cusp in California.” She offers policy recommendations on the primary grounds that
the state “can- and should- be” doing much more to ensure equal access to early learning
experiences.25
In addressing the discrepancies in access between high and low-income families,
Jacobson specifically calls on the state to expand access to preschool as a means of closing the
achievement gap and improving education for economically disadvantaged families. Throughout
the report, Jacobson draws on disparities in access, quality and inequitable distribution to
emphasize the failure of state government in providing a fair start for many children in
California.26
A social justice perspective is implicit in Jacobson’s report: it is the state’s
responsibility to provide preschool to children who need it most, namely low-income families.
State officials have a responsibility to show leadership and to advance preschool and other ECE
reforms in California.27
For Jacobson, preschool expansion offers the state a concrete opportunity
to narrow the opportunity gap between high and low-income families and ultimately reduce
!!!!!!!!!!!!!!!!!!!!!!!!!!!!!!!!!!!!!!!!!!!!!!!!!!!!!!!!
24
Bernstein, Sharon. "In Newly Solvent California, Dems Propose Free Preschool." Huffington Post, January 7, 2014.
25
Jacobson, Linda. "On The Cusp in California: How PreK-3rd Strategies Could Improve Education in the Golden State." New America
Foundation, 2009: 3.
26
Ibid.
27
Ibid, 33.
! "(!
poverty. The opportunity to combat educational inequities inherent in the system should not be
wasted, especially given the tremendous body of research touting the benefits of preschool.
The Sandbox Investment by Kirp provides a narrative of the ECE movement throughout
America but devotes several portions specifically to California. While he addresses the views of
prominent members involved in the preschool policy debate in California such as Fuller, Snell,
Hill-Scott and Boskin, Kirp ultimately acknowledges the significance of regulation in the
promotion and expansion of quality preschool. He suggests that “competition can strengthen
quality… but only if parents have good information and government sets sensible standards”; in
addition, an unregulated market for preschool will not increase the availability of usable
information to families and will, in all likelihood, hinder the quality of education for most
children.28
Kirp recognizes the importance of the state in facilitating meaningful change in
preschool policy that promotes both access and quality. The author’s work also highlights the
relevance of preschool policy in California politics. Preschool is now a prominent policy issue in
California state politics that all policy-makers are well aware of. By providing a narrative of the
preschool debate in California, Kirp reminds us that preschool policy needs to focus on kids’
future rather than politics. The importance of politics in expanding access to preschool cannot be
stressed enough, but the far-reaching impact of comprehensive preschool reform reiterates the
need to overcome political gridlock.
Bruce Fuller, Alejandra Livas and Margaret Bridges present the case for a more
decentralized approach in their report on how to expand and improve preschool in California.
The authors, all prominent academics in the field of ECE, point out that policy options are not
limited to maintaining the status quo of a mixed preschool market or expanding to a state-
controlled market. Instead, the authors contend that decentralizing early education policy may
!!!!!!!!!!!!!!!!!!!!!!!!!!!!!!!!!!!!!!!!!!!!!!!!!!!!!!!!
28
Kirp, David. The Sandbox Investment: The Preschool Movement and Kids-First Politics. Cambridge: Harvard University Press, 2007:222-223.
! ")!
address flaws in the system, namely gaps in access and quality. The report suggests, “the ideal
system from a parent’s vantage point would be a single and inviting point of entry”; in other
words, a more efficient system might entail localized options from either government, private, or
community organizations.29
The authors address the pros and cons of the status quo and
potential for universal preschool while embracing a more decentralized policy framework. They
claim the current mixed market fails to address quality disparities between communities while
state-controlled preschool would likely increase standardization and uniformity in early
education.30
On the other hand, decentralizing early education may consolidate programs and
simplify the process for both families and organizations by county.
Fuller’s book, Standardized Childhood, delves deeper into the role of government in
promoting promoting. Most importantly, the author frames the role of government as one that
increasingly must be defined by decentralization in California. In this way, Fuller is not
questioning whether the government has a role, but which kind of role the government has in
proposing initiatives and implementing programs.31
He addresses the primary concern of many
limited government advocates by stating that preschool policy debates should incorporate
democratic discussion over how to “strengthen the capacity of families” so they may be better
able to make decisions for themselves.32
The author warns against the possibility of a state-
controlled early education system and contends that the extent of government intervention needs
to be limited. A state-controlled system would result in the standardization of education and
become another entitlement program that fails to close achievement gaps and reduce inequities in
education. Accordingly, Fuller suggests that the role of government should be to support
!!!!!!!!!!!!!!!!!!!!!!!!!!!!!!!!!!!!!!!!!!!!!!!!!!!!!!!!
29
Fuller, Bruce, Alejandra Livas, and Margaret Bridges. "How to Expand and Improve Preschool in California." Policy Analysis for California
Education, 2006:21.
30
Ibid.
31
Fuller, Bruce. Standardized Childhood. Stanford: Stanford University Press, 2007: 150.
32
Ibid. 274.
! "*!
collective action locally. More specifically, decentralizing early education policy and programs
to local counties would lead to “an easier-to-access, higher quality network of organizations and
caregivers.” 33
Fuller’s suggested preschool policies frame preschool as an opportunity for the
state to support and nurture more local, culturally based early education programs rather than
establish its own universal system of preschool.
Innovative Policy
Public policy and especially issues such as early childhood education are dynamic:
policymakers, academics, and experts in the field are always looking for solutions to social
issues or, for the purposes of this research, the best policy frameworks for either expanding or
contracting state-supported preschools in California. San Francisco’s Preschool For All (PFA)
program helps to reframe the preschool policy debate. PFA offers an example of policy with an
explicit mission to increase access to all children in San Francisco, but especially low-income
families. The program’s demonstrated impact on increasing access to quality preschool
highlights the importance of preschool policy and its potential to transform the educational
experience and opportunities of children throughout the city. The existing body of research and
policy analysis on this particular program is limited, offering one area for greater research and
analysis.
Jill Tucker, an education reporter for the San Francisco Chronicle, highlights PFA’s
ability to counter some of the previously mentioned arguments against preschool expansion. She
notes the program’s high quality standards and financial support of under-resourced preschools
in the city. Tucker also alludes to the program’s funding of both public and private preschools
and family centers. By working within the mixed market for preschool in San Francisco, PFA’s
!!!!!!!!!!!!!!!!!!!!!!!!!!!!!!!!!!!!!!!!!!!!!!!!!!!!!!!!
33
Ibid. 285.
! #+!
partnerships with a variety of program types has no doubt contributed to the city’s well above
average preschool enrollment rates.34
PFA has helped to increase enrollment for all children in
the city but particularly for children from economically disadvantaged families. Given this
success, the author contends that the program could serve as a model for other counties and even
the state in restructuring preschool and other early education policies. PFA’s ability to expand
access to quality preschool through both public and private partnerships while enhancing quality
may prove crucial in shifting the framework for preschool policy in California.
Text Analysis
In addition to this literature review, text analysis of a sample of over 200 newspaper
articles helps to lay the foundation for better understanding preschool policy in California. The
media discourse analysis included in this paper gives insight into the political rhetoric of
preschool policy. It also highlights some of the major areas of discussion, namely financing
preschool, which groups need preschool services, and the quality of programs. For example, how
to finance preschool initiatives is clearly an integral part of the policy discussion. The word
“budget” is used 338 times in the sample, and “money” and “funding” are used 243 and 205
times, respectively. Given California’s recent budget woes and recovery from the recession, it
makes sense that these words are used so frequently in preschool policy discourse. This further
emphasizes the role of economics in preschool policy. Both supporters and opponents of
preschool expansion draw on economic arguments, usually that preschool expansion is either
fiscally irresponsible or a positive investment in the state’s future.
Moreover, issues of access and quality are apparent in the discourse. “Income” is used
333 times, and “Low-income Families” is a top bigram and trigram with regard to frequency.
!!!!!!!!!!!!!!!!!!!!!!!!!!!!!!!!!!!!!!!!!!!!!!!!!!!!!!!!
34
Ibid.!
! #"!
This indicates that much of the discourse surrounding preschool policy includes discussions over
who is in need of access to ECE. Discrepancies in preschool participation rates based on family
income persist, and low-income families in California have less access to quality preschool
programs.35
“Universal” is used 182 times and “Universal Preschool” is a top bigram; “access”
itself is mentioned ninety-eight times in the text. The frequency of these terms in the discourse
suggests that certain groups are in need of greater access to preschool. It is evident, too, that low
and middle-income families are central to the policy debate. Preschool expansion and calls for
universal preschool center around leveling the playing field and increasing access for all of
California’s children, but especially children from economically disadvantaged families who
stand to gain the most from such policies.36
Disparities in access are apparent in the discourse
and are inherently linked to the role of the state. Universal and targeted approaches to increasing
access to preschool involve the state in some capacity, and the “State,” “State Preschool,” and
“Public Preschool” are amongst the most frequently used terms. The role of government is a
major issue in preschool policy, and the media discourse affirms the importance of the state in
promoting access.
Last, quality is commonly used in preschool discourse. “Quality” is used 215 times in the
sample of articles, and “High Quality” and “Quality Preschool” are most frequently used
bigrams. The use of quality in discourse is critical – increased access to preschool will have a
negligible impact if quality is not high. The quality of preschool programs is key, and the
frequency of “quality” terms in the discourse points to its significance in policy discussions. Text
analysis of media discourse shows that access and quality are dominant points of discussion in
preschool policy debates. The role of the state and economics are also main lenses through which
!!!!!!!!!!!!!!!!!!!!!!!!!!!!!!!!!!!!!!!!!!!!!!!!!!!!!!!!
35
Note: please see “Gaps in the Mixed Market” for specific details on preschool participation rates by income in California.
$'!Schumacher, Kristin. "Reinvesting in California’s Children: Preschool for All?" California Budget and Policy Center. May 7, 2014.!
! ##!
preschool policy is framed. The full list of top words, bigrams, and trigrams can be found in the
appendix.
By breaking preschool policy down by economics, the role of the state, and policy
innovations and analyzing media discourse, the reader is more easily able to understand the key
frameworks of preschool policy in California. Whether viewing preschool expansion as a sound
economic investment or unsubstantiated extension of the state, these perspectives offer insight
into the changing dynamics of the relationship between state and market and its influence on
preschool policy. Furthermore, the issue of ECE offers one area for new policy innovations and
state-market dynamics. The literature provides theoretical, qualitative and quantitative support
for a wide range of viewpoints on preschool. The diversity of opinions suggests that a consensus
on preschool policy is far from being reached in California. It also calls for more in depth
analysis on the market for preschool in the hopes of highlighting potential areas for improvement
moving forward.
II. The Mixed-Market for Preschool
The history of California’s mixed market for preschool dates back to 1965. During this
time, the state of California created the State Preschool Program (SPP), which was created in the
hopes of better serving at-risk children who did not otherwise have access to quality preschool.37
The program’s implementation was in part facilitated by nationwide efforts such as Head Start,
which sought to improve child services and access to preschool by placing particular emphasis
on low-income families and families living below the poverty line. Prior to California’s SPP,
preschools did not receive funding from the state; instead, center-based programs were either
!!!!!!!!!!!!!!!!!!!!!!!!!!!!!!!!!!!!!!!!!!!!!!!!!!!!!!!!
37
Barnett, Stephen, Megan Carolan, James Squires, and Kirsty Brown. "The State of Preschool 2013." National Institute for Early Education
Research, 2013. 36.
! #$!
privately funded or funded by local initiatives. Thus, it was not until 1965 that California’s
market for preschool education became mixed, offering both state-funded and private options for
families to choose from. The SPP provided a basis for state preschool education policy, helping
to shape the programs that currently make up state-funded options offered within California’s
mixed market for preschool.
Fast-forwarding to 2007, the state created the Prekindergarten and Family Literacy
Program (PKFLP), offering half and full day services for families at or below seventy percent of
state median income.38
Shaped after the SPP, the PKFLP’s scope expanded to include an
additional literacy component. By 2008, the state of California streamlined its many ECE
programs, including the SPP, PKFLP, and General Child Care programs such as First 5
California, to create the California State Preschool Program (CSPP).39
The CSPP consolidated
funding for the aforementioned state-funded programs that serve eligible three and four year olds
across the state. The CSPP is now the largest state-funded preschool program in the country; it
provides services ranging from meals for children to parent education and is administered
through local education agencies, colleges, and nonprofits.40
While the CSPP provides an
example of the state’s contributions to the mixed market for preschool, looking at actual
enrollment rates for private, public, and home-based preschool education presents a more holistic
framework for understanding the preschool system in California.
Because California’s market for preschool consists of both public and private options, it
is difficult to find comprehensive data that accounts for children participating in various types of
center-based programs and home-based programs such as Family Child Care Homes. A series of
Rand reports on preschool quality and efficiency gives extensive data on participation rates and
!!!!!!!!!!!!!!!!!!!!!!!!!!!!!!!!!!!!!!!!!!!!!!!!!!!!!!!!
38
Ibid. 35.!
39
Ibid.
40
"Child Care and Development Programs." California Department of Education. March 20, 2015.
http://www.cde.ca.gov/sp/cd/op/cdprograms.asp.
! #%!
the market for preschool in California. Their work is a series of technical reports based on the
organization’s own representative sample of preschool age children in California, including three
and four year olds. The data sample is intended to provide further insight into the types of
programs used by families throughout the state. The reports also detail types of funding
associated with each program, in turn indicating the socioeconomic factors that may go into a
family’s decision of which type of preschool to send their child to.
It is critical to note that more than half of California’s preschoolers, including three and
four year olds, attend center-based preschool programs.41
These programs, as defined by Karoly
et al., include Head Start Centers, preschools, prekindergartens, nursery schools, and child-care
centers. They may also be defined as programs that are not home-based with regard to either the
child or provider’s home.42
Table 1.0 displays program arrangements for preschool-age children,
categorizing the setting types as center-based, relative care, or nonrelative care.
43
Table 1.0 displays the distribution of early childhood education programs for three and four year old children. The study was conducted with
sample size 2,025 children. Of those 2,025 children, 1,016 were three years old and 1,009 were four years old.
As Table 1.0 shows, the majority of surveyed parents, about fifty-nine percent, reported sending
their child to a center-based program compared to twenty percent and thirteen percent for relative
and nonrelative care, respectively.44
The total distribution of children attending center-based
programs is brought down by three year olds, a group that has lower participation rates in all
!!!!!!!!!!!!!!!!!!!!!!!!!!!!!!!!!!!!!!!!!!!!!!!!!!!!!!!!
41
"Most California Children Attend Center-Based Preschools; Educational Quality of Programs Falls Short." Rand Corporation, 2008.
42
Karoly, Lynn, Bonnie Ghosh-Dastidar, Gail Zellman, Michal Perlman, and Lynda Fernyhough, “Prepared to Learn: The Nature and Quality of
Early Care and Education for Preschool-Age Children in California.” RAND Corporation, 2008. 36.
43
Ibid. 40.
44
Ibid. 39.!
! #&!
local, state, and federal preschool programs. This discrepancy in three and four year old
preschool participation rates is consistent with other existing data on preschool participation
rates.
It is worth mentioning that the distribution of setting types for three and four year olds
does vary slightly with the data collected from providers rather than the families themselves.
Based on provider survey data, fifty-seven percent of four year olds and forty-two percent of
three year olds attend center-based programs.45
Altogether, the percentage of both three and four
year olds participating in center-based programs is equal to roughly half of all children. In spite
of these minor variations, the main take-away from this data remains the same: the majority of
children attend center-based programs as opposed to home-based preschool. The demand for
center-based programs highlights the relevance of the market for preschool in both the private
and public sectors. Given the growing demand for center-based programs, it is especially
important to examine the distribution of setting types within the center-based category.
The breakdown in preschool participation for center-based programs offers a closer look
at the differences between public and private preschool attendance in California. Table 2.0
displays program type in center-based settings for preschool-age children including three and
four year olds.
46
Table 2.0. The above information is based on a sample size of 615. In contrast to previous tables included in this report, Table 2.0 includes
percentages that are based on survey data from preschool providers rather than households.
!!!!!!!!!!!!!!!!!!!!!!!!!!!!!!!!!!!!!!!!!!!!!!!!!!!!!!!!
45
Ibid. 80.
46
Ibid.
! #'!
In total, thirty-seven percent of three and four year olds attend publicly funded preschool.47
This
includes children enrolled in Head Start, Title V (i.e. California State Preschool), or public
school prekindergarten programs. Twenty percent of children are enrolled in private preschool
programs, twenty-seven percent in independent preschools or nursery schools, and sixteen
percent in child-care or other.48
The data also suggests that more four year olds are enrolled in
publicly funded programs compared to three year olds. While there is no dominant program type,
publicly funded program types represent the largest percentage of center-based programs. The
distribution in participation rates between private, independent, child-care/other, and publicly
funded preschools confirms the mixed nature of the market for preschool in California. In the
absence of a universal early education system, families in California are left with a number of
options regarding where to send their child to preschool that varies depending on program type,
cost, and affordability. For the most part, they prefer to send their children to center-based
programs and, within this, publicly funded programs that may offer free or reduced cost
preschool.
Still, tuition and accessibility of the aforementioned center-based programs is
inconclusive. Although the distribution of participation rates in center-based programs indicates
a mixed market for preschool in California, it does not entirely indicate which programs are
accessible to whom. A deeper analysis of program fees offers a more transparent view of the
market for preschool and which aspects of the market are serving whom. From Table 5.0 below,
it is evident that sixty-two percent of children attending preschool in center-based programs are
part of programs that charge a fee.49
This does not suggest that children attending programs with
!!!!!!!!!!!!!!!!!!!!!!!!!!!!!!!!!!!!!!!!!!!!!!!!!!!!!!!!
47
Ibid.
48
Ibid. 80. “Other” entails centers that provide preschool services but are not necessarily labeled as preschool. One example includes recreation-
center programs.!
49
Ibid. 83.
! #(!
tuition all pay the same amount; rather, the majority of programs that do charge a fee offer either
sliding-scale tuition, adjusted based on family income, or need-based scholarships.50
Thus, about
forty percent of three and four year olds enrolled in center-based programs attend preschools that
require no fee. These programs that require no fee predominantly consist of publicly funded
programs, such as Head Start, First 5, and Title V preschools.
51
Table 5.0. The information provided shows the percentage breakdown of programs included in the Rand study that charge fees or participate in
public subsidy programs. It is also important to note that these percentages are for center-based programs only and include statistics for both three
and four year olds. The table highlights that while the majority of programs charge a fee, there are still opportunities for alternative funding
through sliding-scale fees and need-based scholarships. This information will be especially relevant in analyzing the PFA program in San
Francisco, which provides services to programs that charge fees as well as participate in public subsidy programs.
The differences between programs with and without fees do not relate to either type of
school’s ability to accept public subsidies. Although sixty-two percent of schools charge fees,
more than eighty-five percent of center-based programs accept some form of public subsidies.52
These subsidies include but are not limited to vouchers, Head Start contracts, First 5 contracts,
!!!!!!!!!!!!!!!!!!!!!!!!!!!!!!!!!!!!!!!!!!!!!!!!!!!!!!!!
50
Ibid.!
51
Ibid.
52
Ibid.
! #)!
and other local or county school district subsidies. Table 5.0 looks mostly at fees and subsidies
for programs, but it does provide an estimate for the total percentage of three and four year olds
in center-based programs that are subsidized – just over thirty percent of total children enrolled.53
The dollar amounts of the subsidies received by those thirty percent remain uncertain, but the
data does offer critical insight into some of the factors that influence the distribution of
participation within private, public, independent, and other preschool programs.
The amount of subsidies and funding for public programs depends on government
funding at the local, state, and federal levels. Depending on its type, each program may be
eligible to receive funding from one or all levels of government. For instance, Head Start centers
receive federal funding since the program is a nationwide initiative; First 5 California centers
receive mostly state funding but, as is often the case, receive some funding from the counties
they serve. Since this section details the political economy of preschool in California, it is
important to pay special consideration to the state’s role in funding public programs.
Table 6.0 displays state spending per child enrolled in public programs from 2002 to
2013. State spending on preschool appears to have remained relatively constant between 2005
and 2008, with a slight decrease from roughly $4,200 per student to $4,000 occurring at the onset
of the Great Recession. The data included in Table 6.0 also suggests that state preschool
spending increased dramatically from 2009 to 2010 to just over $5,800 per child enrolled. It
should be cautioned that this apparent increase in state funding is a product of program
consolidation rather than an actual increase from previous years.54
The 2008 California State
Preschool Program Act streamlined funding for state preschool programs, including the
Prekindergarten Family Literacy Program and General Child Care Program, and was fully
!!!!!!!!!!!!!!!!!!!!!!!!!!!!!!!!!!!!!!!!!!!!!!!!!!!!!!!!
53
See Table 5.0
&%!Barnett, Stephen, Megan Carolan, James Squires, and Kirsty Brown. 35.!
! #*!
implemented in 2009. The ensuing increases in Table 6.0 represent consolidated funding from
the General Child Care program as well as stimulus money from the American Recovery and
Reinvestment Act.55
The decrease of over $1,000 in spending per child enrolled in preschool
from 2010 to 2012 reflects steep budget cuts as a result of the Great Recession.56
State preschool
spending has since recovered to pre-recession spending levels and has actually increased thanks
to grants from the Race to the Top Early Learning Challenge (RTELC) and the creation of
Transitional Kindergarten.57
California now ranks seventeenth out of fifty states in the NIEER’s
annual state spending and resource rankings.58
59
Table 6.0 displays California state spending from 2002 to 2013. Data is taken from the NIEER’s most recent preschool yearbook, which
provides an overview and analysis of preschool policy and its effectiveness. The data shows a spike in state spending between 2009 and 2010.
Although this indicates a dramatic increase in per student spending for preschool, the spike is in fact a result of program consolidation resulting
from the 2008 California State Preschool Program Act.
Gaps in the Mixed Market
In spite of the variety of center-based preschool programs, the mixed market for
preschool in its current state is far from promoting equal opportunity for all children in
California. A gap in access to quality preschool persists, disproportionately impacting low-
income families. According to the California Budget and Policy Center, nearly two-thirds of
!!!!!!!!!!!!!!!!!!!!!!!!!!!!!!!!!!!!!!!!!!!!!!!!!!!!!!!!
55
Ibid. 36.
56
Resmovits, Joy. "Preschool Funding Reached 'State Of Emergency' In 2012: NIEER Report."Huffington Post, April 29, 2013.
57
Barnett, Stephen, Megan Carolan, James Squires, and Kirsty Brown. 35.
58
Ibid.!
59
Ibid.
! $+!
low-income three and four year olds are not enrolled in center-based preschool programs.60
This
compares to fifty-six percent of higher-income three and four year olds who are enrolled in
preschool. Even children from families earning close to the state median income have lower
preschool participation rates than their higher-income peers.61
These statistics highlight a critical
trend in preschool participation rates: class matters, and a family’s income is a strong predictor
of a child’s enrollment in quality preschool programs.
The state of California has tried to address this gap in the preschool market through
various programs. While federal programs such as Head Start have offered preschool services for
families living below the poverty line since the 1960s, California has taken more recent steps to
help increase access to preschool for middle and low-income families. For instance, the CSPP
serves more than 200,000 three and four year olds from families earning less than seventy
percent of the state median income.62
The state’s transitional kindergarten program, which will
be discussed in further detail, offers older four year olds services regardless of family income. In
spite of these efforts, income remains a dominant factor in shaping who has access to quality
preschool. It is especially critical for the state to increase access to preschool for low-income
children given they are most at-risk for falling behind in school.63
Without further state action to
increase access to quality preschool for both low and middle income families, the positive
feedback loop continues – gaps in school readiness persist, and these children start primary
education already behind their wealthier classmates.
!!!!!!!!!!!!!!!!!!!!!!!!!!!!!!!!!!!!!!!!!!!!!!!!!!!!!!!!
60
Schumacher, Kristin. "Reinvesting in California’s Children: Preschool for All?" California Budget and Policy Center. May 7, 2014. Note:
preschool participation rates cited from the California Budget and Policy Center vary slightly compared to previously listed statistics sourced
from the Rand report, which claimed fifty-nine percent of three and four year olds are enrolled in center-based preschool programs. The variation
in data may result from research methodology and their respective sample populations. Moreover, the percentages cited here refer specifically to
participation rates based on income groups whereas the Rand study does not disclose the economic backgrounds of families included in its
sample. In spite of the variations in overall participation, both data sets suggest that a slight majority of California’s three and four year olds are
enrolled in center-based programs.
61
Ibid.
62
Ibid.
63
Ibid.
! $"!
Transitional Kindergarten
Until recently, the mixed market for early education in California neglected older four
year olds, whose kindergarten readiness varied significantly based on date of birth. Before 2010,
four year olds born in the fall on or before December 2nd
were eligible to attend public
kindergartens.64
While the date of birth requirements for kindergarten seem relatively harmless,
the policies in place before 2010 had a huge impact on the kindergarten readiness of many of the
state’s four year olds. More so than almost any other state, California children started
kindergarten at a younger age, which in turn affected children’s social, emotional, and cognitive
abilities in the classroom.65
The academic struggles and general lack of readiness on the part of
these four year olds presented a serious gap in the market for early education, one that required a
fix in the state’s early education policy.
In 2010, the state of California passed the Kindergarten Readiness Act, which pushed the
kindergarten entry date back from December to September. As a result, this policy ensures that
children enter kindergarten at age five.66
Most importantly, the law created Transitional
Kindergarten, a “developmentally appropriate curriculum aligned with kindergarten standards
and taught by credentialed teachers.”67
The cutoff date for kindergarten was phased in over a
period of three years and is now fully implemented. In 2014, transitional kindergarten served
134,000 four year olds, helping to close the previous gap in kindergarten readiness that persisted
for older four year olds. Transitional kindergarten so far appears to pose a win-win situation for
children and schools, who both stand to gain from increased kindergarten readiness. Transitional
kindergarten is also indicative of the state’s ability to correct failures in the mixed market for
early education that stem from state education policy as well as private preschool and
!!!!!!!!!!!!!!!!!!!!!!!!!!!!!!!!!!!!!!!!!!!!!!!!!!!!!!!!
64
"TK California." TK California: A Project of Early Edge California. 2015. http://www.tkcalifornia.org/.
65
Ibid.
66
Ibid.
67
Ibid.!
! $#!
kindergarten supply. The Kindergarten Readiness Act and its creation of transitional
kindergarten highlight a key addition to the preschool market in California, one that fills a
previous gap in state policy and renews the state’s commitment to its early learners.
68
Figure 1.0. This figure created by TK California provides visual aid to California’s transitional kindergarten program. The program has already
served thousands of four year olds and helped close a previous gap in state preschool policy.
Mixed Market Recap
There are several key takeaways from this overview of the market for preschool in
California. The data on center-based programs confirms that the market for preschool is indeed a
mixed system of mixed quality. While there is no majority program type, publicly funded
programs represent the largest percentage of center-based programs followed by private and
independent preschools. It is also evident that the majority of preschool-age children in
California attend center-based programs. Upward trends in center-based participation rates
indicate the growing demand for preschool education outside of the home and in general.
!!!!!!!!!!!!!!!!!!!!!!!!!!!!!!!!!!!!!!!!!!!!!!!!!!!!!!!!
68
!TK California." TK California: A Project of Early Edge California. 2015. http://www.tkcalifornia.org/.!
! $$!
Increasing participation in preschool still does not ensure quality, which can vary greatly from
program to program.69
The distribution of preschool participation rates does not entirely explain who has access
to different programs, but it does highlight discrepancies between high and low-income families.
Even though children from low-income families stand to gain the most from quality preschool
education, they have much lower enrollment rates than their higher-income peers. On top of this,
the preschool programs that low-income children are enrolled in tend to be of lower quality than
that of children from upper income families. This poses a serious challenge for local and state
education agencies, who must find a policy solution to increase access to quality preschool for
those families most in need.
State funding plays a critical role in the mixed market for preschool. California’s support
for early education is slightly above average in relation to the rest of the United States, leaving
plenty of room for improvement. Although sixty percent of center-based programs charge a fee
or tuition, the vast majority of centers accept some form of public subsidy. These numbers do not
offer in depth insight into the accessibility of preschool in California, but they do reaffirm the
importance of public funding and its potential to transform access.
This section has identified California’s preschool system as a mixed market of mixed
quality. Although a variety of programs exist and a slight majority of the state’s three and four
year olds are now enrolled in preschool, access to quality preschool, especially for low-income
families, remains an issue. As long as this gap in the market goes unaddressed, many of
California’s children will forego the benefits of preschool education and begin their schooling
well behind their peers from higher income families. There are local preschool initiatives that
have sought to address these gaps persisting in the market and state policy. San Francisco’s
!!!!!!!!!!!!!!!!!!!!!!!!!!!!!!!!!!!!!!!!!!!!!!!!!!!!!!!!
69
Karoly, Lynn. "Preschool Adequacy and Efficiency in California." RAND Corporation, 2009. 38.
! $%!
Preschool For All program is one example of a local policy initiative that has focused on
increasing access for all four year olds in the city and children from low-income families in
particular. As a universal preschool policy, San Francisco’s PFA program provides the state with
one policy model for improving access to preschool. The program also shows that preschool
policy can increase access for all children without jeopardizing quality as well as focus on
specific groups most in need of quality early education services.
III. San Francisco’s Preschool For All Initiative
Preschool policy discussions have taken on many faces, and the issue’s framing has
contributed to an array of policy proposals throughout California. There are several ways of
measuring the effectiveness of early education policies, and the arguments both for and against
expansion of state-supported early education offer a diverse set of approaches for analyzing
policy. Preschool policy can be measured by its long-term investment in children, accessibility to
low-income families, or program quality. Certainly, some of these aspects cannot be neglected –
an analysis of any education policy would be remiss if it did not address access and quality in
some shape or form. Because access and quality can be very ambiguous terms in and of
themselves, it is critical to clearly define how they will be used in this context. This section first
provides an introduction to San Francisco’s Preschool For All (PFA) program. It then analyzes
the program’s impact with specific regard to access and quality before offering recommendations
for the policy.
Access to early education has increased significantly in the past decade, and there are a
number of proposed local and state initiatives that champion preschool expansion. The previous
overview of the mixed market for preschool in California highlighted some of the gaps in access
! $&!
to quality preschool. Amidst calls for a decentralized system of preschool, increased
privatization, and universal state-run preschool, there is no consensus on which policies will
provide the highest level of access to quality preschool for all Californians. Policy-makers are
left to grapple with how to increase access efficiently and effectively and in a manner that does
not jeopardize quality.
The city of San Francisco’s PFA program offers one policy model for increasing access,
especially for low-income families, while enhancing quality. By exploring in depth the PFA
program, this paper identifies San Francisco PFA as one potential policy model for other
counties and the state as it tries to close gaps in access to quality preschool. Taking into account
quality, effectiveness, limitations, and areas for improvement, this analysis ultimately suggests
that universal preschool policies can increase access for all children while focusing particularly
on children most in need; this in turn fills a persisting gap in the market for preschool and levels
the playing field for all children as they begin their primary education.
Historical Overview
The story of the Preschool For All program begins in 2004 when San Francisco voters
passed Proposition H. Also referred to as the Great Schools Charter Amendment, Proposition H
appropriated money from the city’s General Fund, which is explicitly used for public services
such as public health and education.70
The proposition increased annual funding for preschool
and K-12 public school enrichment programs by sixty million dollars.71
More specifically, the
funds were distributed three ways: one third for San Francisco First 5 and preschool support, one
third for sports, libraries, arts, and music programs, and the last third for wellness centers,
!!!!!!!!!!!!!!!!!!!!!!!!!!!!!!!!!!!!!!!!!!!!!!!!!!!!!!!!
70
“Proposition H-Public Education Fund.” SPUR. March 1, 2004. http://www.spur.org/publications/voter-guide/2004-03-01/proposition-h-
public-education-fund
71
Ibid.!
! $'!
student support professionals, translation services, and peer resources.72
The proposition gained
significant voter support and political traction as a result of underperforming schools, relatively
low per pupil spending, and declining enrollment in San Francisco Unified School District
(SFUSD) schools stemming from a number of factors, including but not limited to dramatic
increases in the cost of living and gentrification. Although San Francisco’s high cost and
standard of living would seem to indicate substantial per pupil spending in the city’s public
schools, San Francisco, at the time, ranked thirty-fourth among forty-three city public school
districts of comparable size.73
The proposition’s passage in many ways represents San
Francisco’s renewed commitment to public education and growing interest in a quality ECE
system.
The third of Proposition H’s Public Education Enrichment Fund was designated to San
Francisco First 5 and its support for preschools, which ultimately led to the creation of a new
universal preschool program. San Francisco First 5’s new program, titled Preschool For All, was
created under a clear and concise mission: to provide quality preschool and family services to
San Francisco’s families regardless of income or socioeconomic background. Since its inception,
the program has sought to uphold its mission of promoting accessible and affordable preschool to
all four year olds in the city. It also aims to serve San Francisco’s most under-resourced families,
namely low-income and minority families.74
The program offers additional services for families beyond preschool education. PFA and
First 5 San Francisco have taken additional measures to provide resources and education to
families throughout San Francisco. The program’s Family Resource Center Initiative, which
began in 2009, offers families intensive support services and opportunities for community
!!!!!!!!!!!!!!!!!!!!!!!!!!!!!!!!!!!!!!!!!!!!!!!!!!!!!!!!
72
“Public Education Enrichment Fund.” San Francisco Unified School District. 2015. http://www.sfusd.edu/en/about-sfusd/voter-
initiatives/public-education-enrichment-fund.html
73
“Proposition H-Public Education Fund,” 2004.
74
“SF Family Resource Initiative Evaluation.” First 5 San Francisco. 2013. http://www.first5sf.org/programs/preschool-all.!
! $(!
development. This initiative within PFA focuses especially on building parents’ knowledge and
skills as a means of strengthening families and ensuring healthy childhoods.75
In accordance with
high quality early education, the Family Resource Initiative has undoubtedly helped to improve
family relationships, which is a key factor for children’s emotional and social development. The
initiative has served over 13,000 parents and children to date, the majority of whom are Latino.
According to a report by the San Francisco Department of Children and Human Services
Agency, more frequent visits to the center are associated with improvements in emotional well-
being and reductions in the risk of abuse.76
By offering workshops ranging from parenting
education to parent/child interaction groups, the initiative has had a clear impact on the
thousands of parents and children it has served since 2009.
PFA and partner initiatives like the Family Resource Center have made a tangible and
lasting impact on families in San Francisco. Around the time of Proposition H’s passing and
implementation, a study conducted by the Rand Corporation reported that less than fifteen
percent of children in California attend high quality preschool.77
More than eighty percent of
children in San Francisco now attend preschool, beating both the state and national participation
rates. The program has made significant strides in promoting access to economically
disadvantaged families. Prior to PFA, access to public preschool for free or reduced cost was
limited to families earning less than $35,000. In the absence of an income eligibility limit, PFA
has expanded access to quality preschool for all families in the city. According to Melissa Daar,
a San Francisco parent, “Preschool For All is helping us stay in the city.”78
For Daar and many
families throughout San Francisco, paying tuition upwards of $12,000 for quality preschool is
!!!!!!!!!!!!!!!!!!!!!!!!!!!!!!!!!!!!!!!!!!!!!!!!!!!!!!!!
75
“San Francisco Family Resource Center Initiative, Year 2 Evaluation.” First 5 San Francisco. July 2012.
http://www.first5sf.org/sites/default/files/page-files/11_frc_es.pdf.
76
Ibid.
77
Graff, Amy. “SF’s PFA Adds 10 New Sites.” SF Gate. June 4, 2009. http://blog.sfgate.com/sfmoms/2009/06/04/s-f-s-preschool-for-all-adds-
10-new-sites/.!
78
Ibid.
! $)!
simply not possible. By subsidizing the cost and imposing quality standards, San Francisco has
taken progressive measures to facilitate positive change in its preschool education system.
With PFA’s ten year authorization under Proposition H now coming to a close, it is an
especially critical time for an impact analysis of the program to better understand its strengths
and weaknesses as well as its ability to fulfill the program’s stated mission. This includes an
examination and analysis of the program’s effectiveness as determined through its ability to
promote access and quality. This paper addresses a central question surrounding preschool
expansion in San Francisco: is PFA increasing access to quality preschool for all children in San
Francisco, especially for children most in need?
Funding
Since the implementation of Proposition H in 2005, PFA has seen significant growth in
preschool enrollment rates amongst its partner sites as well as its allocation of funding from the
city. Before discussing trends in participation and the terms of partnering with PFA, it is
necessary to explain how PFA funds its services. From 2005 to 2015, the amount of funding for
PFA increased nearly tenfold. However, the funding for PFA has not been consistent, and both a
sustainable and predictable financial model remains to be seen.
In 2005, the program received $3.3 million, a budget that ultimately supported the
education of 561 four year olds in San Francisco.79
According to one study conducted by San
Francisco’s Department of Children, Youth, and Their Families, the average cost per child of
providing preschool in San Francisco falls around $8,800, with higher cost estimates associated
!!!!!!!!!!!!!!!!!!!!!!!!!!!!!!!!!!!!!!!!!!!!!!!!!!!!!!!!
79
Note: data was prepared by First 5 SF in 2013 and forwarded by PFA Data Analyst, Xavier Morales.
! $*!
with higher quality preschool programs.80
These numbers include administrative and staffing
costs, which make up between seventy and eighty percent of center-based programs’ budgets, as
well as quality enhancement measures and tuition subsidies or credits.81
At the time of the
program’s implementation in 2005 and the ensuing two years, the program expanded rapidly,
and its annual allocation of funds fell in line with the amounts stated under Proposition H.
Nonetheless, San Francisco, like most cities and states throughout the United States, experienced
budget shortfalls with the onset of the Great Recession in 2007-2008. SFUSD faced upwards of
$40 million in cuts, representing ten percent of its total annual budget.82
As a result, 2008 marked
the first year of the Preschool For All initiative in which program expenditures exceeded
revenue. Although PFA enrollment continued to increase during this time, its improvements in
access to preschool staggered. As portrayed in Figure 2.0, the discrepancy between actual and
statutory Proposition H funds for PFA peaked in 2010, with the program receiving only $14.7
million of the original $20 million set aside by the Public Education Enrichment Fund.83
From
this, PFA was forced to look elsewhere for funding and attain greater efficiency with the funds
they received from the city.
!!!!!!!!!!!!!!!!!!!!!!!!!!!!!!!!!!!!!!!!!!!!!!!!!!!!!!!!
80
Lucich, Mardi, and Kelly Lynch. “Cost Models of Three Types of Early Care and Education in San Francisco: What is the True Cost of High
Quality Care?” SF Department of Youth and Their Families. 2009. 3.
81
Ibid.
82
Tucker, Jill. “School Board Votes to Save Prop. H Cash for Shortfall.” SF Gate. January 23, 2008.
83
Note: data was prepared by First 5 SF in 2013 and forwarded by PFA Data Analyst, Xavier Morales.!
! %+!
84
Figure 2.0. In 2005, the passage of Proposition H promised PFA increased funding as the program expanded. However, the 2007-2008
financial recession forced the City of San Francisco to cut much of its education budget, resulting in the above discrepancy between actual and
promised funding for the Preschool For All program.
Because of the variations in city funding, PFA has had to seek additional funding
strategies and partnerships. Beginning in 2012, PFA started using its reserve funding for excess
expenditures stemming from budget shortfalls. In this coming year, the program is expected to
deplete the remainder of its reserve funds, meaning that over $5 million of reserve funding will
be used to cover excess expenditures.85
Although the program has received grants from
numerous state and federal entities, such as First 5 California and the Department of Education,
the program’s financial model is not self-sufficient or sustainable. Funding for the program
seemed especially uncertain moving forward given the expiration of Proposition H this year,
which in turn concludes PFA’s ten-year funding authorization.
!!!!!!!!!!!!!!!!!!!!!!!!!!!!!!!!!!!!!!!!!!!!!!!!!!!!!!!!
84
Ibid.
85
“Proposition H Funding.” First 5 San Francisco. http://www.first5sf.org/press/proph.
! %"!
Nevertheless, members of PFA remain optimistic about the program’s future. While
excess reserve spending and budget shortfalls have limited PFA enrollment growth and put forth
an unsustainable financial model in previous years, increasing access to early education and,
more specifically, the initiative for universal preschool are incredibly salient and politically
feasible issue areas in the city of San Francisco. Proposition H and its concurrent Public
Education Enrichment Fund are set to expire this coming June, but the voters of San Francisco
have already passed Proposition C, which extends the city’s Children’s Fund as well as Public
Education Enrichment Fund.86
Proposition C offers PFA more consistent funding by eliminating
a previous provision that allowed the city to withdraw PFA funding during any year it suffered
budget shortfalls of $100 million or more.87
With nearly three quarters of the vote, the passage of
Proposition C is indicative of citywide support for universal preschool and continued expansion
of early education and family services in San Francisco.
Drawing on the city’s overwhelming support for universal preschool, San Francisco’s
politicians have also taken on the issue in hopes of further expanding access. In January of 2015,
San Francisco Mayor Ed Lee proposed expanding access to preschool for an additional 860
children.88
Noting access to early education as one of the primary concerns for families living in
San Francisco, the Mayor is attempting to expand the program at a time when the city is
experiencing tremendous economic growth from the tech boom. Although the proposed
expansion would add another $5 to 10 million to the PFA budget, it would, at least for the time
being, reduce or eliminate the current 500-child waitlist for the PFA program.89
Since 2013, PFA
has received the original amount of funding guaranteed under Proposition H, but the current
budget is still not enough to promote expansion such that the supply of quality preschool in San
!!!!!!!!!!!!!!!!!!!!!!!!!!!!!!!!!!!!!!!!!!!!!!!!!!!!!!!!
86
“City of San Francisco Children and Families First City Funds, Tax and Administration Proposal, Proposition C.” Ballotpedia. 2014.
87
Ibid.
88
Cote, John. “S.F. Mayor Ed Lee Promises Funds for Preschool, Muni.” SF Gate. January 14, 2015. !
89
Ibid.
! %#!
Francisco is able to meet the demand. These long waitlists suggest that, with the ten-year
authorization of PFA funding through Proposition H coming to a close, the program has not yet
reached its goal of providing universal preschool. While budget issues have limited PFA’s
impact and growth in previous years, overwhelming political support of universal preschool as
an issue will allow PFA to continue its mission of increasing access to quality preschool
education. Whether the Mayor’s early education proposals are simply rhetoric and political
maneuvers or genuine action remains to be seen, but they certainly present an optimistic outlook
for PFA and the state of universal preschool in San Francisco.
In the current fiscal year, PFA is set to receive about $27 million in city funds.90
Where
and how this money is distributed requires further examination. Understanding PFA’s budget
offers one policy perspective on the program’s efficiency in terms of costs and benefits, but it
also provides greater insight into the viability of replicating the successes of this program
elsewhere in California. With that said, PFA partner sites are delineated into two primary
categories: subsidized or unsubsidized. Subsidized schools, which make up roughly sixty-five
percent of the 150 PFA partner sites, include schools that receive either state or federal education
subsidies. More than sixty percent of subsidized preschools partnering with PFA receive state
subsidies from California’s Department of Education, while the remainder of subsidized
preschools in San Francisco receives funding from either Head Start or Title I.
In fact, PFA partners with every Head Start school in SFUSD. Head Start, a federal
program established in 1965, is designed to serve children between the ages of three and five and
was founded on the basis of promoting equal opportunity for families of all socioeconomic
backgrounds. The program specifically targets children at high risk for academic failure in low-
income communities, and the majority of families served by Head Start centers either fall below
!!!!!!!!!!!!!!!!!!!!!!!!!!!!!!!!!!!!!!!!!!!!!!!!!!!!!!!!
90
Ibid.!
! %$!
the federal poverty line or qualify for social services according to state and federal income
guidelines.91
Even though Head Start is a federally run and sponsored program, sixty-four
percent of Head Start agencies in California also contract with the State Department of Education
and city programs like the Preschool For All initiative.92
These schools require further resources
and funding from PFA and First 5 San Francisco to enhance their efforts to alleviate poverty and
promote quality preschool education for under-resourced families.
In addition, Title I schools, which receive federal funds and grants as per the Elementary
and Secondary Education Act, make up a much smaller percentage of PFA partner sites. Much
like the Head Start programs, the handful of Title I schools that partner with PFA have especially
high percentages of students from low-income families.93
In spite of receiving funding from
various federal and state entities, these subsidized schools still require a great deal of additional
funding for quality improvement, teacher development and assistance as well as financial
assistance for individual students. Because Title I and Head Start schools specifically target low-
income families and families living below the poverty line, funding is critical for subsidizing the
cost to families and improving quality, which tends to be lower than that of private preschools in
San Francisco.
Unsubsidized schools, which make up the other forty percent of PFA partner schools, are
in large part tuition-based, meaning students enroll on a fee-for-service basis. Like subsidized
schools, these early education centers may also offer scholarships or sliding-scale tuition. While
unsubsidized schools are more likely to be private preschools and provide access to fewer low-
income families, they still offer a number of opportunities for reduced tuition. Since PFA’s
mission focuses particularly on low-income families, unsubsidized schools on the whole receive
!!!!!!!!!!!!!!!!!!!!!!!!!!!!!!!!!!!!!!!!!!!!!!!!!!!!!!!!
91
“About Head Start.” California Head Start Association. 2015. caheadstart.org.
92
Ibid.
93
“Improving Basic Programs Operated by Local Educational Agencies.” US Department of Education. June 4, 2014. !
! %%!
less funding than subsidized schools from PFA. These schools still need funds to ensure quality,
promote enrollment, and streamline various program requirements that PFA mandates for its
partner sites.
The amount of funding both subsidized and unsubsidized schools can receive is also
limited by enrollment type. Within this, preschools can either provide a full, part, or school day
of learning. At the least, schools provide part day learning, which entails four or fewer daily
hours; school days are defined by four to seven hours of daily education, and full day preschools
provide seven plus daily hours of learning.94
Eighty-five percent of participating PFA schools
offer full day services, a figure that is critical in enhancing PFA’s potential impact. Numerous
studies highlight the benefits of additional hours of preschool education. Most notably, the
NIEER conducted a randomized study of eighty-five four-year olds in a low-income urban
school district, in which twenty percent of participating families were living below the poverty
line.95
The study suggests that “even students who are far behind at entry to preschool can
develop vocabulary, math, and literacy skills that approach national norms if provided with
extended-duration preschool that maintains reasonable quality standards.”96
Thus, high
participation rates among full day preschool services is significant to PFA’s mission of
increasing school readiness of its students, particularly those from low-income backgrounds.
More hours of quality preschool education result in substantial gains for participating children. In
turn, it is necessary to analyze PFA’s standards of quality and accessibility in order to more
accurately gage the program’s effectiveness.
Defining and Measuring Effectiveness
!!!!!!!!!!!!!!!!!!!!!!!!!!!!!!!!!!!!!!!!!!!!!!!!!!!!!!!!
94
“2013/2014 PFA Preschools.” First 5 San Francisco. 2013. http://www.first5sf.org/sites/default/files/page-files/Directory_PFA_CURRENT.pdf
95
Barnett, Stephen, Ellen Frede, and Kenneth Robin. “Is More Better? The Effects of Full-Day vs. Half-Day Preschool on Early School
Achievement.” 2006. http://nieer.org/resources/research/IsMoreBetter.pdf.
96
Ibid.
! %&!
So far, this analysis has only looked into PFA’s historical background and funding
schemes. It is also important to better understand and analyze the program’s effectiveness, a
ubiquitously controversial criteria for any education policy analysis. First 5 SF and the PFA
program have very specific criteria for measuring success and effectiveness. The initiative’s
primary objectives are to make high quality preschool accessible, available, and affordable for all
and to ensure that children are socially, emotionally and academically prepared for success in the
classroom.97
PFA’s site evaluations specifically focus on school readiness by measuring early
math and reading skills as well as self-regulation, which measures children’s attention skills and
social development.
PFA’s most recent evaluations from 2012 suggest that children attending PFA partner
preschools achieve significant gains in early literacy, early math and self-regulation skills,
placing them well above the national average for these categories. The gains in early literacy,
measured by letter word recognition tests, can be equated into a three-month advantage for PFA
children.98
In addition, students at PFA sites achieved increases in applied problem scores for
mathematics, resulting in a three to four month advantage in school readiness.99
The program had
the biggest impact on self-regulation skills. Using the Head-Toes-Shoulder-Knees Test, which
tests participants’ ability to concurrently inhibit impulses while still executing intention, students
made further progress in school readiness.100
From this, children enrolled in PFA partner sites
experience significant progress in school readiness and exhibit learning skills above that of non-
PFA and national averages.
!!!!!!!!!!!!!!!!!!!!!!!!!!!!!!!!!!!!!!!!!!!!!!!!!!!!!!!!
97
"Evaluating Preschool For All Effectiveness." First 5 SF. August 1, 2013.
98
Ibid. Note: letter word recognition tests measure language development and early literacy. The test is endorsed by the National Education Goals
Panel, which selects tests on the basis of predicting subsequent academic success. The test itself is a series of test plates; students are then asked
to identify letters, words, and distinguishing letters from images on those plates. This pre-reading and word decoding test can be taken in both
English and Spanish.
99
Ibid.!
100
Ibid. Note: the Head-Toes-Shoulder-Knees Test is a five minute test that measures a child’s ability to self-regulate. The test asks children to
perform the opposite of a response to various commands. For instance, if a child is instructed to touch his toes, his/her correct response entails
touching his/her head. PFA administers this test in English, Spanish, and Chinese.
! %'!
An evaluation of PFA’s effectiveness would be remiss if it did not address the program’s
ability to uphold a key part of its mission, namely to ensure accessible and affordable preschool
for all four year olds in San Francisco but particularly four year olds from low-income families.
First 5 agencies throughout California focus a great deal on providing their services to low-
income families. Within this, PFA’s work is especially geared toward under-resourced
communities in the city. As displayed by Table 7.0, the differences between PFA and non-PFA
preschools offer one metric for measuring the impact of PFA programs and provide context for a
comparative analysis of which students PFA actually reaches.
The socioeconomic and racial demographics of PFA participants very much reflect the
program’s special emphasis on promoting preschool access to low-income and under-resourced
communities. For instance, seventy percent of children at PFA partner sites come from families
earning annual salaries of less than $35,000 versus just thirty-five percent of non-PFA
children.101
The income discrepancy between PFA and non-PFA children in San Francisco is
most pronounced in the $15,000-35,000 income range, in which forty-three percent of PFA
children fall compared to just fifteen percent of non-PFA children.102
It is also important to note
that nine percent of PFA families earn over 100,000 dollars per year; although this number falls
well below the twenty-eight percent of non-PFA schools, it is still a point of criticism for the
program that will be discussed in further detail. From these statistics, it is evident that PFA
serves a disproportionately low-income population.
!!!!!!!!!!!!!!!!!!!!!!!!!!!!!!!!!!!!!!!!!!!!!!!!!!!!!!!!
101
Note: data was prepared by First 5 SF in 2013 and forwarded by PFA Data Analyst, Xavier Morales.
102
Ibid.!
! %(!
103
Table 7.0. This graph details the San Francisco PFA income of entering San Francisco Unified School District kindergarten children by PFA
participation (as compared to those who did not receive preschool education from FPA partner sites). The discrepancies between PFA and non-
PFA children are most pronounced at the low and high ends of the income spectrum, suggesting that, on the whole, PFA children tend to come
from more low-income backgrounds compared to non-PFA children, who come from more high-income backgrounds.
Further analysis of PFA participation demographics shows that increases in preschool
participation rates over the years are most pronounced for socioeconomically disadvantaged
families. Nearly eighty percent of Black four year olds are now enrolled in preschool, up ten
percent since 2007. Four-year-old Latinos have seen the biggest spike in participation with
twenty-five percent improvement in enrollment rates and eighty percent now enrolled.104
These
increases provide strong evidence that PFA has made preschool more accessible, particularly
amongst families who are in the greatest need of these services. In addition to high preschool
participation rates for low-income minority families, PFA has also impacted households with
limited parental education: the majority of PFA parents have no higher than a high school
!!!!!!!!!!!!!!!!!!!!!!!!!!!!!!!!!!!!!!!!!!!!!!!!!!!!!!!!
103
Ibid.
104
Note: data was prepared by First 5 SF in 2013 and forwarded by PFA Data Analyst, Xavier Morales.
! %)!
degree.105
These statistics suggest that PFA as a program has made significant gains in preschool
participation rates for the city’s most socioeconomically disadvantaged families and helped to
level the playing field for these children as they move on to kindergarten and primary school.
First 5 SF and the PFA program have a set criteria for measuring effectiveness that
includes rating systems, quality assessments, site evaluations, and tests. These measurements
provide data and critical insight into some of the strengths and weaknesses of the program that
policy-makers and program administrators can in turn use to improve policy moving forward. It
is clear that student performance on administered tests and enrollment data play an important
role in PFA’s own assessment of program effectiveness. For the purposes of this study,
measuring the program’s effectiveness extends beyond these instruments and criteria to focus
particularly on PFA’s ability to uphold its mission of increasing access to quality preschool for
all children in San Francisco. In further defining PFA’s effectiveness through access and quality,
this research offers deeper analysis of the quality of PFA preschools and who actually has access
to these programs. In doing so, quality must be more clearly defined.
Access to Quality Preschool: What is quality preschool and who has access to it?
PFA as an organization champions its impact on increasing access to quality preschool in
San Francisco. The program has expanded over the past ten years, culminating in its current
partnerships with over 150 schools. The quality of PFA partner sites has continued to increase
during this time, especially as compared to the quality of non-PFA schools in San Francisco.
There is still a spectrum of quality within PFA preschools, and the question remains as to who
receives what kind of quality preschool education. Because the program places special emphasis
on improving the livelihoods and opportunities for low-income families, it is of particular
!!!!!!!!!!!!!!!!!!!!!!!!!!!!!!!!!!!!!!!!!!!!!!!!!!!!!!!!
105
Ibid.!
! %*!
importance to more closely examine the relationship between the spectrum of quality preschool
education and the different socioeconomic and racial groups in the city. This section addresses
the issue of whether or not PFA is enabling affluent families to send their children to well to-do
schools and low-income families to send their children to still underperforming or lower quality
preschools. The evidence ultimately suggests that PFA has increased overall access to preschool
for four year olds in the city, especially for children from low-income families, and income is not
a determining factor in families’ ability to access quality programs.
In order to better understand the relationship between quality and access, it is necessary
to clearly define what quality is and how it is measured. Defining quality preschool education is
a much more difficult task than it may seem on the surface. State and local education agencies
are often caught between choosing older or current quality assessments versus developing new,
more comprehensive and locally based ones. All measures of quality preschool education to
some extent incorporate common elements or criteria. These elements include teacher
qualifications, class size, and assessments of the program’s learning environment among other
criteria.
In an interview with Scott Moore, the former executive director of the California Early
Learning Advisory Council and current Chief Policy Advisor at Early Edge California, he
discussed the framework for effective quality assessments. While the previously mentioned
elements are no doubt important in assessing the quality of preschool programs, they should
really only serve as the foundation for better understanding and assessing quality. According to
Moore, the quality of instruction should be the most important aspect of any quality
assessment.106
All learning, but especially early learning, must involve instructional scaffolding,
or the ability for teachers to adjust their teaching styles and learning environments to best
!!!!!!!!!!!!!!!!!!!!!!!!!!!!!!!!!!!!!!!!!!!!!!!!!!!!!!!!
106
!The information and opinions referenced were noted during an in-person interview with Scott Moore on April 10th
, 2015.!
! &+!
accommodate each student’s needs. Effective quality assessments find a way to address teachers’
abilities to reach each and every one of their students. The ultimate purpose of preschool
programs and the quality metrics used to assess them is straightforward: coming out of
preschool, children should be better prepared for school and achieve better results in future
learning environments. Effective quality assessments should account for these elements and
provide insight not only into the current state of preschool, but also ways of improving education
policy moving forward.
Going off of Moore’s definition of effective quality assessments, it is evident that PFA’s
system of quality assessment is adequate given its emphasis on teacher quality and ultimate goal
of improving the program. PFA determines the quality of its partner preschool sites based on a
statewide Quality Rating and Improvement System (QRIS). Within the past few years, California
has sought to create a more uniform, locally based rating system. In 2012, the state of California
received over $50 million from the U.S. Department of Education as part of the Race to the Top-
Early Learning Challenge Grant Award; seventy-seven percent of these funds is spent at the local
level to support organizations, such as San Francisco First 5 and the PFA program, in developing
and implementing a QRIS.107
Upon receiving grant funding from the U.S. Department of
Education, a voluntary network of local early education agencies formed a consortium to align
their local QRIS to a common framework based on various research-based elements and
improvement measures.108
First 5 San Francisco is part of this consortium, and the PFA program
uses the established QRIS in its assessment of its preschool partner sites in the hopes of ensuring
that children have access to high quality programs.
!!!!!!!!!!!!!!!!!!!!!!!!!!!!!!!!!!!!!!!!!!!!!!!!!!!!!!!!
107
"RTT-ELC Implementation." California Department of Education. January 9, 2015. http://www.cde.ca.gov/sp/cd/rt/rttelcapproach.asp.
108
Ibid.
! &"!
The QRIS used by PFA and various other early education agencies throughout California
is based on three core elements: child development and school readiness, teachers and teaching,
and the program and environment quality.109
Each core category’s scoring is based on specific
criteria. For instance, scores for the child development and school readiness core are based on
the programs’ compliance with the state of California’s Desired Results Developmental Profile
(DRDP) as well as the programs’ ability to work with families in screening all children using the
Ages and Stages Questionnaire (ASQ).110
The teachers and teaching core is predominately based
on teacher qualifications, with higher scores related to higher degree levels on the part of lead
teachers. In addition, seventy-five percent of lead teaching staff must meet the education degree
requirements as specified by the state of California.111
Effective teacher-child interactions, as
determined by classroom assessments, are also taken into account in the scoring of this core.
Last, the program and environment core is scored according to student/teacher ratios and group
size, Environment Rating Scale (ERS), and the education qualifications of the centers’
directors.112
More specifically, the ERS is a scale designed to assess process quality in ECE that
takes health and safety, the building of positive relationships, and opportunities for stimulation
and learning into account.113
The fully detailed QRIS matrix can be found in the appendix for
more precise details.
By summing the scores from the three core categories, each school receives a total score
between zero and thirty-five. Depending on its score, a partner PFA site is placed between tiers 1
!!!!!!!!!!!!!!!!!!!!!!!!!!!!!!!!!!!!!!!!!!!!!!!!!!!!!!!!
109
See Appendix for full Quality Rating Matrix
110
The Desired Results Developmental Profile is an observation based early childhood assessment that is meant to provide documentation of
children’s behavior in natural environments. The assessment is broken down into eight domains, with each based on its own focus. These
domains include Approaches to Learning-Self-Regulation, Social and Emotional Development, Language and Literacy Development, English-
Language Development, Cognition, Physical Development-Health, History-Social Science, and Visual and Performing Arts. Because the
assessment is developed by California’s Department of Education and is modified annually, it is important to view the most up-to-date profile,
which can be located at http://www.cde.ca.gov/sp/cd/ci/documents/drdp2015preschool.pdf. Moreover, the Ages and Stages Questionnaire is a
questionnaire designed to help schools and families check children’s development. The questionnaire focuses specifically on developmental and
social-emotional screening for children between birth and age 6. This assessment is created independently of state and federal government and
can be accessed via agesandstages.com.
111
See Appendix for full Quality Rating Matrix.
112
Ibid.
113
"Environment Rating Scales." Frank Porter Graham Child Development Institute. 2015. http://ers.fpg.unc.edu/.
! &#!
and 5, with tier 5 representing the highest quality preschools according to the QRIS. Table 8.0
lists the QRIS ratings for 127 PFA preschools in thirty-nine neighborhoods in San Francisco.
The frequency of QRIS tier levels is listed, representing the number of preschools in that
particular neighborhood with the corresponding tier level. Of the 127 preschools included in the
data, the average tier level is 3.46 with a median of 3. Seventy schools are Tier 3, fifty-five
schools are Tier 4, and just 2 of the schools included in the data are Tier 5. Before diving deeper
into the analysis of this data, it is important to note that this sample of 127 PFA preschools is not
entirely comprehensive. The program currently partners with over 150 preschools, which is
about half of all preschools in the city of San Francisco.
114
Table 8.0. The above information lists neighborhoods in San Francisco with participating PFA preschools. The frequency of QRIS tier levels
and total number of preschools in each neighborhood is also listed. It should be cautioned that the total preschool count in this instance, 127, does
not include all PFA preschools, which now totals over 150 preschools.
!!!!!!!!!!!!!!!!!!!!!!!!!!!!!!!!!!!!!!!!!!!!!!!!!!!!!!!!
114
Note: data was collected by Xavier Morales, Data Analyst for SF PFA, and forwarded to me for the purposes of this project.
! &$!
Nonetheless, the information provided in Table 8.0 does provide meaningful insight into
the quality of a large proportion of PFA preschools. Going off of the QRIS matrix, the minimum
tier of three and average tier score of 3.46 offers several conclusions. For instance, the PFA
partner schools included in this data use valid and reliable child observation and assessment tools
aligned with the California Department of Education and local First 5 agency. These schools also
work with families to screen all children using valid and reliable child screening tools as
developed and approved by the state. With regard to teacher qualifications, the average tier of
partner PFA sites indicates that, at the minimum, preschool classroom teachers have taken
twenty-four units in ECE, sixteen units of general education, and have twenty-one hours of
professional development annually. This means that, on the whole, PFA teachers pass the basic
qualifications required by the state and have studied from an ECE-specific curriculum.
Each of the 127 schools has a group size ratio of two teachers/staff members to twenty-
four students. While there is no limit to class size in California, this ratio falls in line with the
typical enrollment of twenty-four children per classroom.115
In terms of program and
environment ratings, these schools annually receive an ERS assessment, which is conducted
independently by a Quality Improvement System rater. In addition, the average QRIS tier rating
indicates that each program’s director has at least an associate’s degree with twenty-four units in
ECE, six units in management and administration, and two units in supervision. This again
implies that PFA preschool directors are qualified for their positions and have received specific
training in ECE and school administration.
!!!!!!!!!!!!!!!!!!!!!!!!!!!!!!!!!!!!!!!!!!!!!!!!!!!!!!!!
115
Barnett, Stephen, Megan Carolan, James Squires, and Kirsty Brown. "The State of Preschool 2013." National Institute for Early Education
Research, 2013. 36.
! &%!
The minimum criteria met by these schools, as suggested by the minimum and average
QRIS tier ratings, offers several implications when compared to the state as a whole. PFA
preschool teachers are much more qualified than the typical preschool teacher in California, who
is not actually required to hold a degree in ECE or complete annual professional training.116
Only
one quarter of preschool teachers in California hold degrees related to ECE, a standard that PFA
schools well surpass given their minimum tier rating observed in the data.117
PFA preschools’
compliance with state and local assessments, including the ERS assessment, also places them
ahead of the curve in California. Median and average QRIS scores indicate that PFA preschools
receive annual classroom assessments and meet the overall score level required by the state. In
contrast, many CSPP schools do not require or receive site visits and other developmental
support services.118
On the whole, PFA partner preschools excel compared to state preschool programs in
child development and school readiness, teaching and teacher qualifications, and program
environment. Still, a spectrum of quality exists within the program. The neighborhood
distribution of QRIS tier levels, as previously mentioned and listed in Table 8.0, highlights that
not all children in San Francisco and even within the PFA program receive the same degree of
quality preschool education. This begs the question posed at the onset of this chapter: is PFA
truly reaching its target audience of low-income families, or does the standard paradigm of
affluent children attending high-quality schools and low-income children attending lower-quality
schools persist?
Answering this question requires an analysis of the neighborhoods in San Francisco that
PFA serves. The data collected includes median household income of each neighborhood, the
!!!!!!!!!!!!!!!!!!!!!!!!!!!!!!!!!!!!!!!!!!!!!!!!!!!!!!!!
116
"California Children's Report Card: How Kids Are Doing in Our State and What Needs to Be Done About It." Children Now. 2014. 9.
117
Ibid.!
118
Barnett, Stephen, Megan Carolan, James Squires, and Kirsty Brown. 36.
! &&!
quality of preschools in these neighborhoods, and the PFA preschool participation rates for each
neighborhood. The results from this data ultimately suggest that PFA does offer increased access
to quality preschool programs for families of all income levels, but especially for low-income
families, and the level of quality is not directly determined by family income. These results also
support the argument that PFA is one example of an effective universal preschool program that
works to reduce economic inequities in education while increasing access to quality preschool
for all children in San Francisco.
!!"#$%&'(")*,!-./!0123/!4050!6.276!5./!4865981:582;<!1=!125.!;:>1/9!0;4!?/9@/;50A/<!2B!/;92CC>/;5!8;!DEF!?9/6@.22C6!1=!;/8A.129.224!
8;!G0;!E90;@86@2,!-./6/!;:>1/96!09/!106/4!2;!5./!>265!9/@/;5!4050!@2CC/@582;!1=!5./!DEF!?92A90>!0;4!E8965!&!GE,!-./!501C/!706!@9/05/4!
1=!H038/9!I290C/6<!J050!F;0C=65!B29!5./!DEF!?92A90>,!
!!!!!!!!!!!!!!!!!!!!!!!!!!!!!!!!!!!!!!!!!!!!!!!!!!!!!!!!
119
Data was collected by Xavier Morales, Data Analyst for SF PFA, and forwarded to me for the purposes of this project.
! &'!
The breakdown in median household income by neighborhood affirms the city of San
Francisco as one of the most expensive in the country. The neighborhoods served by PFA have a
median household income of $83,017, well above the median household incomes for both
California and the United States as a whole.120
The data on neighborhood incomes also highlights
the extreme levels of income inequality in the city. In spite of this large discrepancy between
high and low income neighborhoods, access to preschool through the PFA program is actually
more pronounced in low-income neighborhoods. By providing greater access to quality
preschool in low-income neighborhoods, the PFA program is indeed reaching its target audience
of low-income families while still promoting preschool participation citywide.
Tables 10.1 and 10.2 show the top five highest and lowest income neighborhoods in San
Francisco, respectively, based on median household income. In addition, the tables include the
number of children from those neighborhoods attending PFA preschools and its corresponding
percentage. It is critical to point out that the percentage of children attending PFA partner
preschools from the highest income neighborhoods is significantly lower than that of children
from the poorest neighborhoods. As of December 2014, the number of children enrolled in the
PFA program totaled 5,194.121
Only 8.2% of the total number of children enrolled in the PFA
program comes from the richest five neighborhoods in San Francisco. In contrast, 30.2% of
children enrolled in PFA come from the five poorest neighborhoods. It should come as no
surprise, then, that the preschool count is much higher in low-income neighborhoods as
compared to high-income neighborhoods. In referring back to the total preschool counts in Table
!!!!!!!!!!!!!!!!!!!!!!!!!!!!!!!!!!!!!!!!!!!!!!!!!!!!!!!!
120
"State and County Quick Facts." United States Census Bureau. March 31, 2015. http://quickfacts.census.gov/qfd/states/06000.html. Note: The
median household income of California in 2013 was $61,094 compared to $53,046 for all of the United States.
121
See Table 9.0.
! &(!
8.0, there are ten PFA preschools in the five richest neighborhoods in San Francisco and forty-
one PFA preschools in the five poorest neighborhoods.
Table 10.1
!"#$%$&'()*+",*""-.$/+0$(12"3'4$ 5'-(61$7"8.'*"9-$:12"3'$/;4$ &"<$"=$>*(9-,'1$ ?$>*(9-,'1$
!"#$%&'($)*% +,-./-,% 01% +2,%
&("#343'% +,5.5-6% 5,% /2-%
7)(38)9:';%<'**';% ++5.=1,% 5=% /26%
>88"(%?@8#"$% +/1.0/+% 5/-% ,2A%
B@C'D"9:)#$('9E'"%F)**"G% +//.//6% ++/% 52+%
Table 10.2
@"A'.B$%$&'()*+",*""-.$/+0$(12"3'4$ 5'-(61$7"8.'*"9-$:12"3'$/;4$ &"<$"=$>*(9-,'1$ ?$>*(9-,'1$
:3H3D%:"8$"(9%I"84"(*'38% 5-./6+% 5,=% -20%
:J38)$';8% ,5.1,1% 1+% +20%
K)GH3";9%<@8$"(L#%&'38$% ,=.0=0% 0+6% ++21%
!"#$"(8%M443$3'8% -0.61/% +-6% 521%
F3#3$)D3'8%F)**"G% 6,.6,,% -1A% A2-%
It is also significant to note that there is no clear link between the quality of preschools in
each neighborhood, as measured by the aforementioned QRIS, and neighborhood income. In
fact, the average quality tier of preschools in the richest five neighborhoods, at 3.37, is slightly
below that of the poorest five neighborhoods, which have an average QRIS rating of 3.42. This
suggests that, as a result of PFA, children from low-income families have greater access to high
quality preschool, and the quality of their preschool education actually rivals that of their
wealthier counterparts within the city. This is a major success of the program, and it holds much
broader implications for the policy, especially as program administrators and local government
officials reflect on the program’s impact over the past ten years.
The data presented in Tables 10.1 and 10.2 affirms PFA’s ability to uphold its mission of
increasing access to quality preschool for all children but especially children from low-income
! &)!
families. The program addresses the evidence-based gap in the market for preschool. This gap,
which refers to the inequities in access to quality preschool for low-income families, represents
an ongoing challenge for PFA, but also an area of marked improvement since the program’s
implementation. As the program has continued to expand over the past few years, it has
strengthened its focus on serving low-income neighborhoods in the city. For instance, in 2011
seventy percent of children not attending preschool in San Francisco lived in five communities:
Bayview/ Hunter’s Point, Visitacion, Potrero Hill, Inner Mission, and Outer Mission.122
Based on
2014 preschool enrollment numbers, these communities compose 36.3% of total enrollment in
PFA preschools, highlighting the program’s strong commitment to under-resourced
neighborhoods in the city.123
While low-income families are traditionally underrepresented in and
underserved by preschool in California, PFA has acted on its mission to improve access to high
quality preschool for the very neighborhoods in San Francisco most in need of these services.
A Response to Concerns Over Preschool Expansion
Referring back to Olsen and Snell’s assessment of preschool policy proposals, one of the
central arguments against preschool expansion in California is that it provides middle class and
wealthy families with a free ride. As the argument goes, universal preschool programs create an
entitlement program for the poor and inefficiently subsidize early education programs for
families who would be able to pay regardless. From the evidence and analysis just provided,
these claims are for the most part refuted by PFA’s impact thus far in San Francisco. The
distribution of participation rates by income clearly shows that PFA serves a disproportionately
low-income population. The program and its impact over the past ten years highlight that
!!!!!!!!!!!!!!!!!!!!!!!!!!!!!!!!!!!!!!!!!!!!!!!!!!!!!!!!
122
Ricks, Alice. Increasing School Readiness Among Children in Families with CALWORKS Childcare Vouchers. Berkeley, California, 2011. 6.
123
See Table 9.0. Percentage is calculated by summing the enrollment percentages for Bayview/ Hunter’s Point, Visitacion, Potrero Hill, and the
Mission neighborhoods.!
! &*!
universal preschool policy can reach a wide audience while still paying special attention to
certain groups. Low-income families stand to gain more from universal preschool in San
Francisco and are in fact served by PFA at a higher rate than their wealthier counterparts.
Even without PFA, the city’s wealthiest families will continue to have access to quality
preschool through various program options. This does not mean, however, that funding for PFA
is wasted on middle and upper class families and certainly does not mean that these families are
taking advantage of public subsidies. On the whole, PFA has helped to enable what is left of the
middle class to stay in San Francisco. In the absence of PFA, middle-income families like the
Daars would have limited options for quality, affordable preschool and would be under even
greater financial duress to leave the city.124
The middle class is financially vulnerable as a result
of city trends in increased cost of living and housing, and it will continue to shrink in the absence
of public programs and policies that subsidize essential services such as early education.
Furthermore, the number of wealthy families served by PFA is limited compared to the number
of low-income families. This percentage of families who unnecessarily receive subsidized
preschool is even less significant when the proportion who have given their tuition credits back
for scholarships and other subsidies for the program is taken into account. PFA can certainly
improve its mechanisms for tracking funding and tuition credits, and the program is already in
the process of identifying ways to improve in this regard. This is discussed further in the section
on policy recommendations.
Moreover, it is worth mentioning the potential benefits of socioeconomic diversity in the
classroom. The nine percent of PFA children whose families earn more than $100,000 a year
offer one financial inefficiency for an organization that has at times been strapped for funding.
Still, this financial inefficiency may also enhance the learning experience for all children at PFA
!!!!!!!!!!!!!!!!!!!!!!!!!!!!!!!!!!!!!!!!!!!!!!!!!!!!!!!!
124
See page 37.
! '+!
sites. Several studies on socioeconomic diversity and early learning report the benefits of having
children from various income brackets in the same classroom. Reid, an early education
researcher at Columbia University, argues that there is a positive association between
socioeconomic diversity and children’s language and math skills.125
The study further indicates
that the socioeconomic composition of classrooms plays a critical role in early learning. In this
way, socioeconomic diversity of PFA schools may in fact present a learning advantage for
children. In spite of this positive externality, a more efficient and effective tracking system for
high-income families receiving subsidies and tuition credits is still necessary in creating a more
efficient financial model.
Other criticism from opponents of state preschool expansion touches on concerns over
universal preschool and the creation of entitlement programs. Because the PFA initiative is a
universal preschool policy, it cannot be identified as an entitlement program. Even though the
program predominantly serves low-income families, it does not limit its services to any one
income group or require children to qualify for general participation based on income. PFA
offers one clear-cut example of a universal preschool policy that has succeeded in promoting
access to quality preschool for all but has especially helped to narrow the gap in school readiness
that typically persists between high and low-income groups. The program’s impact over the
years is evidence that universal preschool policies can provide services for those who need them
most without giving the bulk of wealthy families a free ride.
The criticism surrounding preschool policies that in turn create entitlement programs is
also void in this instance. Even though PFA is not an entitlement program, aren’t all children
entitled to a quality preschool education? The well-researched benefits of a quality preschool
!!!!!!!!!!!!!!!!!!!!!!!!!!!!!!!!!!!!!!!!!!!!!!!!!!!!!!!!
125
Reid, Jeanne. “Socioeconomic Diversity and Early Learning: The Missing Link in Policy for High-Quality Preschools.” The Century
Foundation. February 6, 2012. http://tcf.org/assets/downloads/tcf-earlylearning.pdf.
! '"!
education for three and four year olds should not be limited to a select few. All children are
entitled to a quality early education and have the right to enter kindergarten and elementary
school on a level playing field with their peers. PFA shows that there are alternative policy
solutions to reaching children most in need of quality preschool aside from creating new
entitlement programs. PFA honors children’s right to a quality preschool education in San
Francisco without relying solely on entitlement programs and limiting its reach to families on the
basis of income.
PFA’s impact as a policy invalidates the dissent over preschool expansion that stems
from issues surrounding freedom of choice. Conservative groups and individuals such as the
Goldwater Institute, Olsen and Snell, purport that universal preschool policies limit families’
freedom of choice and impede the already efficient market for preschool. In the ten years since
the program’s implementation, PFA has actually expanded families’ options on where to send
their child to preschool. The program has not fundamentally changed the market for preschool in
San Francisco and has certainly not created a government monopoly on preschool, as these
critics warned might happen. It should be noted that PFA remains a voluntary program in San
Francisco. Although PFA as a program has expanded significantly since its implementation in
2005, there is still a large number of non-PFA schools that offers early education services in the
city.
The mixed market for preschool continues to operate alongside the PFA program, which
partners with all different types of preschools. As aforementioned, the distribution of PFA
preschool partnerships consists of 63% of preschools that receive some form of public subsidies
! '#!
and 37% that are unsubsidized.126
Within subsidized and unsubsidized program types, families in
San Francisco have a variety of options for where to send their child, including but not limited to
preschool centers run by SFUSD, tuition-based schools, state preschools, Head Start programs,
Title I preschools and even a handful of family child care homes (FCCH).127
These options
additionally include preschools offering part, full, and school day enrollment types. By
partnering with a variety of types of preschool, PFA works within the mixed market to provide
families an array of preschool options and in no way inhibits families’ freedom of choice.
Another primary concern over state-supported expansion of preschool mentioned in the
literature review is that it holds the potential to create a standardized classroom with limited
quality, using ‘drill and kill’ teaching methods instead of more creative and play-based
approaches to teaching. The data on program quality indicates otherwise. Preschool expansion in
San Francisco has not limited quality, and classroom observations show that the PFA program
actually serves as a model on how to incorporate play as a tool for creating more effective
learning environments. Tucker points out that PFA’s approach to structuring play in order “to
learn skills” has proven successful in both maintaining and nurturing school environment and
enhancing the quality of education.128
This was also apparent during my visit to Capp Street
Head Start Center in the Mission District. Cecelia Lopez, who’s four year old son, Daniel, is
currently enrolled there, noted the quality of education: “preschool is free, and the quality is
great. Daniel gets to play with his friends and receives special attention from his teacher.”
Preschool teachers at Capp Street try to personalize children’s education as much as possible,
and visit each student’s home at least once to develop personal relationships with families. PFA
!!!!!!!!!!!!!!!!!!!!!!!!!!!!!!!!!!!!!!!!!!!!!!!!!!!!!!!!
126
Note: these percentages are taken from my own data set, which contains data from only 137 of the roughly 150 PFA partner preschools.
Accordingly, these numbers cannot be considered a complete data set of the types of PFA partner schools, but the information does offer insight
and trends into the distribution of preschool types involved with the PFA program.
127
Ricks, 17.!
128
Tucker, Jill. "Preschool For All Gives Youths Edge in Kindergarten." SF Gate, September 28, 2013.
! '$!
preschools maintain high quality standards, but also stress the importance of play and a more
personalized learning experience.
IV. Policy Recommendations and Limitations
After speaking with several members of the PFA program, the organization is well aware
of some of its financial inefficiencies and recognizes room for improvement. The main financial
inefficiency stems from program subsidies for families who can already afford quality preschool.
Matthew Rector, a program administrator for PFA since 2006, focuses specifically on
onboarding sites and contract administration. In discussing the dilemma of working toward
universal preschool and subsidizing families who are not necessarily in need of financial
assistance, Rector acknowledged that families can give back their tuition credit from PFA to
schools, which can then be used to “offer a greater number of scholarships, more cost reduction,
and deeper discounts.”129
In the past, it has been difficult for PFA to track reimbursements from
families who have chosen to give their tuition credits back to their schools. While the
organization does not have precise numbers on the amount of money given back to schools,
Rector suggests that, on the high end, ten to fifteen percent of reimbursements for PFA partner
sites come from tuition donations. Moving forward, the program hopes to track such information
so that it may paint a more accurate picture of who is and is not using PFA subsidies.
A more efficient system for tracking tuition credits and program subsidies offers PFA
several benefits. Such a system would dispel concerns over subsidizing preschool for families
who are already financially capable of sending their children to quality schools. More
importantly, a better tracking system of tuition credits and subsidies will enable a more efficient
!!!!!!!!!!!!!!!!!!!!!!!!!!!!!!!!!!!!!!!!!!!!!!!!!!!!!!!!
129
Information is sourced from my interview with Matthew Rector, Preschool For All Program Administrator.
! '%!
use of funds. Greater transparency in PFA’s funding schemes involves establishing a more
comprehensive enrollment and data collection process.130
Data collection on participating
families’ use of subsidies and credits will enable more efficient distribution of program subsidies
and ultimately increase the number of preschool slots. The demand for quality preschool is still
greater than the supply, and it is important for PFA to continue working towards its mission of
providing quality preschool to all children in San Francisco.
The Age Debate
Since its inception in 2005, PFA has improved preschool participation rates of four year
olds throughout the city, but its efforts to increase participation amongst three year olds have
proven to be lackluster. Over the years, the program’s emphasis on increased accessibility to four
year olds has overshadowed the importance of an even earlier start to quality preschool
education. In 2012, PFA made its first attempts at expanding program services to three year olds.
In taking a targeted approach to increased accessibility, PFA started offering full-day subsidies
for as many as 200 qualifying low-income three year olds.131
While the number of three year
olds enrolled in PFA preschools still pales in comparison to the more than 5,000 four year olds
enrolled, this initiative marked a step in the right direction. As the program looks for new ways
to improve its impact in San Francisco, it must continue to expand access to quality preschool
education not just for four year olds, but three year olds as well.
Preschool participation rates for three year olds, as compared to four year olds, are lower
by all local, state and federal accounts. About seventy percent of the nation’s four year olds are
!!!!!!!!!!!!!!!!!!!!!!!!!!!!!!!!!!!!!!!!!!!!!!!!!!!!!!!!
130
Ricks, Alice. 59.
131
Note: data was prepared by First 5 SF in 2013 and forwarded by PFA Data Analyst, Xavier Morales.
! '&!
enrolled in preschool versus only fifty percent of three year olds.132
Within this, twenty-eight
percent of four year olds are enrolled in state-funded pre-K programs while the rate of
enrollment for three year olds stands at just four percent.133
The NIEER’s most recent annual
report on the state of preschools indicates that eleven percent of three year olds and thirty-eight
percent of four year olds are enrolled in state pre-K and Head Start nationwide.134
California
offers a slightly different picture in terms of the differences between three and four year old
enrollment rates. Table 11.0 below shows that seventeen percent of California’s three year olds
are enrolled in state-funded preschool initiatives, special education, and Head Start programs
compared to twenty-six percent of four year olds.135
This shows that PFA’s lower participation
and enrollment rates for three year olds are not uncommon results for early education policies
both within and outside of California, but they still present an opportunity for greater impact
moving forward.
136
Table 11.0. These pie charts illustrate the percentages of three and four year olds enrolled in state-funded preschool initiatives, special
education, and Head Start. The “Other” category consists of types of programs that qualify as child care rather than preschool, such as state-
subsidized child care, and also includes children who may not be attending a center-based preschool program.
!!!!!!!!!!!!!!!!!!!!!!!!!!!!!!!!!!!!!!!!!!!!!!!!!!!!!!!!
132
Herman, Julia, Sasha Post, and Scott O'Halloran. "The United States Is Far Behind Other Countries on Pre-K." Center for American Progress.
May 2, 2013.
133
Barnett, Stephen, Megan Carolan, James Squires, and Kirsty Brown. "The State of Preschool 2013." 9.!
134
Ibid. 7. Note: These percentages reflect enrollment as a percent of the total population for these ages, respectively.!135
Ibid. 36.
136
Ibid.
! ''!
The discrepancies between three and four year old participation rates in preschool are
particularly alarming given the significant body of research suggesting that three year olds stand
to gain a tremendous amount from an earlier start to preschool. Steven Barnett, Director of the
NIEER, argues that expanding early education policies to incorporate three year olds is critical in
creating a lasting impact; he bases this assertion on the numerous studies that indicate an earlier
start and longer duration of preschool ultimately produce better results.137
The positive effects of
earlier preschool participation, which include improvements in both cognitive and social
development, are lasting effects that benefit children into their future learning experiences.
Bearing this in mind, Barnett champions more ECE initiatives that target children under the age
of four, especially economically disadvantaged children who stand to benefit the most.138
Loeb et al.’s study examines the extent to which early education benefits children and
offers additional support for increased preschool access for three year olds. By looking into the
cognitive and social effects of preschool attendance at different ages, the authors’ suggest that
more preschool yields better results. The results of their research indicate that the optimal age for
entering center-based programs is three years of age.139
Children under the age of two who
entered center-based programs did not achieve any significant gains in cognitive development
and actually experienced negative impacts in social development.140
It is also important to note
that full day programs were especially beneficial for three year olds coming from lower-income
families.141
This evidence not only supports calls for PFA to increase access to quality preschool
for three year olds, but provides additional support for preschool policies that stand to benefit
low-income families the most.
!!!!!!!!!!!!!!!!!!!!!!!!!!!!!!!!!!!!!!!!!!!!!!!!!!!!!!!!
137
Barnett, Steven. “Preschool Education and Its Lasting Effects: Research and Policy Implications.” NIEER. 2008. 2.!
138
Ibid. 21.
139
Loeb, Susanna, Margaret Bridges, Daphna Bassock, Bruce Fuller, and Russell Rumberger. "How Much Is Too Much? The Influence of
Preschool Centers on Children’s Social and Cognitive Development." Economics of Education Review, no. 26 (2007). 65.
140
Ibid.
141
Ibid.!
! '(!
Increased access to preschool for three year olds is a critical issue given the existing
levels of inequality in access. PFA was created with the purpose of providing universal access to
four year olds with a special emphasis on families who would not otherwise have access to
quality early education. The program’s mission can also be interpreted as an initiative to increase
accessibility as well as reduce the inequities in overall access to preschool for all four year olds.
Still, the inequality in access is even more pronounced for three year olds than it is for four year
olds.142
Although policies and programs like PFA have improved access to preschool for four
year olds, increased access for three year olds has remained negligible. Perhaps most
importantly, improvements in access for children from low and middle-income families have
been limited.143
This means that, in addition to being more likely to have attended preschool
before kindergarten, children from high-income families are more likely to have started
preschool at an earlier age. Moving forward, it is essential that PFA use this information to better
address the issue of equity in preschool participation for three year olds. Without a more focused
approach for increasing access for three year olds, disparities in school readiness for four and
five year olds will persist, especially for low-income families who stand to gain the most from
access to quality preschool and family services.
Changing Demographics in San Francisco
Amid changes in the socioeconomic demographics of San Francisco in recent years, the
question remains as to how well PFA can remain true to its mission of increasing access to all
but especially low-income families. Although the San Francisco Bay Area was certainly not
immune to the 2007-2008 economic recession and its detrimental effects on the housing market
!!!!!!!!!!!!!!!!!!!!!!!!!!!!!!!!!!!!!!!!!!!!!!!!!!!!!!!!
142
Barnett, Stephen, and Donald Yarosz. "Who Goes to Preschool and Why Does It Matter?"National Institute for Early Education Research, no.
15 (2007). 14.
143
Ibid.!
! ')!
and employment, the city has experienced a strong recovery as a result of new job growth from
the bustling tech industry. The revitalization of San Francisco’s economy and housing market
represents, for many long time residents of the city, both positive and negative change. The rapid
demographic changes within San Francisco inherently affect who is served by the PFA program,
and recent census data provides further insight into possible population trends that will continue
to affect PFA’s focus on low-income families.
According to the most recent U.S. census data, the city of San Francisco experienced a
four percent population increase from 2010 to 2013 compared to 2.9 percent for the state of
California as a whole.144
In real terms, this percentage increase is equivalent to an increase of
20,000 people to the city’s population. While a population increase in and of itself by no means
indicates neighborhood gentrification, the growth in income statistics associated with this
population increase does offer a more transparent picture of the city’s changing socioeconomic
demographics. The cost of living index, which incorporates the cost of housing, food, utilities,
transportation, health care and other goods and services, is based on an average of 100, with each
city’s index read as a percentage of the average for all cities included in U.S. census data. Next
to Manhattan’s index of 216.7, San Francisco has the highest cost of living index in the United
States, with an overall cost of living index of 164.145
Even within California, San Francisco’s cost
of living index is still far higher than that of Los Angeles and San Diego, cities with cost of
living indexes of 136.4 and 132.3, respectively, and larger populations. Such high cost of living
indexes does not imply a lack of poverty in these cities, but it does relate to well above average
median incomes and housing prices.
!!!!!!!!!!!!!!!!!!!!!!!!!!!!!!!!!!!!!!!!!!!!!!!!!!!!!!!!
144
"State and County Quick Facts." United States Census Bureau, 2015.
145
Ibid.
! '*!
San Francisco’s median household income stands at a whopping $75,600, significantly
higher than California’s average of $61,094.146
Since 2010, the median income in San Francisco
increased by twenty percent and shows no signs of slowing down.147
Compared to California as a
whole, San Francisco also has a lower percentage of residents living below the poverty level –
13.5 percent compared to 15.9 percent for all of California.148
Median income levels and existing
poverty rates are indicative of San Francisco’s high degree of income inequality. In fact, San
Francisco has the second highest level of income inequality of any major city in the United
States.149
While median household and per capita incomes have continued to increase rapidly
over the past few years, the gap between rich and poor has widened. This hollowing out of the
middle class is further impacted by the city’s booming housing market.
150
Note: this graph displays dramatic increases in the price of renting an apartment in the city of San Francisco between June of 2013 and 2014.
Prices have increased for studio, one bedroom, two bedroom, and three bedroom apartments. Trends in the cost of housing continue to impact
the demographics of San Francisco.
!!!!!!!!!!!!!!!!!!!!!!!!!!!!!!!!!!!!!!!!!!!!!!!!!!!!!!!!
146
Ibid.!147
Kloc, Joe. "Tech Boom Forces Ruthless A Gentrification in San Francisco." Newsweek, April 15, 2014.
148
“State and County Quick Facts,” 2015.
149
Kloc, Joe. 2014.!
150
Stone, Madeline. "Here's What The Average One-Bedroom Rental Costs Around San Francisco." Business Insider, August 15, 2014.!
! (+!
Much like the cost of living index, San Francisco’s cost of housing is second only to
Manhattan; by some accounts, the housing market in San Francisco is now the most expensive in
the country.151
Median rent in the city is $3,460 a month, and the median price for a new or
existing single family home hit $1 million in July of 2014.152
Although these numbers are
astonishing in and of themselves, the pace at which housing prices are increasing has realtors
across the city ecstatic. From 2013 to 2014, the median price for housing in San Francisco shot
up thirty-three percent.153
In addition to monthly rent increases, the number of evictions went up
115 percent, further perpetuating neighborhood gentrification.154
These increases highlight the tremendous economic growth of the city, but also the
ensuing changes to local culture and demographics. Due to geographical constraints and strict
development laws in San Francisco, gentrification and the associated trends in the city’s
socioeconomic demographics are unlikely to change any time soon. San Francisco’s inelastic
housing market has left city policy-makers with trade-offs between the preservation of local and
cultural contexts versus the continued economic benefits of increasing rent and real estate values.
These changes and policy decisions are especially relevant to the PFA program and its mission
of providing universal preschool. As the percentage of low and middle-income families in San
Francisco decreases, the ability for PFA to maintain its focus on economically disadvantaged
families remains uncertain.
Dramatic increases in housing prices have undoubtedly contributed to one of the most
significant demographic changes in San Francisco with regard to preschool policy: the number of
families living in the city is alarmingly low and continues to decrease. San Francisco has the
!!!!!!!!!!!!!!!!!!!!!!!!!!!!!!!!!!!!!!!!!!!!!!!!!!!!!!!!
151
Pender, Kathleen. "$1 Million City: S.F. Median Home Price Hits 7 Figures for 1st Time." SF Gate, July 17, 2014.
152
Stone, Madeline. 2014.
153
Pender, Kathleen. 2014.
154
Kloc, Joe. 2014!
! ("!
lowest percentage of kids of any major city in the United States.155
According to U.S. census data
from 2013, just 4.6 percent of the city’s population is five or below compared to 6.5 percent
statewide.156
The number of children living in San Francisco has been declining since the 1960s,
a time when a quarter of the city’s population was below the age of eighteen.157
This “fleeing” of
families from San Francisco to the East Bay suburbs and elsewhere directly impacts the city’s
early education policies. Preschool and other ECE policies can only be effective where there are
children to serve, and the overall impact of these policies depends on the demand for quality
preschool.
The low and still declining number of children in San Francisco poses serious limitations
to PFA’s potential for impact. The data presented throughout this report illustrates the need for
high quality preschool in San Francisco, most importantly for low-income families. While the
number of children in the city may be low, there is still plenty of room for PFA to increase
access and expand the scope of its programs and partnerships. Waitlists and excess demand for
high quality preschool persist, and the city must renew and expand its commitment to early
education. PFA must also continue its community outreach efforts to ensure that all families in
San Francisco are aware of the benefits of preschool and the resources available to them.
Nonetheless, the dwindling number of children in the city does highlight the need for
effective and comprehensive early education policy where the population of children and overall
demand is even greater than in San Francisco. The benefits of preschool are too important for
any child to be ignored. The limited number of children in the city should not detract from
support for PFA, but instead encourage similar policies and programs in areas of California
where even greater demand for access to high quality preschool programs exists.
!!!!!!!!!!!!!!!!!!!!!!!!!!!!!!!!!!!!!!!!!!!!!!!!!!!!!!!!
155
"Families Flee San Francisco: City Has Lowest Percentage Of Kids Of Any Major U.S. City."Huffington Post, March 11, 2012.
156
“State and County Quick Facts,” 2015.
157
"Families Flee San Francisco: City Has Lowest Percentage Of Kids Of Any Major U.S. City," 2012.!
! (#!
V. Conclusion
Access to quality preschool is a right, not a privilege. This paper provides an in depth
look at preschool policy in California and identifies increased access to quality preschool as a
key tool in ensuring all three and four year olds a fair start to their education. Starting with an
overview of preschool policy frameworks, this paper addresses different views of preschool
policy that include but are not limited to preschool expansion as an economic investment,
obligation of the state, and unnecessary extension of government in families’ lives. The literature
review provided a foundation for better understanding preschool policy and highlighted the
central arguments both for and against preschool expansion in California. Data included in media
discourse analysis suggested that funding, access and quality are major areas of discussion within
preschool policy. This implied that policy debates not only address if preschool should be
expanded, but to whom and of what quality and cost. The differing perspectives on preschool
policy beg the question of whether or not access to preschool can increase for all, but especially
children most in need, without limiting quality.
To answer this question, this paper first offers an overview of the market for preschool in
California. This section details the various private and public options available to families and
importantly identifies the preschool system as a mixed market of mixed quality. Although the
majority of three and four year olds attend center-based programs, there is still a tremendous
amount of room for increasing participation, especially amongst certain groups. The analysis of
the preschool market pays close attention to persisting gaps in access and quality. It is evident
that access to quality preschool in California is far from universal, and low-income families have
significantly less access to quality preschool compared to their higher-income peers. The state
! ($!
holds a central role in maintaining the preschool system and provides funding for many of these
essential services. In the absence of a self-correcting private market for preschool, many of
California’s children will continue to forego the benefits of preschool solely because of their
families’ income level. It is imperative moving forward that the state offers policy solutions to
increase access to quality preschool for families most in need and who stand to benefit the
greatest, namely economically disadvantaged families.
San Francisco’s Preschool For All initiative serves as a policy model for increasing
access to quality preschool for all children but especially those from low-income backgrounds.
This paper analyzes PFA’s effectiveness in terms of access and quality. PFA operates with the
goal of increasing access to quality preschool for all children in San Francisco, and it is evident
that the program has lived up to its mission. PFA’s impact extends beyond that of increasing
preschool participation rates to well above state and national averages. In its ten years since
implementation, the program has reached families most in need of quality preschool services.
Increases in preschool participation rates are most pronounced for low-income and minority
families. It is also critical to note that family income is not a determinant of the level of quality
preschool education a child receives through PFA. Data included in this study highlights that the
quality of PFA partner preschools is high across neighborhoods of varying incomes, and children
from low-income families have access to the same quality early education as their wealthier
peers.
PFA’s ability to increase access to quality preschool without limiting quality helps to
refute many of the criticisms surrounding preschool expansion. PFA works within the mixed
market for preschool to offer families a number of options for where to send their child.
Moreover, the program shows that universal policies can increase access for all children while
! (%!
focusing especially on families most in need. Preschool expansion does not have to limit quality
or lead to standardized classrooms. PFA preschools hold high quality standards but also
recognize the importance of maintaining local and cultural contexts as well as personalizing the
learning experience. There is certainly still room for improvement. A more efficient tracking
system of tuition credits and subsidies as well as expanded efforts to collect enrollment data will
help the program further increase access. While the program has had a significant impact on
increasing access for four year olds, it has not fully implemented strategies for increasing
enrollment of three year olds. These improvements will help the program come closer to
achieving its goal of universal access to quality preschool in San Francisco. Through its
commitment to increasing access and quality, PFA will continue to make an impact and help
level the playing field for all children in the city as they begin their primary education.
San Francisco’s PFA model highlights the potential for policy to create a more fair and
inclusive early education system. There are certainly limitations in replicating this model
elsewhere in California – universal preschool is politically salient in San Francisco, and the city
has the budget to be able to offer these services. Nonetheless, local and state government must
adopt a similar commitment to ensure all three and four year olds receive a quality preschool
education and are prepared for primary education. All children have the right to a quality
education; preschool policy that promotes access and quality for all children but especially
California’s most economically disadvantaged families is a great starting point for ensuring this
right. The benefits of preschool are too great and the stakes too high for preschool access to
remain limited to a select few. Increased access to quality preschool through policy is possible,
and we as a society can ensure that all children have equal opportunity as they begin their
education.
! (&!
Works Cited
“About Head Start.” California Head Start Association. 2015. caheadstart.org.
Barnett, Stephen, and Donald Yarosz. "Who Goes to Preschool and Why Does It
Matter?"National Institute for Early Education Research, no. 15 (2007).
Barnett, Stephen, Ellen Frede, and Kenneth Robin. “Is More Better? The Effects of Full-Day vs.
Half-Day Preschool on Early School Achievement.” 2006.
http://nieer.org/resources/research/IsMoreBetter.pdf.
Barnett, Stephen, Megan Carolan, James Squires, and Kirsty Brown. "The State of Preschool
2013." National Institute for Early Education Research, 2013
Bernstein, Sharon. "In Newly Solvent California, Dems Propose Free Preschool." Huffington
Post, January 7, 2014.
Boskin, Michael. "Quit Taxing the Rich to Fund Your Pet Projects." Los Angeles Times, May 1,
2006.
Burke, Lindsey, and Lisa Snell. "Universal Pre-K May Not Be as Good as It Sounds." Reason
Foundation, 2014. http://reason.org/news/show/universal-pre-k-may-not-be-as-good.
"California Children's Report Card: How Kids Are Doing in Our State and What Needs to Be
Done About It." Children Now. 2014.
"Child Care and Development Programs." California Department of Education. March 20, 2015.
http://www.cde.ca.gov/sp/cd/op/cdprograms.asp.
“City of San Francisco Children and Families First City Funds, Tax and Administration
Proposal, Proposition C.” Ballotpedia. 2014.
Cote, John. “S.F. Mayor Ed Lee Promises Funds for Preschool, Muni.” SF Gate. January 14,
2015.
"Environment Rating Scales." Frank Porter Graham Child Development Institute. 2015.
http://ers.fpg.unc.edu/.
"Evaluating Preschool For All Effectiveness." First 5 SF. August 1, 2013.
"Families Flee San Francisco: City Has Lowest Percentage Of Kids Of Any Major U.S.
City."Huffington Post, March 11, 2012.
Fuller, Bruce, Alejandra Livas, and Margaret Bridges. "How to Expand and Improve Preschool
in California." Policy Analysis for California Education, 2006.
! ('!
Fuller, Bruce. Standardized Childhood. Stanford: Stanford University Press, 2007.
Garland, Sarah. "More, Better Early Education Could Help Close California's Achievement
Gap." The Hechinger Report, October 24, 2011.
Graff, Amy. “SF’s PFA Adds 10 New Sites.” SF Gate. June 4, 2009.
http://blog.sfgate.com/sfmoms/2009/06/04/s-f-s-preschool-for-all-adds-10-new-sites/.
Herman, Julia, Sasha Post, and Scott O'Halloran. "The United States Is Far Behind Other
Countries on Pre-K." Center for American Progress. May 2, 2013.
“Improving Basic Programs Operated by Local Educational Agencies.” US Department of
Education. June 4, 2014. http://www2.ed.gov/programs/titleiparta/index.html.
Jacobson, Linda. "On The Cusp in California: How PreK-3rd Strategies Could Improve
Education in the Golden State." New America Foundation, 2009
Karoly, Lynn. "Preschool Adequacy and Efficiency in California." RAND Corporation, 2009.
Karoly, Lynn, Bonnie Ghosh-Dastidar, Gail Zellman, Michal Perlman, and Lynda Fernyhough,
“Prepared to Learn: The Nature and Quality of Early Care and Education for Preschool-Age
Children in California.” RAND Corporation, 2008.
Karoly, Lynn, and James Bigelow. "The Economics of Investing in Universal Preschool in
California." RAND Corporation, 2005. http://www.rand.org/pubs/monographs/MG349z1.html.
Kirp, David. "California Should Give All Kids the Pre-K Advantage." Los Angeles Times,
January 1, 2014.
Kirp, David. The Sandbox Investment: The Preschool Movement and Kids-First Politics.
Cambridge: Harvard University Press, 2007.
Klein, Karin. "Scary Preschool Utopia." Los Angeles Times, June 5, 2005.
Kloc, Joe. "Tech Boom Forces Ruthless A Gentrification in San Francisco." Newsweek, April 15,
2014.
Loeb, Susanna, Anthony Bryk, and Eric Hanushek. Getting Down to Facts: School Finance and
Governance in California. Stanford University, 2007.
Loeb, Susanna, Margaret Bridges, Daphna Bassock, Bruce Fuller, and Russell Rumberger. "How
Much Is Too Much? The Influence of Preschool Centers on Children’s Social and Cognitive
Development." Economics of Education Review, no. 26 (2007).
! ((!
Lucich, Mardi, and Kelly Lynch. “Cost Models of Three Types of Early Care and Education in
San Francisco: What is the True Cost of High Quality Care?” SF Department of Youth and Their
Families. 2009.
“Mission Head Start." Mission Neighborhood Centers, Inc.2014. www.mncsf.org.
Mongeau, Lillian. "Not Investing in Preschool Is 'Mortgaging Our Future'"EdSource, March 11,
2013.
"Most California Children Attend Center-Based Preschools; Educational Quality of Programs
Falls Short." Rand Corporation, 2008.
Olsen, Darcy, and Lisa Snell. "Assessing Proposals for Preschool and Kindergarten." Reason
Foundation, 2006. http://reason.org/news/show/assessing-proposals-for-presch.
Pender, Kathleen. "$1 Million City: S.F. Median Home Price Hits 7 Figures for 1st Time." SF
Gate, July 17, 2014.
"Preschool Adequacy and Efficiency in California: Issues, Policy Options, and
Recommendations." The David and Lucile Packard Foundation. January 1, 2009.
"Preschool For All!" Goldwater Institute. October 8, 2007.
http://goldwaterinstitute.org/article/preschool-all-0.
“Proposition H-Public Education Fund.” SPUR. March 1, 2004.
http://www.spur.org/publications/voter-guide/2004-03-01/proposition-h-public-education-fund
“Proposition H Funding.” First 5 San Francisco. http://www.first5sf.org/press/proph.
“Public Education Enrichment Fund.” San Francisco Unified School District. 2015.
http://www.sfusd.edu/en/about-sfusd/voter-initiatives/public-education-enrichment-fund.html.
Reid, Jeanne. “Socioeconomic Diversity and Early Learning: The Missing Link in Policy for
High-Quality Preschools.” The Century Foundation. February 6, 2012.
http://tcf.org/assets/downloads/tcf-earlylearning.pdf.
"Research Shows: The Benefits of High Quality Learning." Early Edge California. 2015.
http://www.earlyedgecalifornia.org/resources/research--studies/making-the-case.html.
Resmovits, Joy. "Preschool Funding Reached 'State Of Emergency' In 2012: NIEER
Report."Huffington Post, April 29, 2013.
Ricks, Alice. Increasing School Readiness Among Children in Families with CALWORKS
Childcare Vouchers. Berkeley, California, 2011.
! ()!
"RTT-ELC Implementation." California Department of Education. January 9, 2015.
http://www.cde.ca.gov/sp/cd/rt/rttelcapproach.asp.
Schumacher, Kristin. "Reinvesting in California’s Children: Preschool for All?" California
Budget and Policy Center. May 7, 2014.
“SF Family Resource Initiative Evaluation.” First 5 San Francisco. 2013.
http://www.first5sf.org/programs/preschool-all.
“San Francisco Family Resource Center Initiative, Year 2 Evaluation.” First 5 San Francisco.
July 2012. http://www.first5sf.org/sites/default/files/page-files/11_frc_es.pdf.
"State and County Quick Facts." United States Census Bureau. March 31, 2015.
http://quickfacts.census.gov/qfd/states/06000.html.
Stone, Madeline. "Here's What The Average One-Bedroom Rental Costs Around San
Francisco." Business Insider, August 15, 2014.
“TK California." TK California: A Project of Early Edge California. 2015.
http://www.tkcalifornia.org/.
“Top 10 Daily California Newspapers." Cision. March 3, 2010.
Tucker, Jill. "Preschool For All Gives Youths Edge in Kindergarten." SF Gate, September 28,
2013.
Tucker, Jill. “School Board Votes to Save Prop. H Cash for Shortfall.” SF Gate. January 23,
2008. http://www.sfgate.com/bayarea/article/School-board-votes-to-save-Prop-H-cash-for-
3230110.php.
“2013/2014 PFA Preschools.” First 5 San Francisco. 2013.
http://www.first5sf.org/sites/default/files/page-files/Directory_PFA_CURRENT.pdf.
! (*!
Appendix
! )+!
! )"!
SF PFA Preschool Partner Sites
Funding
Type
Funding
Type
Subset
Top Words Frequency Top Bigrams Top Trigrams
Preschool 1267 1, Billion % 3, Year, Olds
Children 783 Child, Care % Children, Low, Income
State 608 Childhood, Education Darrell, Steinberg, D
Year 599 Day, Care % Early, Childhood,
Education
Education 561 Early, Childhood Gov., Jerry, Brown
School 462 Early, Education High, Quality, Early
Programs 426 Early, Learning High, Quality, Preschool
Program 400 First, 5 % Low, Income, Children
Early 375 Funded, Preschool Low, Income, Families
California 373 Gov., Jerry % Preschool, Year, Olds
Budget 338 Head, Start % President, Barack, Obama
Income 333 High, Quality Publicly, Funded,
Preschool
Kindergarten 328 High, School % Rainy, Day, Fund
Years 283 Income, Children Say, Start, Conversation
New 267 Income, Families President, Pro, Tem
Child 262 Jerry, Brown % State, Funded, Preschool
Families 247 K, 12 % %
Money 243 Long, Term % %
High 240 Los, Angeles % %
Care 237 Low, Income %
Kids 229 Middle, Class %
Percent 222 Pre, K % %
Start 220 Pre, Kindergarten %
Parents 216 Preschool, Program %
Quality 215 Preschool, Programs %
Day 214 Prop, 82 % %
Low 213 Quality, Preschool %
Also 209 State, Preschool %
One 206 Transitional, Kindergarten %
Funding 205 Universal, Preschool %
States 201 % %
Olds 193 % %
Public 186 % %
Million 185 % %
Billion 184 % %
Universal 182 % %
Students 181 % %
First 179 % %
! )#!
Subsidized Unsubsidized Tuition-
Based
Scholarship Sliding
Scale
State
Preschool
Head
Start
Title
I
C5 Children's School State Building ! ! ! !
C5 Children's School City
Building
! ! ! !
CDI Head Start Cadillac Center ! !
Clara House/Helen Hawk Children's Center ! ! ! !
Compass Children's Center ! ! ! !
Cross Cultural Family Center-
Tenderloin Center
! ! ! ! !
Glide Child Care & Family
Support
! ! ! !
Salvation Army Harbor House ! ! ! !
SFUSD Tenderloin Community
School CDC
! ! !
Wu Yee Children's Services-
Golden Gate
! !
Holy Family Day Home ! ! ! ! !
Mission Neighborhood Centers,
Inc.- Stevenson Head Start Center
! !
Mission Neighborhood Centers,
Inc.-Valencia Gardens Head Start
Center
! !
Presidio Knolls School ! !
SFUSD- Bessie Carmichael CDC ! ! !
South of Market Child Care, Inc.-
Judith Baker Center
! ! !
Bright Horizons/Marin Day Schools- Main St.
Campus
! !
Bright Horizons/marin Day Schools- Fremont St.
Campus
! !
Bright Horizons/Marin Day Schools- Healthy
Environments CDC
! !
CDI Head Start Potrero Hill
Center
! !
Mission Neighborhood Centers,
Inc.- Mission Bay Head Start
Center
! ! !
Potrero Kids at Daniel Webster ! ! ! !
Potrero Kids at 3rd St. Site ! ! ! !
SFUSD - Starr King Early
Education School
! !
South of Market Child Care, Inc.-
Yerba Buena Gardens CDC
! ! !
Chinatown Community
Children's Center
! ! !
Kai Ming, Inc.- Powell head Start
Center
! !
SFUSD- Commodore Stockton
CDC
! ! !
SFUSD- Gordon J. Lau Title I
Pre-K
! !
True Sunshine Preschool Center,
Inc.
! ! ! ! !
Wu Yee Children's Services- Lok
Yuen Child Development
Program
! !
Community Preschool, Grace Cathedral ! ! ! !
! )$!
Buen Dia Family School ! ! ! !
Centro Las Olas ! !
Cdi Head Start Alemany Center ! !
CCSF- Mission Community
College Center
! !
Family Service Agency SF-
Family Developmental Center
! ! !
The Family School ! ! ! !
FCC-Acosta, Milagros ! !
Good Samaritan Family Resource
Center Preschool
! ! ! ! !
Little Tree Preschool ! !
Mission Kids ! !
Mission Neighborhood Centers,
Inc.-Bernal Dwellings Head Start
! !
Mission Neighborhood Centers,
Inc.-Capp st Head Start
! !
Mission Neighborhood Centers,
Inc.-Regina Chiong Head Start
! !
Mission Neighborhood Centers,
Inc.- Women's Building Head
Start
! !
SFUSD-Bryant CDC ! ! !
SFUSD- Cesar Chavez Title I
Pre-K
! !
SFUSD-Junipero Serra Annex
CDC
! ! !
SFUSD-Las Americas CDC ! ! !
SFUSD-Paul Revere Elementary School PFA
Pre-K
! !
SFUSD-Zaida Rodriguez CDC ! ! !
Kai Ming, Inc.-Broadway Head
Start
! !
CCSF-Campus Children's Center ! !
FCC-Estrada, Esperanza ! !
FCC-Fuentes, Nancy ! !
FCC-Guidry, Monique ! !
FCC-Manzanares, Barbara ! !
FCC-Ramirez,Elena ! !
Mission Neighborhood Centers,
Inc.-Jean Jacobs Head Start
! !
SFUSD-Excelsior CDC ! ! !
SFUSD-San Miguel CDC ! ! !
SFUSD-Sheridan ! !
YMCA SF- Mission Branch Preschool ! ! ! !
FCC-Fellom, Julie ! !
Friends of St. Francis Childcare
Center
! ! ! ! !
SFUSD-Sanchez Elementary
School Preschool
! !
! )%!
SFUSD-Theresa S. Mahler CDC ! ! !
CDI Head Start Ella Hill Hutch
Center
! !
CDI Head Start Westside Center ! !
Chibi Chan Preschool ! ! ! !
Cross Cultural Family Center-
Marcus Garvey Center
! ! ! ! !
Little Children's Developmental Center ! ! ! !
Nihonmachi Little Friends Bush
Site
! ! ! ! !
Nihonmachi Little Friends Sutter
Site
! !
SFUSD-Dr. William Cobb Pre-K ! ! !
SFUSD-Raphael Weill CDC ! !
FCC-Cherdak, Juliya ! !
FCC-Melikyan, Gayane ! !
FCC-Moy,Xiao-Song ! !
Kai Ming, Inc.-Sunset Head Start ! !
Little Footprints Preschool ! !
CCSF-Orfalea Family Center ! !
FACES-SF Masonic Preschool ! !
Pacific Primary ! ! ! !
SFUSD-Grattan CDC ! ! !
SFUSD- John Muir Title I Pre-K ! !
Bright Horizons/Marin Day Schools-UCSF
Laurel Heights
! !
Congregation Beth Sholom Preschool ! ! ! !
SFUSD-Argonne CDC ! ! !
St. James Preschool ! ! ! !
Cross Cultural Family Center-
Richmond Center
! ! ! ! !
FCC-Yuan,Philip ! !
Happy Shalom School ! ! ! !
Kai Ming, Inc.-Geary Head Start ! !
Kai Ming, Inc-Richmond Head
Start
! !
Land's End School ! ! ! !
FCC-Chen Selina ! !
FCC- Schmit Marina ! !
SFUSD-Jefferson CDC ! ! !
SFUSD-Noriega CDC ! ! !
Wah Mei School ! ! ! ! !
SFUSD-Tule Elk Park CDC ! ! !
CDI Head Start Hunters' Point ! !
! )&!
CDI Head Start Southeast Center ! !
FACES-SF Bayview Preschool ! ! !
FCC-Suarez,Delia ! !
FCC-Underwood,Renee ! !
Frandelja Enrichment Center ! ! ! ! !
Mission Neighborhood Centers,
Inc.-Southeast Families United
Center
! !
SFUSD-Bret Harte CDC ! ! ! !
SFUSD-Dr.Charles Drew CDC ! ! ! !
SFUSD-Leola M. Havard Early
Education School
! ! !
YMCA SF-Stonestown Family Preschool ! ! ! !
SFUSD-Presidio CDC ! ! !
Catholic Charities CYO-Treasure
Island CDC
! !
SFUSD-Fairmount Title I Pre-K ! !
CDC Head Start Oceanview-
Merced-Ingleside Center
! !
Economic Opportunity Council
SF-OMI Site
! !
FCC-Khazan Larisa ! ! !
Utopia St. Thomas More Preschool ! ! ! !
Kai Ming, Inc.-North Beach Head
Start
! !
Telegraph Hill Neighborhood
Center Preschool
! ! ! ! !
Wu Yee Children's Services-
Generations CDC
! !
1st Place 2 Start ! !
CDI Head Start Sunnydale Center ! ! !
Child's Time Preschool ! ! ! !
Cross Cultural Family Center-
Visitacion Valley Family School
! ! !
Cross Cultural Family Center-
Visitacion Valley John King
Center
! !
Cross Cultural Family Center-
Visitacion Valley Tucker Center
! ! !
FCC-Chow Sandy ! !
Portola Family Connections ! ! ! !
SFUSD-E.R. Taylor Title I Pre-K ! !
SFUSD-John McLaren CDC ! !
Wu Yee Children's Services-
Sunnydale CDC
! !
Total (Out of 135) 85 50 90 34 34 52 31 5
Total % 63% 37% 67% 25% 25% 39% 23% 4%
! )'!
SF PFA Preschool Partner
Sites
Enrollment Type
Full Day Part Day School Day
C5 Children's School State
Building
!
C5 Children's School City
Building
!
CDI Head Start Cadillac
Center
!
Clara House/Helen Hawk
Children's Center
!
Compass Children's Center !
Cross Cultural Family
Center- Tenderloin Center
! !
Glide Child Care & Family
Support
!
Salvation Army Harbor
House
!
SFUSD Tenderloin
Community School CDC
!
Wu Yee Children's
Services- Golden Gate
!
Holy Family Day Home !
Mission Neighborhood
Centers, Inc.- Stevenson
Head Start Center
!
Mission Neighborhood
Centers, Inc.-Valencia
Gardens Head Start Center
!
Presidio Knolls School !
SFUSD- Bessie Carmichael
CDC
!
South of Market Child Care,
Inc.- Judith Baker Center
!
Bright Horizons/Marin Day
Schools- Main St. Campus
!
Bright Horizons/marin Day
Schools- Fremont St.
Campus
!
Bright Horizons/Marin Day
Schools- Healthy
Environments CDC
!
CDI Head Start Potrero Hill
Center
!
Mission Neighborhood
Centers, Inc.- Mission Bay
Head Start Center
!
Potrero Kids at Daniel
Webster
!
Potrero Kids at 3rd St. Site !
SFUSD - Starr King Early
Education School
!
South of Market Child Care,
Inc.- Yerba Buena Gardens
CDC
!
Chinatown Community
Children's Center
!
Kai Ming, Inc.- Powell head
Start Center
!
SFUSD- Commodore
Stockton CDC
! !
SFUSD- Gordon J. Lau Title !
! )(!
I Pre-K
True Sunshine Preschool
Center, Inc.
!
Wu Yee Children's
Services- Lok Yuen Child
Development Program
!
Community Preschool,
Grace Cathedral
! !
Buen Dia Family School !
Centro Las Olas !
Cdi Head Start Alemany
Center
!
CCSF- Mission Community
College Center
!
Family Service Agency SF-
Family Developmental
Center
!
The Family School !
FCC-Acosta, Milagros !
Good Samaritan Family
Resource Center Preschool
! !
Little Tree Preschool !
Mission Kids !
Mission Neighborhood
Centers, Inc.-Bernal
Dwellings Head Start
!
Mission Neighborhood
Centers, Inc.-Capp st Head
Start
!
Mission Neighborhood
Centers, Inc.-Regina Chiong
Head Start
!
Mission Neighborhood
Centers, Inc.- Women's
Building Head Start
!
SFUSD-Bryant CDC !
SFUSD- Cesar Chavez Title
I Pre-K
!
SFUSD-Junipero Serra
Annex CDC
!
SFUSD-Las Americas CDC !
SFUSD-Paul Revere
Elementary School PFA
Pre-K
!
SFUSD-Zaida Rodriguez
CDC
!
Kai Ming, Inc.-Broadway
Head Start
!
CCSF-Campus Children's
Center
!
FCC-Estrada, Esperanza ! ! !
FCC-Fuentes, Nancy ! ! !
FCC-Guidry, Monique ! ! !
FCC-Manzanares, Barbara ! ! !
FCC-Ramirez,Elena ! ! !
! ))!
Mission Neighborhood
Centers, Inc.-Jean Jacobs
Head Start
!
SFUSD-Excelsior CDC !
SFUSD-San Miguel CDC !
SFUSD-Sheridan !
YMCA SF- Mission Branch
Preschool
!
FCC-Fellom, Julie !
Friends of St. Francis
Childcare Center
!
SFUSD-Sanchez
Elementary School
Preschool
!
SFUSD-Theresa S. Mahler
CDC
!
CDI Head Start Ella Hill
Hutch Center
!
CDI Head Start Westside
Center
!
Chibi Chan Preschool ! ! !
Cross Cultural Family
Center-Marcus Garvey
Center
!
Little Children's
Developmental Center
!
Nihonmachi Little Friends
Bush Site
! ! !
Nihonmachi Little Friends
Sutter Site
! ! !
SFUSD-Dr. William Cobb
Pre-K
!
SFUSD-Raphael Weill CDC !
FCC-Cherdak, Juliya ! !
FCC-Melikyan, Gayane ! ! !
FCC-Moy,Xiao-Song ! ! !
Kai Ming, Inc.-Sunset Head
Start
!
Little Footprints Preschool !
CCSF-Orfalea Family
Center
!
FACES-SF Masonic
Preschool
!
Pacific Primary !
SFUSD-Grattan CDC !
SFUSD- John Muir Title I
Pre-K
!
Bright Horizons/Marin Day
Schools-UCSF Laurel
Heights
!
Congregation Beth Sholom
Preschool
!
SFUSD-Argonne CDC !
St. James Preschool !
Cross Cultural Family
Center-Richmond Center
!
! )*!
FCC-Yuan,Philip ! ! !
Happy Shalom School !
Kai Ming, Inc.-Geary Head
Start
!
Kai Ming, Inc-Richmond
Head Start
!
Land's End School !
FCC-Chen Selina ! ! !
FCC- Schmit Marina ! ! !
SFUSD-Jefferson CDC !
SFUSD-Noriega CDC ! !
Wah Mei School ! ! !
SFUSD-Tule Elk Park CDC !
CDI Head Start Hunters'
Point
!
CDI Head Start Southeast
Center
!
FACES-SF Bayview
Preschool
!
FCC-Suarez,Delia ! ! !
FCC-Underwood,Renee ! ! !
Frandelja Enrichment
Center
!
Mission Neighborhood
Centers, Inc.-Southeast
Families United Center
!
SFUSD-Bret Harte CDC !
SFUSD-Dr.Charles Drew
CDC
!
SFUSD-Leola M. Havard
Early Education School
!
YMCA SF-Stonestown
Family Preschool
! !
SFUSD-Presidio CDC !
Catholic Charities CYO-
Treasure Island CDC
!
SFUSD-Fairmount Title I
Pre-K
!
CDC Head Start
Oceanview-Merced-
Ingleside Center
!
Economic Opportunity
Council SF-OMI Site
!
FCC-Khazan Larisa ! ! !
Utopia St. Thomas More
Preschool
! ! !
Kai Ming, Inc.-North Beach
Head Start
!
Telegraph Hill
Neighborhood Center
Preschool
!
Wu Yee Children's
Services-Generations CDC
!
1st Place 2 Start ! ! !
! *+!
CDI Head Start Sunnydale
Center
!
Child's Time Preschool ! ! !
Cross Cultural Family
Center-Visitacion Valley
Family School
!
Cross Cultural Family
Center-Visitacion Valley
John King Center
!
Cross Cultural Family
Center-Visitacion Valley
Tucker Center
!
FCC-Chow Sandy ! ! !
Portola Family Connections !
SFUSD-E.R. Taylor Title I
Pre-K
!
SFUSD-John McLaren CDC !
Wu Yee Children's
Services-Sunnydale CDC
!
Total (Out of 135) 115 38 31
Total % 85% 28% 23%

FINAL THESIS

  • 1.
    ! "! University ofCalifornia, Berkeley Preschool For All: Increasing Access and Quality in California By Daniel Sparks Senior Honors Thesis Political Economy
  • 2.
    ! #! Table ofContents Introduction 3 Methodology 6 Literature Review 8 The Mixed Market for Preschool 22 San Francisco’s Preschool For All Program 34 Policy Recommendations and Limitations 63 Conclusion 72 List of Acronyms ASQ Ages and Stages Questionnaire CSPP California State Preschool Program DRDP Desired Results Developmental Profile ECE Early Childhood Education ERS Environment Rating Scale FCCH Family Child Care Home NIEER National Institute for Early Education Research PFA Preschool For All PKFLP Prekindergarten and Family Literacy Program QRIS Quality Rating and Improvement System RTELC Race to the Top – Early Learning Challenge SFUSD San Francisco Unified School District SPP State Preschool Program Special thanks to Professors David Kirp and Alan Karras for their guidance on this project and their commitment to teaching
  • 3.
    ! $! “Justice isthe first virtue of social institutions, as truth is of systems of thought. A theory however elegant and economical must be rejected or revised if it is untrue; likewise laws and institutions no matter how efficient and well-arranged must be reformed or abolished if they are unjust.” ! John Rawls, A Theory of Justice This story begins with Max Vasilio, a four year old enrolled at Capp Street Head Start Center. Located in the heart of the Mission District in San Francisco, Max’s preschool is one of nine child development centers operated by Mission Neighborhood Centers, Inc. The organization was established in 1959 as a means of consolidating local community centers and has since specialized in child development and youth services. These centers throughout the Mission serve as delegate agencies for San Francisco Head Start, offering services to more than 380 economically disadvantaged children and their families. Max’s preschool also partners with the city’s Preschool For All (PFA) program, a citywide initiative that aims to provide all of San Francisco’s four year olds with a quality preschool education. Max is finishing his final months of preschool as he prepares to transition to kindergarten next year. Mrs. Vasilio had nothing but praise for the program. “It’s good for the kids, and Max gets to learn English,” she said. 85% of the families at Max’s school are recent US immigrant families whose primary language is Spanish.1 Through a bilingual curriculum, Max is able to build on his native language and learn English as a second language. Like many preschools throughout San Francisco, Mission Neighborhood Centers’ partnership with the PFA program has enabled it to provide quality and affordable preschool to hundreds of children. PFA’s financial support and quality improvements to Mission Neighborhood Centers have opened the door for Max and many others to receive a quality preschool education. Mrs. Vasilio pays no !!!!!!!!!!!!!!!!!!!!!!!!!!!!!!!!!!!!!!!!!!!!!!!!!!!!!!!! 1 "Mission Head Start." Mission Neighborhood Centers, Inc.2014. www.mncsf.org.
  • 4.
    ! %! cost forher son’s preschool, and the center even provides her with various family services and bimonthly food distribution. “San Francisco is expensive, but Max’s school helps us stay in the city,” Mrs. Vasilio said as she collected her free produce. Without subsidized early education, many families cannot afford to live in the city let alone send their children to quality preschool. Preschool policy impacts thousands of children like Max throughout the state of California. In the absence of affordable and quality preschool programs, many families either forego sending their child to preschool or settle for schools that fail to meet acceptable quality standards. The inequities in access to quality preschool result in alarming gaps in school readiness between children from low and high-income families. By kindergarten and first grade, a disproportionate number of children from low-income families, the majority of whom are Black and Hispanic, are already behind their wealthier peers. Access to quality preschool is critical in ensuring that all children are prepared for their primary education. The benefits of preschool are extensive and well documented: children who receive a high quality preschool education have higher high school and college graduation rates, are less likely to be held back or become involved in crime, and even earn higher salaries in their careers.2 By developing and refining key social and academic skills for three and four year olds, preschool prepares children for future development and learning; in the absence of preschool learning, children forego numerous benefits and begin their academic careers well behind their peers. In spite of extensive research on the benefits of preschool, access to quality programs remains limited for California’s three and four year olds, especially for children from low- income families. Preschool policy is extremely political, and there are a number of arguments !!!!!!!!!!!!!!!!!!!!!!!!!!!!!!!!!!!!!!!!!!!!!!!!!!!!!!!! 2 "Research Shows: The Benefits of High Quality Learning." Early Edge California. 2015. http://www.earlyedgecalifornia.org/resources/research- -studies/making-the-case.html.
  • 5.
    ! &! both forand against state preschool expansion. This paper provides an introduction to the different viewpoints on preschool expansion in California that ultimately shape the preschool policy debate. These arguments are broken down into the economic and political framing of preschool policy in California. This includes but is not limited to discussions of preschool as an economic investment and the role of government in expanding access to quality preschool programs. The paper then offers an overview of the current mixed market for preschool in California, which includes a variety of public and private programs. The overview and analysis of the market for preschool offers an outline of the different programs families can send their children to as well as insight into the supply and demand for public and private options. This section argues that the current mixed market for preschool is of mixed quality; there are key areas of market failure that require government to fix, namely increasing access to quality preschool for low-income families. Using this overview of preschool policy framing and the mixed market for preschool, the paper then provides a case study of San Francisco’s Preschool For All initiative. PFA is one example of a universal preschool policy that has focused explicitly on increasing access to quality preschool programs for all four year olds in the city, but especially children from low- income families. The analysis of PFA and its impact over the past decade concentrates on funding, quality, access, and potential areas for improvement, such as expanding the program to incorporate three year olds. By providing an in depth analysis of PFA, this paper offers one policy model for increasing preschool access and quality for all children but particularly for those most in need and who stand to benefit the greatest. The benefits of preschool are too great and the stakes too high for any child to miss out on a quality preschool education. Access to quality preschool is a right, not a privilege. The state has an obligation to fill the gaps in access
  • 6.
    ! '! to preschoolthat exist in the current market and ensure all children’s right to a fair start to their education. This paper analyzes the policy frameworks and market for preschool to see how the state of California can increase access to quality preschool for all of its three and four year olds. The PFA initiative in San Francisco shows the potential for policy to increase access to preschool without jeopardizing quality and serves as one possible model for creating a more just and inclusive preschool system in California. Methodology The methodologies employed in this paper include interviews, text analysis of media discourse, and quantitative and qualitative data analysis. These research methodologies were used to support the central goal of this paper: to provide insight into preschool policy in California and to point out the potential for policy to increase access to quality preschool for all children, but especially those from low-income families. Interviews cited throughout this paper include personal interviews with policy officials, members of the Preschool For All program in San Francisco, and families who currently send their children to a PFA partner preschool. The interviews directly cited in the paper were all conducted through an informal interview process; conversations with policy advisors, officials, and families were intended to generate a dialogue regarding preschool policy in California, paying close attention to the topics of access and quality. Accordingly, there was no formal questionnaire used in interviews with Scott Moore, Chief Policy Advisor at Early Edge California, Matthew Rector, Program Administrator for PFA, Xavier Morales, Data Analyst for PFA, and families currently participating in the PFA program in San Francisco, which are cited throughout the paper.
  • 7.
    ! (! In orderto observe trends in media discourse surrounding preschool policy in California, I used data mining and text analysis. I collected a sample of 203 newspaper articles related to preschool education in California. These articles were selected on the basis of relevance and newspaper source. Each article selected is tagged by its respective newspaper source in the “preschool education” category and was published between 2005 and present. Articles were not discriminated on the basis of preschool policy level, meaning that the sample of articles includes topics ranging from local to national preschool policy. All articles were sourced from the top ten newspapers in California based on subscription rates, a list that includes the San Francisco Chronicle, Los Angeles Times, Sacramento Bee, San Diego Union-Tribune, Fresno Bee, Orange County Register, San Francisco Examiner, and the San Jose Mercury.3 Article content was then mined on the basis of three criteria: most frequently used words, bigrams, and trigrams. This criteria excludes stock words, such as articles and prepositions, which were removed in the data mining process. Bigrams and trigrams refer to two and three word phrases, respectively, used in the sample of articles. A full list of most frequently used words, bigrams and trigrams from the sample can be found in the appendix. Last, this paper uses qualitative and quantitative data analysis of both original and cited data sets. Qualitative data analysis of cited sources includes more in depth exploration of data sets in the chapter on the mixed market for preschool in California. The qualitative analysis of cited sources such as the Rand Corporations series of reports on the nature and quality of preschool and the National Institute for Early Education Research’s annual yearbooks offers valuable data on the breakdown of the preschool market in California and state spending. Data specific to PFA in San Francisco was prepared by First 5 SF and the PFA program and !!!!!!!!!!!!!!!!!!!!!!!!!!!!!!!!!!!!!!!!!!!!!!!!!!!!!!!! 3 "Top 10 Daily California Newspapers." Cision. March 3, 2010. !
  • 8.
    ! )! forwarded tome for the purposes of this project. This includes tables that detail the enrollment of four year olds in PFA programs versus Proposition H funding allocation, percent of children enrolled in PFA preschools compared to non-PFA preschools based on family income, San Francisco Quality Rating and Improvement System ratings by neighborhood, program funding type, and the number of children enrolled in PFA preschools by neighborhood. Analysis of this data provides essential information for better understanding the effectiveness of PFA as measured through quality and access. The chapter on San Francisco PFA also includes quantitative and qualitative analysis of original data sets. Using the most recent Census data, I was able to break down San Francisco neighborhoods with participating PFA preschools by median household income. I then compared this data with tables on PFA preschool quality and child enrollment provided by First 5 and the PFA program to see if a correlation exists between median household income and access to quality preschool. Tables displaying the highest and lowest five neighborhoods by median household income along with the number and percentage of children enrolled in PFA preschools offer useful information on who the program is serving and the quality of preschools these children are attending. Interviews, text analysis of media discourse, and data analysis comprise the primary research methodologies employed in this paper and offer both qualitative and quantitative data for better understanding the market for preschool, its gaps, and potential policies for improving access to quality preschool for three and four year olds in California. I. Literature Review The changing dynamics of policy framing in California by both scholars and government can be broken down into several categories, namely economics, the role of government, and recent policy innovations. Within each of these categories are sometimes nuanced arguments in
  • 9.
    ! *! support ofor against preschool expansion initiatives. Within some of these categories, arguments and scholarly works offer diametrically opposed views of Early Childhood Education (ECE). In both cases, the following literature review presents the various opinions, arguments and theoretical foundations of early education that very much shape the way in which preschool is framed in policy debates throughout California. The literature included is meant to highlight the predominant arguments for and against preschool expansion and to provide a foundation for better understanding preschool policy in California. An Economic Perspective The issue of early education is often framed in economic terms. Economists use cost/benefit analysis to assess whether or not various early education initiatives are sound policy. While there is extensive literature and research on the matter, there is no consensus on the issue. Economic perspectives on early education shape its framing by defining preschool as either a positive or negative net investment. A number of scholars, journalists, and other professionals offer the compelling argument that greater access to preschool will lead to long-term economic growth, thereby framing preschool initiatives as a sound investment in California’s future. For instance, Lynn Karoly argues in “Preschool Adequacy and Efficiency in California” that quality preschool is a necessary investment in California’s children and in ensuring economic growth moving forward. The author argues throughout that “benefits to government or society will exceed program costs” with regard to quality preschool programs because said initiatives will increase investment in human capital for children in families of all income levels.4 The Packard Foundation draws on previous Rand research reports in its support for initiatives that expand access to preschool in California: $2.50 to every dollar would go back to the state if !!!!!!!!!!!!!!!!!!!!!!!!!!!!!!!!!!!!!!!!!!!!!!!!!!!!!!!! 4 Karoly, Lynn. "Preschool Adequacy and Efficiency in California." RAND Corporation, 2009.
  • 10.
    ! "+! universal preschoolbecame policy.5 This is a conservative estimate for economic Nobel laureate James Heckman, who argues that every dollar spent on preschool offers a return of seven dollars to society.6 Their framing of the issue is straightforward – preschool benefits the state economy and represents a positive investment opportunity in California’s future. Karoly and Bigelow expand on the economic framing of preschool in California. The authors again suggest that preschool offers the state a positive net investment. More specifically, they argue the previous estimates of economic return to the state are undervalued because they fail to incorporate other social benefits that result from attending preschool. Increased access to high-quality preschool reduces crime and dependence on public welfare as well as increases health and labor force participation.7 In turn, these benefits offer positive returns to the state and support calls to expand access to quality preschool programs. Scott Moore, the former executive director of the California Early Learning Advisory Council and current chief policy advisor at Early Edge California, offers a direct and transparent explanation of his support for state-sponsored preschool. Much like the aforementioned authors, Moore frames preschool as an economic investment, but goes a step further in suggesting that not investing in it is equivalent to “mortgaging our future.”8 Moore addresses opponents of preschool expansion, namely those who bring up fiscal constraints and economic instability as counterarguments, by arguing that early education is in fact the best area for state investment in terms of improving the economy moving forward. In emphasizing that “the best return on our !!!!!!!!!!!!!!!!!!!!!!!!!!!!!!!!!!!!!!!!!!!!!!!!!!!!!!!! 5 "Preschool Adequacy and Efficiency in California: Issues, Policy Options, and Recommendations." The David and Lucile Packard Foundation. January 1, 2009. 6 !Kirp, David. "California Should Give All Kids the Pre-K Advantage." Los Angeles Times, January 1, 2014.! 7 Karoly, Lynn, and James Bigelow. "The Economics of Investing in Universal Preschool in California." RAND Corporation, 2005. http://www.rand.org/pubs/monographs/MG349z1.html. 8 Mongeau, Lillian. "Not Investing in Preschool Is 'Mortgaging Our Future'"EdSource, March 11, 2013.
  • 11.
    ! ""! investment isearly education,” Moore offers a very basic economic framework for better understanding the potential benefits of expanding quality preschool programs.9 While numerous articles and reports tout the economic benefits of investing in preschool, there is a tremendous amount of dissent that also uses economics to justify their viewpoints. As with almost any policy involving taxes and additional state spending, the issue has become quite contentious, especially after the Great Recession when California was struggling to manage its budget. It should already be apparent that, because spending and taxes are highly sensitive political issues, the economics and politics of preschool expansion do not always coincide and point in the same policy direction. Those against state expansion of preschool use their own economic data in framing policy. Michael Boskin, professor of economics at Stanford University, labels preschool expansion initiatives as pet projects for state government. He states that increased state spending on preschool and, specifically, universal pre-K is poor spending and tax policy.10 Instead of focusing on the investment in human capital, as the aforementioned authors in favor of preschool expansion do, Boskin argues that the likely increase in sales or income tax (or both) will further detract from the California economy and discourage business investment. From a conservative economic perspective, Boskin points out that increased spending on preschool is fiscally irresponsible and unsustainable. By reducing the incentives for businesses and firms to operate in California, increased taxes and spending will result in capital flight from the state economy.11 In her piece “Is Universal Preschool beneficial,” Lisa Snell evokes similar economic concern in her framing of ECE and preschool in California. Snell contrasts sharply with the view !!!!!!!!!!!!!!!!!!!!!!!!!!!!!!!!!!!!!!!!!!!!!!!!!!!!!!!! 9 Ibid. 10 Boskin, Michael. "Quit Taxing the Rich to Fund Your Pet Projects." Los Angeles Times, May 1, 2006. Note: pre-K is different from preschool in that all pre-K programs have program standards and focus specifically on school readiness. Pre-K programs serve three and four year olds, which is usually the case for preschool programs but not always. In general, pre-K programs are associated with higher quality learning environments than preschool, although this is not always the case. 11 Ibid.
  • 12.
    ! "#! that increasedstate investment in preschool will actually promise a return on investment. Snell argues that it is will cost taxpayers billions of dollars to expand preschool, and adds that many of its benefits are overestimated by think-tanks like Rand.12 Furthermore, the author’s work suggests that optimistic economic forecasts leave out the state’s track record in maintaining a fiscally responsible budget. As such, the potential economic benefits of preschool are heavily outweighed by the economic impacts of increased taxes and state spending. Still, the economic framing of preschool policy in California is not limited to the traditional liberal and conservative viewpoints just mentioned. While cost/benefit analyses play a crucial role in the framing of early education, calls for greater efficiency and proper management of programs already in place also have a significant role in the framing of preschool policy. For instance, Loeb, Bryk and Hanushek argue that “the ways in which the available resources” are used matter most in increasing the return on the investment in early education (as well as primary education).13 The authors suggest that in framing the debate on preschool expansion, policy- makers should focus less on investment or divestment and more on using resources efficiently for programs already in place. They further contend that preschool programs “spend money as the regulations demand, not necessarily to meet the needs of their students.”14 Focusing solely on the return on investment can detract from efficiency. Accordingly, any economic justification for preschool expansion must first address the proper allocation of resources and efficient use of these resources already supporting programs. Role of Government !!!!!!!!!!!!!!!!!!!!!!!!!!!!!!!!!!!!!!!!!!!!!!!!!!!!!!!! 12 Burke, Lindsey, and Lisa Snell. "Universal Pre-K May Not Be as Good as It Sounds." Reason Foundation, 2014. http://reason.org/news/show/universal-pre-k-may-not-be-as-good. 13 Loeb, Susanna, Anthony Bryk, and Eric Hanushek. Getting Down to Facts: School Finance and Governance in California. Stanford University, 2007: 7. 14 Ibid.
  • 13.
    ! "$! The scopeof preschool policy depends on what is considered to be the proper role of the state: is access to quality preschool a responsibility of the state, and what role should government play in the market for preschool? Much of the literature regarding this topic is highly political and draws on theoretical foundations of the role of the state. The existing body of research and literature highlights the fact that ideology, specifically on the role of government, is inseparable from the issue of increasing access to quality preschool. “Preschool For All” and several other articles published by the Goldwater Institute, a libertarian policy think tank, address supporters of preschool expansion in California as “nanny- statists.”15 The authors borrow the term “nanny-statism” from previous political debates (such as Head Start in the 1960s), in which conservatives felt the role of government was extending too far into the realm of personal choice. The authors do not reject the notion that early education has the potential to help many children, but rather that the means of creating such a system would result in the largest “expansion of government into education since the creation of public schools.”16 While preschool may indeed benefit children, the authors suggest that the magnitude of government expansion is not justified for a problem that the current mixed market and programs already in place can solve. Families and the current preschool system should account for child development and school readiness, as the Goldwater Institute claims, not additional government expansion. In a similar fashion, Olsen and Snell characterize the expansion of preschool and ultimate adoption of universal preschool in California as “de facto institutionalization” and an “entitlement program that subsidizes the preschool choices of middleclass and wealthy !!!!!!!!!!!!!!!!!!!!!!!!!!!!!!!!!!!!!!!!!!!!!!!!!!!!!!!! 15 "Preschool For All!" Goldwater Institute. October 8, 2007. http://goldwaterinstitute.org/article/preschool-all-0. 16 Ibid.
  • 14.
    ! "%! families.”17 In thisway, the authors expand on anti-early education arguments by incorporating market and limited government ideology. The current market for preschool is mixed, meaning children can receive their preschool education from either publicly supported or private preschools.18 However, the authors argue that preschool expansion in California would completely restructure the market by creating a state controlled monopoly and thereby limit families’ freedom of choice. The extension of state would impede the already efficient functioning of the mixed market for preschool and allow state government to make decisions that should otherwise be limited to family discretion. Los Angeles Times reporter Karin Klein offers another critical perspective on preschool. She denounces calls for preschool expansion in California, raising concerns over the potential for a “scary preschool utopia.”19 Her argument is based on the ideological assumption that state government has no right to obstruct or substitute for family choice. Rather than building bureaucracy, Californians should focus on building better families.20 Klein does not refute the benefits of ECE and preschool specifically; instead, she suggests that government is already doing enough to promote access. Klein holds that the current state-market relationship has led to an efficient preschool system and that less emphasis should be placed on state-led preschool expansion. Others, such as David Kirp of UC Berkeley’s Goldman School of Public Policy, view access to quality preschool as a primary responsibility of the state. From his numerous articles, such as “California Should Give All Kids the Pre-K Advantage,” he argues that the state is !!!!!!!!!!!!!!!!!!!!!!!!!!!!!!!!!!!!!!!!!!!!!!!!!!!!!!!! 17 Olsen, Darcy, and Lisa Snell. "Assessing Proposals for Preschool and Kindergarten." Reason Foundation, 2006. http://reason.org/news/show/assessing-proposals-for-presch. 18 Note: please see chapter two, “The Mixed Market for Preschool,” for an in depth explanation and analysis of the market for preschool in California.!! 19 Klein, Karin. "Scary Preschool Utopia." Los Angeles Times, June 5, 2005. 20 Ibid.
  • 15.
    ! "&! responsible forleveling “the playing field for hundreds of thousands of poor children.”21 In reviewing the array of benefits that come with a quality preschool education, such as increased graduation rates and participation in higher education, Kirp suggests that the government should ensure the right for all children to have access to quality preschool programs. On a more ideological level, Kirp holds that the state has a responsibility in addressing poverty, and state- sponsored early education offers one such way to ensure that poverty is not destiny.22 The issue of ECE is not just about freedom of choice or nanny-statism. Preschool policy begs the all- important question of who is responsible for solving some of the grave inequities that exist in society. According to Kirp, the state can be the principal agent in reducing such inequities, and expanding access to preschool offers one policy area that can help to accomplish this. Education reporter Sarah Garland also frames the issue of preschool expansion as a state responsibility in narrowing the well-known and reported gap between students in California. In her report, the author highlights the fact that the achievement gap starts early in California; in fact, studies have shown that an achievement gap exists before children even begin attending school.23 As a result, Garland points to increased access to quality preschool as one possible state solution for creating a more equitable education system – one that addresses inequalities in access that exist between different racial and socioeconomic groups. By expanding and improving the preschool quality, the state of California may better fulfill its responsibility of providing an equitable and just education system that offers all children a fair chance to succeed. Indeed, preschool policy can be framed as a matter of the state ensuring fairness and justice in education for all children in California. Bernstein, a political and policy correspondent for Reuters, identifies preschool as critical in upholding all kids’ right to a fair start. She notes !!!!!!!!!!!!!!!!!!!!!!!!!!!!!!!!!!!!!!!!!!!!!!!!!!!!!!!! 21 Kirp, David. 2014. 22 Ibid. 23 Garland, Sarah. "More, Better Early Education Could Help Close California's Achievement Gap." The Hechinger Report, October 24, 2011.
  • 16.
    ! "'! that “higherincome families are already making sure their children have access” to high quality early education; it should be up to the state to ensure access to the many families who cannot afford such a luxury.24 Bernstein suggests that the state is not only responsible for closing the achievement gap in California, but is the only viable actor in closing the gap. The market alone will not address the inequities inherent in the current system. The significance of preschool policy is framed such that access to quality preschool is a right, not a privilege, of all children and a direct obligation of the state. Policy analyst Linda Jacobson expands on this framework in her comprehensive report, “On The Cusp in California.” She offers policy recommendations on the primary grounds that the state “can- and should- be” doing much more to ensure equal access to early learning experiences.25 In addressing the discrepancies in access between high and low-income families, Jacobson specifically calls on the state to expand access to preschool as a means of closing the achievement gap and improving education for economically disadvantaged families. Throughout the report, Jacobson draws on disparities in access, quality and inequitable distribution to emphasize the failure of state government in providing a fair start for many children in California.26 A social justice perspective is implicit in Jacobson’s report: it is the state’s responsibility to provide preschool to children who need it most, namely low-income families. State officials have a responsibility to show leadership and to advance preschool and other ECE reforms in California.27 For Jacobson, preschool expansion offers the state a concrete opportunity to narrow the opportunity gap between high and low-income families and ultimately reduce !!!!!!!!!!!!!!!!!!!!!!!!!!!!!!!!!!!!!!!!!!!!!!!!!!!!!!!! 24 Bernstein, Sharon. "In Newly Solvent California, Dems Propose Free Preschool." Huffington Post, January 7, 2014. 25 Jacobson, Linda. "On The Cusp in California: How PreK-3rd Strategies Could Improve Education in the Golden State." New America Foundation, 2009: 3. 26 Ibid. 27 Ibid, 33.
  • 17.
    ! "(! poverty. Theopportunity to combat educational inequities inherent in the system should not be wasted, especially given the tremendous body of research touting the benefits of preschool. The Sandbox Investment by Kirp provides a narrative of the ECE movement throughout America but devotes several portions specifically to California. While he addresses the views of prominent members involved in the preschool policy debate in California such as Fuller, Snell, Hill-Scott and Boskin, Kirp ultimately acknowledges the significance of regulation in the promotion and expansion of quality preschool. He suggests that “competition can strengthen quality… but only if parents have good information and government sets sensible standards”; in addition, an unregulated market for preschool will not increase the availability of usable information to families and will, in all likelihood, hinder the quality of education for most children.28 Kirp recognizes the importance of the state in facilitating meaningful change in preschool policy that promotes both access and quality. The author’s work also highlights the relevance of preschool policy in California politics. Preschool is now a prominent policy issue in California state politics that all policy-makers are well aware of. By providing a narrative of the preschool debate in California, Kirp reminds us that preschool policy needs to focus on kids’ future rather than politics. The importance of politics in expanding access to preschool cannot be stressed enough, but the far-reaching impact of comprehensive preschool reform reiterates the need to overcome political gridlock. Bruce Fuller, Alejandra Livas and Margaret Bridges present the case for a more decentralized approach in their report on how to expand and improve preschool in California. The authors, all prominent academics in the field of ECE, point out that policy options are not limited to maintaining the status quo of a mixed preschool market or expanding to a state- controlled market. Instead, the authors contend that decentralizing early education policy may !!!!!!!!!!!!!!!!!!!!!!!!!!!!!!!!!!!!!!!!!!!!!!!!!!!!!!!! 28 Kirp, David. The Sandbox Investment: The Preschool Movement and Kids-First Politics. Cambridge: Harvard University Press, 2007:222-223.
  • 18.
    ! ")! address flawsin the system, namely gaps in access and quality. The report suggests, “the ideal system from a parent’s vantage point would be a single and inviting point of entry”; in other words, a more efficient system might entail localized options from either government, private, or community organizations.29 The authors address the pros and cons of the status quo and potential for universal preschool while embracing a more decentralized policy framework. They claim the current mixed market fails to address quality disparities between communities while state-controlled preschool would likely increase standardization and uniformity in early education.30 On the other hand, decentralizing early education may consolidate programs and simplify the process for both families and organizations by county. Fuller’s book, Standardized Childhood, delves deeper into the role of government in promoting promoting. Most importantly, the author frames the role of government as one that increasingly must be defined by decentralization in California. In this way, Fuller is not questioning whether the government has a role, but which kind of role the government has in proposing initiatives and implementing programs.31 He addresses the primary concern of many limited government advocates by stating that preschool policy debates should incorporate democratic discussion over how to “strengthen the capacity of families” so they may be better able to make decisions for themselves.32 The author warns against the possibility of a state- controlled early education system and contends that the extent of government intervention needs to be limited. A state-controlled system would result in the standardization of education and become another entitlement program that fails to close achievement gaps and reduce inequities in education. Accordingly, Fuller suggests that the role of government should be to support !!!!!!!!!!!!!!!!!!!!!!!!!!!!!!!!!!!!!!!!!!!!!!!!!!!!!!!! 29 Fuller, Bruce, Alejandra Livas, and Margaret Bridges. "How to Expand and Improve Preschool in California." Policy Analysis for California Education, 2006:21. 30 Ibid. 31 Fuller, Bruce. Standardized Childhood. Stanford: Stanford University Press, 2007: 150. 32 Ibid. 274.
  • 19.
    ! "*! collective actionlocally. More specifically, decentralizing early education policy and programs to local counties would lead to “an easier-to-access, higher quality network of organizations and caregivers.” 33 Fuller’s suggested preschool policies frame preschool as an opportunity for the state to support and nurture more local, culturally based early education programs rather than establish its own universal system of preschool. Innovative Policy Public policy and especially issues such as early childhood education are dynamic: policymakers, academics, and experts in the field are always looking for solutions to social issues or, for the purposes of this research, the best policy frameworks for either expanding or contracting state-supported preschools in California. San Francisco’s Preschool For All (PFA) program helps to reframe the preschool policy debate. PFA offers an example of policy with an explicit mission to increase access to all children in San Francisco, but especially low-income families. The program’s demonstrated impact on increasing access to quality preschool highlights the importance of preschool policy and its potential to transform the educational experience and opportunities of children throughout the city. The existing body of research and policy analysis on this particular program is limited, offering one area for greater research and analysis. Jill Tucker, an education reporter for the San Francisco Chronicle, highlights PFA’s ability to counter some of the previously mentioned arguments against preschool expansion. She notes the program’s high quality standards and financial support of under-resourced preschools in the city. Tucker also alludes to the program’s funding of both public and private preschools and family centers. By working within the mixed market for preschool in San Francisco, PFA’s !!!!!!!!!!!!!!!!!!!!!!!!!!!!!!!!!!!!!!!!!!!!!!!!!!!!!!!! 33 Ibid. 285.
  • 20.
    ! #+! partnerships witha variety of program types has no doubt contributed to the city’s well above average preschool enrollment rates.34 PFA has helped to increase enrollment for all children in the city but particularly for children from economically disadvantaged families. Given this success, the author contends that the program could serve as a model for other counties and even the state in restructuring preschool and other early education policies. PFA’s ability to expand access to quality preschool through both public and private partnerships while enhancing quality may prove crucial in shifting the framework for preschool policy in California. Text Analysis In addition to this literature review, text analysis of a sample of over 200 newspaper articles helps to lay the foundation for better understanding preschool policy in California. The media discourse analysis included in this paper gives insight into the political rhetoric of preschool policy. It also highlights some of the major areas of discussion, namely financing preschool, which groups need preschool services, and the quality of programs. For example, how to finance preschool initiatives is clearly an integral part of the policy discussion. The word “budget” is used 338 times in the sample, and “money” and “funding” are used 243 and 205 times, respectively. Given California’s recent budget woes and recovery from the recession, it makes sense that these words are used so frequently in preschool policy discourse. This further emphasizes the role of economics in preschool policy. Both supporters and opponents of preschool expansion draw on economic arguments, usually that preschool expansion is either fiscally irresponsible or a positive investment in the state’s future. Moreover, issues of access and quality are apparent in the discourse. “Income” is used 333 times, and “Low-income Families” is a top bigram and trigram with regard to frequency. !!!!!!!!!!!!!!!!!!!!!!!!!!!!!!!!!!!!!!!!!!!!!!!!!!!!!!!! 34 Ibid.!
  • 21.
    ! #"! This indicatesthat much of the discourse surrounding preschool policy includes discussions over who is in need of access to ECE. Discrepancies in preschool participation rates based on family income persist, and low-income families in California have less access to quality preschool programs.35 “Universal” is used 182 times and “Universal Preschool” is a top bigram; “access” itself is mentioned ninety-eight times in the text. The frequency of these terms in the discourse suggests that certain groups are in need of greater access to preschool. It is evident, too, that low and middle-income families are central to the policy debate. Preschool expansion and calls for universal preschool center around leveling the playing field and increasing access for all of California’s children, but especially children from economically disadvantaged families who stand to gain the most from such policies.36 Disparities in access are apparent in the discourse and are inherently linked to the role of the state. Universal and targeted approaches to increasing access to preschool involve the state in some capacity, and the “State,” “State Preschool,” and “Public Preschool” are amongst the most frequently used terms. The role of government is a major issue in preschool policy, and the media discourse affirms the importance of the state in promoting access. Last, quality is commonly used in preschool discourse. “Quality” is used 215 times in the sample of articles, and “High Quality” and “Quality Preschool” are most frequently used bigrams. The use of quality in discourse is critical – increased access to preschool will have a negligible impact if quality is not high. The quality of preschool programs is key, and the frequency of “quality” terms in the discourse points to its significance in policy discussions. Text analysis of media discourse shows that access and quality are dominant points of discussion in preschool policy debates. The role of the state and economics are also main lenses through which !!!!!!!!!!!!!!!!!!!!!!!!!!!!!!!!!!!!!!!!!!!!!!!!!!!!!!!! 35 Note: please see “Gaps in the Mixed Market” for specific details on preschool participation rates by income in California. $'!Schumacher, Kristin. "Reinvesting in California’s Children: Preschool for All?" California Budget and Policy Center. May 7, 2014.!
  • 22.
    ! ##! preschool policyis framed. The full list of top words, bigrams, and trigrams can be found in the appendix. By breaking preschool policy down by economics, the role of the state, and policy innovations and analyzing media discourse, the reader is more easily able to understand the key frameworks of preschool policy in California. Whether viewing preschool expansion as a sound economic investment or unsubstantiated extension of the state, these perspectives offer insight into the changing dynamics of the relationship between state and market and its influence on preschool policy. Furthermore, the issue of ECE offers one area for new policy innovations and state-market dynamics. The literature provides theoretical, qualitative and quantitative support for a wide range of viewpoints on preschool. The diversity of opinions suggests that a consensus on preschool policy is far from being reached in California. It also calls for more in depth analysis on the market for preschool in the hopes of highlighting potential areas for improvement moving forward. II. The Mixed-Market for Preschool The history of California’s mixed market for preschool dates back to 1965. During this time, the state of California created the State Preschool Program (SPP), which was created in the hopes of better serving at-risk children who did not otherwise have access to quality preschool.37 The program’s implementation was in part facilitated by nationwide efforts such as Head Start, which sought to improve child services and access to preschool by placing particular emphasis on low-income families and families living below the poverty line. Prior to California’s SPP, preschools did not receive funding from the state; instead, center-based programs were either !!!!!!!!!!!!!!!!!!!!!!!!!!!!!!!!!!!!!!!!!!!!!!!!!!!!!!!! 37 Barnett, Stephen, Megan Carolan, James Squires, and Kirsty Brown. "The State of Preschool 2013." National Institute for Early Education Research, 2013. 36.
  • 23.
    ! #$! privately fundedor funded by local initiatives. Thus, it was not until 1965 that California’s market for preschool education became mixed, offering both state-funded and private options for families to choose from. The SPP provided a basis for state preschool education policy, helping to shape the programs that currently make up state-funded options offered within California’s mixed market for preschool. Fast-forwarding to 2007, the state created the Prekindergarten and Family Literacy Program (PKFLP), offering half and full day services for families at or below seventy percent of state median income.38 Shaped after the SPP, the PKFLP’s scope expanded to include an additional literacy component. By 2008, the state of California streamlined its many ECE programs, including the SPP, PKFLP, and General Child Care programs such as First 5 California, to create the California State Preschool Program (CSPP).39 The CSPP consolidated funding for the aforementioned state-funded programs that serve eligible three and four year olds across the state. The CSPP is now the largest state-funded preschool program in the country; it provides services ranging from meals for children to parent education and is administered through local education agencies, colleges, and nonprofits.40 While the CSPP provides an example of the state’s contributions to the mixed market for preschool, looking at actual enrollment rates for private, public, and home-based preschool education presents a more holistic framework for understanding the preschool system in California. Because California’s market for preschool consists of both public and private options, it is difficult to find comprehensive data that accounts for children participating in various types of center-based programs and home-based programs such as Family Child Care Homes. A series of Rand reports on preschool quality and efficiency gives extensive data on participation rates and !!!!!!!!!!!!!!!!!!!!!!!!!!!!!!!!!!!!!!!!!!!!!!!!!!!!!!!! 38 Ibid. 35.! 39 Ibid. 40 "Child Care and Development Programs." California Department of Education. March 20, 2015. http://www.cde.ca.gov/sp/cd/op/cdprograms.asp.
  • 24.
    ! #%! the marketfor preschool in California. Their work is a series of technical reports based on the organization’s own representative sample of preschool age children in California, including three and four year olds. The data sample is intended to provide further insight into the types of programs used by families throughout the state. The reports also detail types of funding associated with each program, in turn indicating the socioeconomic factors that may go into a family’s decision of which type of preschool to send their child to. It is critical to note that more than half of California’s preschoolers, including three and four year olds, attend center-based preschool programs.41 These programs, as defined by Karoly et al., include Head Start Centers, preschools, prekindergartens, nursery schools, and child-care centers. They may also be defined as programs that are not home-based with regard to either the child or provider’s home.42 Table 1.0 displays program arrangements for preschool-age children, categorizing the setting types as center-based, relative care, or nonrelative care. 43 Table 1.0 displays the distribution of early childhood education programs for three and four year old children. The study was conducted with sample size 2,025 children. Of those 2,025 children, 1,016 were three years old and 1,009 were four years old. As Table 1.0 shows, the majority of surveyed parents, about fifty-nine percent, reported sending their child to a center-based program compared to twenty percent and thirteen percent for relative and nonrelative care, respectively.44 The total distribution of children attending center-based programs is brought down by three year olds, a group that has lower participation rates in all !!!!!!!!!!!!!!!!!!!!!!!!!!!!!!!!!!!!!!!!!!!!!!!!!!!!!!!! 41 "Most California Children Attend Center-Based Preschools; Educational Quality of Programs Falls Short." Rand Corporation, 2008. 42 Karoly, Lynn, Bonnie Ghosh-Dastidar, Gail Zellman, Michal Perlman, and Lynda Fernyhough, “Prepared to Learn: The Nature and Quality of Early Care and Education for Preschool-Age Children in California.” RAND Corporation, 2008. 36. 43 Ibid. 40. 44 Ibid. 39.!
  • 25.
    ! #&! local, state,and federal preschool programs. This discrepancy in three and four year old preschool participation rates is consistent with other existing data on preschool participation rates. It is worth mentioning that the distribution of setting types for three and four year olds does vary slightly with the data collected from providers rather than the families themselves. Based on provider survey data, fifty-seven percent of four year olds and forty-two percent of three year olds attend center-based programs.45 Altogether, the percentage of both three and four year olds participating in center-based programs is equal to roughly half of all children. In spite of these minor variations, the main take-away from this data remains the same: the majority of children attend center-based programs as opposed to home-based preschool. The demand for center-based programs highlights the relevance of the market for preschool in both the private and public sectors. Given the growing demand for center-based programs, it is especially important to examine the distribution of setting types within the center-based category. The breakdown in preschool participation for center-based programs offers a closer look at the differences between public and private preschool attendance in California. Table 2.0 displays program type in center-based settings for preschool-age children including three and four year olds. 46 Table 2.0. The above information is based on a sample size of 615. In contrast to previous tables included in this report, Table 2.0 includes percentages that are based on survey data from preschool providers rather than households. !!!!!!!!!!!!!!!!!!!!!!!!!!!!!!!!!!!!!!!!!!!!!!!!!!!!!!!! 45 Ibid. 80. 46 Ibid.
  • 26.
    ! #'! In total,thirty-seven percent of three and four year olds attend publicly funded preschool.47 This includes children enrolled in Head Start, Title V (i.e. California State Preschool), or public school prekindergarten programs. Twenty percent of children are enrolled in private preschool programs, twenty-seven percent in independent preschools or nursery schools, and sixteen percent in child-care or other.48 The data also suggests that more four year olds are enrolled in publicly funded programs compared to three year olds. While there is no dominant program type, publicly funded program types represent the largest percentage of center-based programs. The distribution in participation rates between private, independent, child-care/other, and publicly funded preschools confirms the mixed nature of the market for preschool in California. In the absence of a universal early education system, families in California are left with a number of options regarding where to send their child to preschool that varies depending on program type, cost, and affordability. For the most part, they prefer to send their children to center-based programs and, within this, publicly funded programs that may offer free or reduced cost preschool. Still, tuition and accessibility of the aforementioned center-based programs is inconclusive. Although the distribution of participation rates in center-based programs indicates a mixed market for preschool in California, it does not entirely indicate which programs are accessible to whom. A deeper analysis of program fees offers a more transparent view of the market for preschool and which aspects of the market are serving whom. From Table 5.0 below, it is evident that sixty-two percent of children attending preschool in center-based programs are part of programs that charge a fee.49 This does not suggest that children attending programs with !!!!!!!!!!!!!!!!!!!!!!!!!!!!!!!!!!!!!!!!!!!!!!!!!!!!!!!! 47 Ibid. 48 Ibid. 80. “Other” entails centers that provide preschool services but are not necessarily labeled as preschool. One example includes recreation- center programs.! 49 Ibid. 83.
  • 27.
    ! #(! tuition allpay the same amount; rather, the majority of programs that do charge a fee offer either sliding-scale tuition, adjusted based on family income, or need-based scholarships.50 Thus, about forty percent of three and four year olds enrolled in center-based programs attend preschools that require no fee. These programs that require no fee predominantly consist of publicly funded programs, such as Head Start, First 5, and Title V preschools. 51 Table 5.0. The information provided shows the percentage breakdown of programs included in the Rand study that charge fees or participate in public subsidy programs. It is also important to note that these percentages are for center-based programs only and include statistics for both three and four year olds. The table highlights that while the majority of programs charge a fee, there are still opportunities for alternative funding through sliding-scale fees and need-based scholarships. This information will be especially relevant in analyzing the PFA program in San Francisco, which provides services to programs that charge fees as well as participate in public subsidy programs. The differences between programs with and without fees do not relate to either type of school’s ability to accept public subsidies. Although sixty-two percent of schools charge fees, more than eighty-five percent of center-based programs accept some form of public subsidies.52 These subsidies include but are not limited to vouchers, Head Start contracts, First 5 contracts, !!!!!!!!!!!!!!!!!!!!!!!!!!!!!!!!!!!!!!!!!!!!!!!!!!!!!!!! 50 Ibid.! 51 Ibid. 52 Ibid.
  • 28.
    ! #)! and otherlocal or county school district subsidies. Table 5.0 looks mostly at fees and subsidies for programs, but it does provide an estimate for the total percentage of three and four year olds in center-based programs that are subsidized – just over thirty percent of total children enrolled.53 The dollar amounts of the subsidies received by those thirty percent remain uncertain, but the data does offer critical insight into some of the factors that influence the distribution of participation within private, public, independent, and other preschool programs. The amount of subsidies and funding for public programs depends on government funding at the local, state, and federal levels. Depending on its type, each program may be eligible to receive funding from one or all levels of government. For instance, Head Start centers receive federal funding since the program is a nationwide initiative; First 5 California centers receive mostly state funding but, as is often the case, receive some funding from the counties they serve. Since this section details the political economy of preschool in California, it is important to pay special consideration to the state’s role in funding public programs. Table 6.0 displays state spending per child enrolled in public programs from 2002 to 2013. State spending on preschool appears to have remained relatively constant between 2005 and 2008, with a slight decrease from roughly $4,200 per student to $4,000 occurring at the onset of the Great Recession. The data included in Table 6.0 also suggests that state preschool spending increased dramatically from 2009 to 2010 to just over $5,800 per child enrolled. It should be cautioned that this apparent increase in state funding is a product of program consolidation rather than an actual increase from previous years.54 The 2008 California State Preschool Program Act streamlined funding for state preschool programs, including the Prekindergarten Family Literacy Program and General Child Care Program, and was fully !!!!!!!!!!!!!!!!!!!!!!!!!!!!!!!!!!!!!!!!!!!!!!!!!!!!!!!! 53 See Table 5.0 &%!Barnett, Stephen, Megan Carolan, James Squires, and Kirsty Brown. 35.!
  • 29.
    ! #*! implemented in2009. The ensuing increases in Table 6.0 represent consolidated funding from the General Child Care program as well as stimulus money from the American Recovery and Reinvestment Act.55 The decrease of over $1,000 in spending per child enrolled in preschool from 2010 to 2012 reflects steep budget cuts as a result of the Great Recession.56 State preschool spending has since recovered to pre-recession spending levels and has actually increased thanks to grants from the Race to the Top Early Learning Challenge (RTELC) and the creation of Transitional Kindergarten.57 California now ranks seventeenth out of fifty states in the NIEER’s annual state spending and resource rankings.58 59 Table 6.0 displays California state spending from 2002 to 2013. Data is taken from the NIEER’s most recent preschool yearbook, which provides an overview and analysis of preschool policy and its effectiveness. The data shows a spike in state spending between 2009 and 2010. Although this indicates a dramatic increase in per student spending for preschool, the spike is in fact a result of program consolidation resulting from the 2008 California State Preschool Program Act. Gaps in the Mixed Market In spite of the variety of center-based preschool programs, the mixed market for preschool in its current state is far from promoting equal opportunity for all children in California. A gap in access to quality preschool persists, disproportionately impacting low- income families. According to the California Budget and Policy Center, nearly two-thirds of !!!!!!!!!!!!!!!!!!!!!!!!!!!!!!!!!!!!!!!!!!!!!!!!!!!!!!!! 55 Ibid. 36. 56 Resmovits, Joy. "Preschool Funding Reached 'State Of Emergency' In 2012: NIEER Report."Huffington Post, April 29, 2013. 57 Barnett, Stephen, Megan Carolan, James Squires, and Kirsty Brown. 35. 58 Ibid.! 59 Ibid.
  • 30.
    ! $+! low-income threeand four year olds are not enrolled in center-based preschool programs.60 This compares to fifty-six percent of higher-income three and four year olds who are enrolled in preschool. Even children from families earning close to the state median income have lower preschool participation rates than their higher-income peers.61 These statistics highlight a critical trend in preschool participation rates: class matters, and a family’s income is a strong predictor of a child’s enrollment in quality preschool programs. The state of California has tried to address this gap in the preschool market through various programs. While federal programs such as Head Start have offered preschool services for families living below the poverty line since the 1960s, California has taken more recent steps to help increase access to preschool for middle and low-income families. For instance, the CSPP serves more than 200,000 three and four year olds from families earning less than seventy percent of the state median income.62 The state’s transitional kindergarten program, which will be discussed in further detail, offers older four year olds services regardless of family income. In spite of these efforts, income remains a dominant factor in shaping who has access to quality preschool. It is especially critical for the state to increase access to preschool for low-income children given they are most at-risk for falling behind in school.63 Without further state action to increase access to quality preschool for both low and middle income families, the positive feedback loop continues – gaps in school readiness persist, and these children start primary education already behind their wealthier classmates. !!!!!!!!!!!!!!!!!!!!!!!!!!!!!!!!!!!!!!!!!!!!!!!!!!!!!!!! 60 Schumacher, Kristin. "Reinvesting in California’s Children: Preschool for All?" California Budget and Policy Center. May 7, 2014. Note: preschool participation rates cited from the California Budget and Policy Center vary slightly compared to previously listed statistics sourced from the Rand report, which claimed fifty-nine percent of three and four year olds are enrolled in center-based preschool programs. The variation in data may result from research methodology and their respective sample populations. Moreover, the percentages cited here refer specifically to participation rates based on income groups whereas the Rand study does not disclose the economic backgrounds of families included in its sample. In spite of the variations in overall participation, both data sets suggest that a slight majority of California’s three and four year olds are enrolled in center-based programs. 61 Ibid. 62 Ibid. 63 Ibid.
  • 31.
    ! $"! Transitional Kindergarten Untilrecently, the mixed market for early education in California neglected older four year olds, whose kindergarten readiness varied significantly based on date of birth. Before 2010, four year olds born in the fall on or before December 2nd were eligible to attend public kindergartens.64 While the date of birth requirements for kindergarten seem relatively harmless, the policies in place before 2010 had a huge impact on the kindergarten readiness of many of the state’s four year olds. More so than almost any other state, California children started kindergarten at a younger age, which in turn affected children’s social, emotional, and cognitive abilities in the classroom.65 The academic struggles and general lack of readiness on the part of these four year olds presented a serious gap in the market for early education, one that required a fix in the state’s early education policy. In 2010, the state of California passed the Kindergarten Readiness Act, which pushed the kindergarten entry date back from December to September. As a result, this policy ensures that children enter kindergarten at age five.66 Most importantly, the law created Transitional Kindergarten, a “developmentally appropriate curriculum aligned with kindergarten standards and taught by credentialed teachers.”67 The cutoff date for kindergarten was phased in over a period of three years and is now fully implemented. In 2014, transitional kindergarten served 134,000 four year olds, helping to close the previous gap in kindergarten readiness that persisted for older four year olds. Transitional kindergarten so far appears to pose a win-win situation for children and schools, who both stand to gain from increased kindergarten readiness. Transitional kindergarten is also indicative of the state’s ability to correct failures in the mixed market for early education that stem from state education policy as well as private preschool and !!!!!!!!!!!!!!!!!!!!!!!!!!!!!!!!!!!!!!!!!!!!!!!!!!!!!!!! 64 "TK California." TK California: A Project of Early Edge California. 2015. http://www.tkcalifornia.org/. 65 Ibid. 66 Ibid. 67 Ibid.!
  • 32.
    ! $#! kindergarten supply.The Kindergarten Readiness Act and its creation of transitional kindergarten highlight a key addition to the preschool market in California, one that fills a previous gap in state policy and renews the state’s commitment to its early learners. 68 Figure 1.0. This figure created by TK California provides visual aid to California’s transitional kindergarten program. The program has already served thousands of four year olds and helped close a previous gap in state preschool policy. Mixed Market Recap There are several key takeaways from this overview of the market for preschool in California. The data on center-based programs confirms that the market for preschool is indeed a mixed system of mixed quality. While there is no majority program type, publicly funded programs represent the largest percentage of center-based programs followed by private and independent preschools. It is also evident that the majority of preschool-age children in California attend center-based programs. Upward trends in center-based participation rates indicate the growing demand for preschool education outside of the home and in general. !!!!!!!!!!!!!!!!!!!!!!!!!!!!!!!!!!!!!!!!!!!!!!!!!!!!!!!! 68 !TK California." TK California: A Project of Early Edge California. 2015. http://www.tkcalifornia.org/.!
  • 33.
    ! $$! Increasing participationin preschool still does not ensure quality, which can vary greatly from program to program.69 The distribution of preschool participation rates does not entirely explain who has access to different programs, but it does highlight discrepancies between high and low-income families. Even though children from low-income families stand to gain the most from quality preschool education, they have much lower enrollment rates than their higher-income peers. On top of this, the preschool programs that low-income children are enrolled in tend to be of lower quality than that of children from upper income families. This poses a serious challenge for local and state education agencies, who must find a policy solution to increase access to quality preschool for those families most in need. State funding plays a critical role in the mixed market for preschool. California’s support for early education is slightly above average in relation to the rest of the United States, leaving plenty of room for improvement. Although sixty percent of center-based programs charge a fee or tuition, the vast majority of centers accept some form of public subsidy. These numbers do not offer in depth insight into the accessibility of preschool in California, but they do reaffirm the importance of public funding and its potential to transform access. This section has identified California’s preschool system as a mixed market of mixed quality. Although a variety of programs exist and a slight majority of the state’s three and four year olds are now enrolled in preschool, access to quality preschool, especially for low-income families, remains an issue. As long as this gap in the market goes unaddressed, many of California’s children will forego the benefits of preschool education and begin their schooling well behind their peers from higher income families. There are local preschool initiatives that have sought to address these gaps persisting in the market and state policy. San Francisco’s !!!!!!!!!!!!!!!!!!!!!!!!!!!!!!!!!!!!!!!!!!!!!!!!!!!!!!!! 69 Karoly, Lynn. "Preschool Adequacy and Efficiency in California." RAND Corporation, 2009. 38.
  • 34.
    ! $%! Preschool ForAll program is one example of a local policy initiative that has focused on increasing access for all four year olds in the city and children from low-income families in particular. As a universal preschool policy, San Francisco’s PFA program provides the state with one policy model for improving access to preschool. The program also shows that preschool policy can increase access for all children without jeopardizing quality as well as focus on specific groups most in need of quality early education services. III. San Francisco’s Preschool For All Initiative Preschool policy discussions have taken on many faces, and the issue’s framing has contributed to an array of policy proposals throughout California. There are several ways of measuring the effectiveness of early education policies, and the arguments both for and against expansion of state-supported early education offer a diverse set of approaches for analyzing policy. Preschool policy can be measured by its long-term investment in children, accessibility to low-income families, or program quality. Certainly, some of these aspects cannot be neglected – an analysis of any education policy would be remiss if it did not address access and quality in some shape or form. Because access and quality can be very ambiguous terms in and of themselves, it is critical to clearly define how they will be used in this context. This section first provides an introduction to San Francisco’s Preschool For All (PFA) program. It then analyzes the program’s impact with specific regard to access and quality before offering recommendations for the policy. Access to early education has increased significantly in the past decade, and there are a number of proposed local and state initiatives that champion preschool expansion. The previous overview of the mixed market for preschool in California highlighted some of the gaps in access
  • 35.
    ! $&! to qualitypreschool. Amidst calls for a decentralized system of preschool, increased privatization, and universal state-run preschool, there is no consensus on which policies will provide the highest level of access to quality preschool for all Californians. Policy-makers are left to grapple with how to increase access efficiently and effectively and in a manner that does not jeopardize quality. The city of San Francisco’s PFA program offers one policy model for increasing access, especially for low-income families, while enhancing quality. By exploring in depth the PFA program, this paper identifies San Francisco PFA as one potential policy model for other counties and the state as it tries to close gaps in access to quality preschool. Taking into account quality, effectiveness, limitations, and areas for improvement, this analysis ultimately suggests that universal preschool policies can increase access for all children while focusing particularly on children most in need; this in turn fills a persisting gap in the market for preschool and levels the playing field for all children as they begin their primary education. Historical Overview The story of the Preschool For All program begins in 2004 when San Francisco voters passed Proposition H. Also referred to as the Great Schools Charter Amendment, Proposition H appropriated money from the city’s General Fund, which is explicitly used for public services such as public health and education.70 The proposition increased annual funding for preschool and K-12 public school enrichment programs by sixty million dollars.71 More specifically, the funds were distributed three ways: one third for San Francisco First 5 and preschool support, one third for sports, libraries, arts, and music programs, and the last third for wellness centers, !!!!!!!!!!!!!!!!!!!!!!!!!!!!!!!!!!!!!!!!!!!!!!!!!!!!!!!! 70 “Proposition H-Public Education Fund.” SPUR. March 1, 2004. http://www.spur.org/publications/voter-guide/2004-03-01/proposition-h- public-education-fund 71 Ibid.!
  • 36.
    ! $'! student supportprofessionals, translation services, and peer resources.72 The proposition gained significant voter support and political traction as a result of underperforming schools, relatively low per pupil spending, and declining enrollment in San Francisco Unified School District (SFUSD) schools stemming from a number of factors, including but not limited to dramatic increases in the cost of living and gentrification. Although San Francisco’s high cost and standard of living would seem to indicate substantial per pupil spending in the city’s public schools, San Francisco, at the time, ranked thirty-fourth among forty-three city public school districts of comparable size.73 The proposition’s passage in many ways represents San Francisco’s renewed commitment to public education and growing interest in a quality ECE system. The third of Proposition H’s Public Education Enrichment Fund was designated to San Francisco First 5 and its support for preschools, which ultimately led to the creation of a new universal preschool program. San Francisco First 5’s new program, titled Preschool For All, was created under a clear and concise mission: to provide quality preschool and family services to San Francisco’s families regardless of income or socioeconomic background. Since its inception, the program has sought to uphold its mission of promoting accessible and affordable preschool to all four year olds in the city. It also aims to serve San Francisco’s most under-resourced families, namely low-income and minority families.74 The program offers additional services for families beyond preschool education. PFA and First 5 San Francisco have taken additional measures to provide resources and education to families throughout San Francisco. The program’s Family Resource Center Initiative, which began in 2009, offers families intensive support services and opportunities for community !!!!!!!!!!!!!!!!!!!!!!!!!!!!!!!!!!!!!!!!!!!!!!!!!!!!!!!! 72 “Public Education Enrichment Fund.” San Francisco Unified School District. 2015. http://www.sfusd.edu/en/about-sfusd/voter- initiatives/public-education-enrichment-fund.html 73 “Proposition H-Public Education Fund,” 2004. 74 “SF Family Resource Initiative Evaluation.” First 5 San Francisco. 2013. http://www.first5sf.org/programs/preschool-all.!
  • 37.
    ! $(! development. Thisinitiative within PFA focuses especially on building parents’ knowledge and skills as a means of strengthening families and ensuring healthy childhoods.75 In accordance with high quality early education, the Family Resource Initiative has undoubtedly helped to improve family relationships, which is a key factor for children’s emotional and social development. The initiative has served over 13,000 parents and children to date, the majority of whom are Latino. According to a report by the San Francisco Department of Children and Human Services Agency, more frequent visits to the center are associated with improvements in emotional well- being and reductions in the risk of abuse.76 By offering workshops ranging from parenting education to parent/child interaction groups, the initiative has had a clear impact on the thousands of parents and children it has served since 2009. PFA and partner initiatives like the Family Resource Center have made a tangible and lasting impact on families in San Francisco. Around the time of Proposition H’s passing and implementation, a study conducted by the Rand Corporation reported that less than fifteen percent of children in California attend high quality preschool.77 More than eighty percent of children in San Francisco now attend preschool, beating both the state and national participation rates. The program has made significant strides in promoting access to economically disadvantaged families. Prior to PFA, access to public preschool for free or reduced cost was limited to families earning less than $35,000. In the absence of an income eligibility limit, PFA has expanded access to quality preschool for all families in the city. According to Melissa Daar, a San Francisco parent, “Preschool For All is helping us stay in the city.”78 For Daar and many families throughout San Francisco, paying tuition upwards of $12,000 for quality preschool is !!!!!!!!!!!!!!!!!!!!!!!!!!!!!!!!!!!!!!!!!!!!!!!!!!!!!!!! 75 “San Francisco Family Resource Center Initiative, Year 2 Evaluation.” First 5 San Francisco. July 2012. http://www.first5sf.org/sites/default/files/page-files/11_frc_es.pdf. 76 Ibid. 77 Graff, Amy. “SF’s PFA Adds 10 New Sites.” SF Gate. June 4, 2009. http://blog.sfgate.com/sfmoms/2009/06/04/s-f-s-preschool-for-all-adds- 10-new-sites/.! 78 Ibid.
  • 38.
    ! $)! simply notpossible. By subsidizing the cost and imposing quality standards, San Francisco has taken progressive measures to facilitate positive change in its preschool education system. With PFA’s ten year authorization under Proposition H now coming to a close, it is an especially critical time for an impact analysis of the program to better understand its strengths and weaknesses as well as its ability to fulfill the program’s stated mission. This includes an examination and analysis of the program’s effectiveness as determined through its ability to promote access and quality. This paper addresses a central question surrounding preschool expansion in San Francisco: is PFA increasing access to quality preschool for all children in San Francisco, especially for children most in need? Funding Since the implementation of Proposition H in 2005, PFA has seen significant growth in preschool enrollment rates amongst its partner sites as well as its allocation of funding from the city. Before discussing trends in participation and the terms of partnering with PFA, it is necessary to explain how PFA funds its services. From 2005 to 2015, the amount of funding for PFA increased nearly tenfold. However, the funding for PFA has not been consistent, and both a sustainable and predictable financial model remains to be seen. In 2005, the program received $3.3 million, a budget that ultimately supported the education of 561 four year olds in San Francisco.79 According to one study conducted by San Francisco’s Department of Children, Youth, and Their Families, the average cost per child of providing preschool in San Francisco falls around $8,800, with higher cost estimates associated !!!!!!!!!!!!!!!!!!!!!!!!!!!!!!!!!!!!!!!!!!!!!!!!!!!!!!!! 79 Note: data was prepared by First 5 SF in 2013 and forwarded by PFA Data Analyst, Xavier Morales.
  • 39.
    ! $*! with higherquality preschool programs.80 These numbers include administrative and staffing costs, which make up between seventy and eighty percent of center-based programs’ budgets, as well as quality enhancement measures and tuition subsidies or credits.81 At the time of the program’s implementation in 2005 and the ensuing two years, the program expanded rapidly, and its annual allocation of funds fell in line with the amounts stated under Proposition H. Nonetheless, San Francisco, like most cities and states throughout the United States, experienced budget shortfalls with the onset of the Great Recession in 2007-2008. SFUSD faced upwards of $40 million in cuts, representing ten percent of its total annual budget.82 As a result, 2008 marked the first year of the Preschool For All initiative in which program expenditures exceeded revenue. Although PFA enrollment continued to increase during this time, its improvements in access to preschool staggered. As portrayed in Figure 2.0, the discrepancy between actual and statutory Proposition H funds for PFA peaked in 2010, with the program receiving only $14.7 million of the original $20 million set aside by the Public Education Enrichment Fund.83 From this, PFA was forced to look elsewhere for funding and attain greater efficiency with the funds they received from the city. !!!!!!!!!!!!!!!!!!!!!!!!!!!!!!!!!!!!!!!!!!!!!!!!!!!!!!!! 80 Lucich, Mardi, and Kelly Lynch. “Cost Models of Three Types of Early Care and Education in San Francisco: What is the True Cost of High Quality Care?” SF Department of Youth and Their Families. 2009. 3. 81 Ibid. 82 Tucker, Jill. “School Board Votes to Save Prop. H Cash for Shortfall.” SF Gate. January 23, 2008. 83 Note: data was prepared by First 5 SF in 2013 and forwarded by PFA Data Analyst, Xavier Morales.!
  • 40.
    ! %+! 84 Figure 2.0.In 2005, the passage of Proposition H promised PFA increased funding as the program expanded. However, the 2007-2008 financial recession forced the City of San Francisco to cut much of its education budget, resulting in the above discrepancy between actual and promised funding for the Preschool For All program. Because of the variations in city funding, PFA has had to seek additional funding strategies and partnerships. Beginning in 2012, PFA started using its reserve funding for excess expenditures stemming from budget shortfalls. In this coming year, the program is expected to deplete the remainder of its reserve funds, meaning that over $5 million of reserve funding will be used to cover excess expenditures.85 Although the program has received grants from numerous state and federal entities, such as First 5 California and the Department of Education, the program’s financial model is not self-sufficient or sustainable. Funding for the program seemed especially uncertain moving forward given the expiration of Proposition H this year, which in turn concludes PFA’s ten-year funding authorization. !!!!!!!!!!!!!!!!!!!!!!!!!!!!!!!!!!!!!!!!!!!!!!!!!!!!!!!! 84 Ibid. 85 “Proposition H Funding.” First 5 San Francisco. http://www.first5sf.org/press/proph.
  • 41.
    ! %"! Nevertheless, membersof PFA remain optimistic about the program’s future. While excess reserve spending and budget shortfalls have limited PFA enrollment growth and put forth an unsustainable financial model in previous years, increasing access to early education and, more specifically, the initiative for universal preschool are incredibly salient and politically feasible issue areas in the city of San Francisco. Proposition H and its concurrent Public Education Enrichment Fund are set to expire this coming June, but the voters of San Francisco have already passed Proposition C, which extends the city’s Children’s Fund as well as Public Education Enrichment Fund.86 Proposition C offers PFA more consistent funding by eliminating a previous provision that allowed the city to withdraw PFA funding during any year it suffered budget shortfalls of $100 million or more.87 With nearly three quarters of the vote, the passage of Proposition C is indicative of citywide support for universal preschool and continued expansion of early education and family services in San Francisco. Drawing on the city’s overwhelming support for universal preschool, San Francisco’s politicians have also taken on the issue in hopes of further expanding access. In January of 2015, San Francisco Mayor Ed Lee proposed expanding access to preschool for an additional 860 children.88 Noting access to early education as one of the primary concerns for families living in San Francisco, the Mayor is attempting to expand the program at a time when the city is experiencing tremendous economic growth from the tech boom. Although the proposed expansion would add another $5 to 10 million to the PFA budget, it would, at least for the time being, reduce or eliminate the current 500-child waitlist for the PFA program.89 Since 2013, PFA has received the original amount of funding guaranteed under Proposition H, but the current budget is still not enough to promote expansion such that the supply of quality preschool in San !!!!!!!!!!!!!!!!!!!!!!!!!!!!!!!!!!!!!!!!!!!!!!!!!!!!!!!! 86 “City of San Francisco Children and Families First City Funds, Tax and Administration Proposal, Proposition C.” Ballotpedia. 2014. 87 Ibid. 88 Cote, John. “S.F. Mayor Ed Lee Promises Funds for Preschool, Muni.” SF Gate. January 14, 2015. ! 89 Ibid.
  • 42.
    ! %#! Francisco isable to meet the demand. These long waitlists suggest that, with the ten-year authorization of PFA funding through Proposition H coming to a close, the program has not yet reached its goal of providing universal preschool. While budget issues have limited PFA’s impact and growth in previous years, overwhelming political support of universal preschool as an issue will allow PFA to continue its mission of increasing access to quality preschool education. Whether the Mayor’s early education proposals are simply rhetoric and political maneuvers or genuine action remains to be seen, but they certainly present an optimistic outlook for PFA and the state of universal preschool in San Francisco. In the current fiscal year, PFA is set to receive about $27 million in city funds.90 Where and how this money is distributed requires further examination. Understanding PFA’s budget offers one policy perspective on the program’s efficiency in terms of costs and benefits, but it also provides greater insight into the viability of replicating the successes of this program elsewhere in California. With that said, PFA partner sites are delineated into two primary categories: subsidized or unsubsidized. Subsidized schools, which make up roughly sixty-five percent of the 150 PFA partner sites, include schools that receive either state or federal education subsidies. More than sixty percent of subsidized preschools partnering with PFA receive state subsidies from California’s Department of Education, while the remainder of subsidized preschools in San Francisco receives funding from either Head Start or Title I. In fact, PFA partners with every Head Start school in SFUSD. Head Start, a federal program established in 1965, is designed to serve children between the ages of three and five and was founded on the basis of promoting equal opportunity for families of all socioeconomic backgrounds. The program specifically targets children at high risk for academic failure in low- income communities, and the majority of families served by Head Start centers either fall below !!!!!!!!!!!!!!!!!!!!!!!!!!!!!!!!!!!!!!!!!!!!!!!!!!!!!!!! 90 Ibid.!
  • 43.
    ! %$! the federalpoverty line or qualify for social services according to state and federal income guidelines.91 Even though Head Start is a federally run and sponsored program, sixty-four percent of Head Start agencies in California also contract with the State Department of Education and city programs like the Preschool For All initiative.92 These schools require further resources and funding from PFA and First 5 San Francisco to enhance their efforts to alleviate poverty and promote quality preschool education for under-resourced families. In addition, Title I schools, which receive federal funds and grants as per the Elementary and Secondary Education Act, make up a much smaller percentage of PFA partner sites. Much like the Head Start programs, the handful of Title I schools that partner with PFA have especially high percentages of students from low-income families.93 In spite of receiving funding from various federal and state entities, these subsidized schools still require a great deal of additional funding for quality improvement, teacher development and assistance as well as financial assistance for individual students. Because Title I and Head Start schools specifically target low- income families and families living below the poverty line, funding is critical for subsidizing the cost to families and improving quality, which tends to be lower than that of private preschools in San Francisco. Unsubsidized schools, which make up the other forty percent of PFA partner schools, are in large part tuition-based, meaning students enroll on a fee-for-service basis. Like subsidized schools, these early education centers may also offer scholarships or sliding-scale tuition. While unsubsidized schools are more likely to be private preschools and provide access to fewer low- income families, they still offer a number of opportunities for reduced tuition. Since PFA’s mission focuses particularly on low-income families, unsubsidized schools on the whole receive !!!!!!!!!!!!!!!!!!!!!!!!!!!!!!!!!!!!!!!!!!!!!!!!!!!!!!!! 91 “About Head Start.” California Head Start Association. 2015. caheadstart.org. 92 Ibid. 93 “Improving Basic Programs Operated by Local Educational Agencies.” US Department of Education. June 4, 2014. !
  • 44.
    ! %%! less fundingthan subsidized schools from PFA. These schools still need funds to ensure quality, promote enrollment, and streamline various program requirements that PFA mandates for its partner sites. The amount of funding both subsidized and unsubsidized schools can receive is also limited by enrollment type. Within this, preschools can either provide a full, part, or school day of learning. At the least, schools provide part day learning, which entails four or fewer daily hours; school days are defined by four to seven hours of daily education, and full day preschools provide seven plus daily hours of learning.94 Eighty-five percent of participating PFA schools offer full day services, a figure that is critical in enhancing PFA’s potential impact. Numerous studies highlight the benefits of additional hours of preschool education. Most notably, the NIEER conducted a randomized study of eighty-five four-year olds in a low-income urban school district, in which twenty percent of participating families were living below the poverty line.95 The study suggests that “even students who are far behind at entry to preschool can develop vocabulary, math, and literacy skills that approach national norms if provided with extended-duration preschool that maintains reasonable quality standards.”96 Thus, high participation rates among full day preschool services is significant to PFA’s mission of increasing school readiness of its students, particularly those from low-income backgrounds. More hours of quality preschool education result in substantial gains for participating children. In turn, it is necessary to analyze PFA’s standards of quality and accessibility in order to more accurately gage the program’s effectiveness. Defining and Measuring Effectiveness !!!!!!!!!!!!!!!!!!!!!!!!!!!!!!!!!!!!!!!!!!!!!!!!!!!!!!!! 94 “2013/2014 PFA Preschools.” First 5 San Francisco. 2013. http://www.first5sf.org/sites/default/files/page-files/Directory_PFA_CURRENT.pdf 95 Barnett, Stephen, Ellen Frede, and Kenneth Robin. “Is More Better? The Effects of Full-Day vs. Half-Day Preschool on Early School Achievement.” 2006. http://nieer.org/resources/research/IsMoreBetter.pdf. 96 Ibid.
  • 45.
    ! %&! So far,this analysis has only looked into PFA’s historical background and funding schemes. It is also important to better understand and analyze the program’s effectiveness, a ubiquitously controversial criteria for any education policy analysis. First 5 SF and the PFA program have very specific criteria for measuring success and effectiveness. The initiative’s primary objectives are to make high quality preschool accessible, available, and affordable for all and to ensure that children are socially, emotionally and academically prepared for success in the classroom.97 PFA’s site evaluations specifically focus on school readiness by measuring early math and reading skills as well as self-regulation, which measures children’s attention skills and social development. PFA’s most recent evaluations from 2012 suggest that children attending PFA partner preschools achieve significant gains in early literacy, early math and self-regulation skills, placing them well above the national average for these categories. The gains in early literacy, measured by letter word recognition tests, can be equated into a three-month advantage for PFA children.98 In addition, students at PFA sites achieved increases in applied problem scores for mathematics, resulting in a three to four month advantage in school readiness.99 The program had the biggest impact on self-regulation skills. Using the Head-Toes-Shoulder-Knees Test, which tests participants’ ability to concurrently inhibit impulses while still executing intention, students made further progress in school readiness.100 From this, children enrolled in PFA partner sites experience significant progress in school readiness and exhibit learning skills above that of non- PFA and national averages. !!!!!!!!!!!!!!!!!!!!!!!!!!!!!!!!!!!!!!!!!!!!!!!!!!!!!!!! 97 "Evaluating Preschool For All Effectiveness." First 5 SF. August 1, 2013. 98 Ibid. Note: letter word recognition tests measure language development and early literacy. The test is endorsed by the National Education Goals Panel, which selects tests on the basis of predicting subsequent academic success. The test itself is a series of test plates; students are then asked to identify letters, words, and distinguishing letters from images on those plates. This pre-reading and word decoding test can be taken in both English and Spanish. 99 Ibid.! 100 Ibid. Note: the Head-Toes-Shoulder-Knees Test is a five minute test that measures a child’s ability to self-regulate. The test asks children to perform the opposite of a response to various commands. For instance, if a child is instructed to touch his toes, his/her correct response entails touching his/her head. PFA administers this test in English, Spanish, and Chinese.
  • 46.
    ! %'! An evaluationof PFA’s effectiveness would be remiss if it did not address the program’s ability to uphold a key part of its mission, namely to ensure accessible and affordable preschool for all four year olds in San Francisco but particularly four year olds from low-income families. First 5 agencies throughout California focus a great deal on providing their services to low- income families. Within this, PFA’s work is especially geared toward under-resourced communities in the city. As displayed by Table 7.0, the differences between PFA and non-PFA preschools offer one metric for measuring the impact of PFA programs and provide context for a comparative analysis of which students PFA actually reaches. The socioeconomic and racial demographics of PFA participants very much reflect the program’s special emphasis on promoting preschool access to low-income and under-resourced communities. For instance, seventy percent of children at PFA partner sites come from families earning annual salaries of less than $35,000 versus just thirty-five percent of non-PFA children.101 The income discrepancy between PFA and non-PFA children in San Francisco is most pronounced in the $15,000-35,000 income range, in which forty-three percent of PFA children fall compared to just fifteen percent of non-PFA children.102 It is also important to note that nine percent of PFA families earn over 100,000 dollars per year; although this number falls well below the twenty-eight percent of non-PFA schools, it is still a point of criticism for the program that will be discussed in further detail. From these statistics, it is evident that PFA serves a disproportionately low-income population. !!!!!!!!!!!!!!!!!!!!!!!!!!!!!!!!!!!!!!!!!!!!!!!!!!!!!!!! 101 Note: data was prepared by First 5 SF in 2013 and forwarded by PFA Data Analyst, Xavier Morales. 102 Ibid.!
  • 47.
    ! %(! 103 Table 7.0.This graph details the San Francisco PFA income of entering San Francisco Unified School District kindergarten children by PFA participation (as compared to those who did not receive preschool education from FPA partner sites). The discrepancies between PFA and non- PFA children are most pronounced at the low and high ends of the income spectrum, suggesting that, on the whole, PFA children tend to come from more low-income backgrounds compared to non-PFA children, who come from more high-income backgrounds. Further analysis of PFA participation demographics shows that increases in preschool participation rates over the years are most pronounced for socioeconomically disadvantaged families. Nearly eighty percent of Black four year olds are now enrolled in preschool, up ten percent since 2007. Four-year-old Latinos have seen the biggest spike in participation with twenty-five percent improvement in enrollment rates and eighty percent now enrolled.104 These increases provide strong evidence that PFA has made preschool more accessible, particularly amongst families who are in the greatest need of these services. In addition to high preschool participation rates for low-income minority families, PFA has also impacted households with limited parental education: the majority of PFA parents have no higher than a high school !!!!!!!!!!!!!!!!!!!!!!!!!!!!!!!!!!!!!!!!!!!!!!!!!!!!!!!! 103 Ibid. 104 Note: data was prepared by First 5 SF in 2013 and forwarded by PFA Data Analyst, Xavier Morales.
  • 48.
    ! %)! degree.105 These statisticssuggest that PFA as a program has made significant gains in preschool participation rates for the city’s most socioeconomically disadvantaged families and helped to level the playing field for these children as they move on to kindergarten and primary school. First 5 SF and the PFA program have a set criteria for measuring effectiveness that includes rating systems, quality assessments, site evaluations, and tests. These measurements provide data and critical insight into some of the strengths and weaknesses of the program that policy-makers and program administrators can in turn use to improve policy moving forward. It is clear that student performance on administered tests and enrollment data play an important role in PFA’s own assessment of program effectiveness. For the purposes of this study, measuring the program’s effectiveness extends beyond these instruments and criteria to focus particularly on PFA’s ability to uphold its mission of increasing access to quality preschool for all children in San Francisco. In further defining PFA’s effectiveness through access and quality, this research offers deeper analysis of the quality of PFA preschools and who actually has access to these programs. In doing so, quality must be more clearly defined. Access to Quality Preschool: What is quality preschool and who has access to it? PFA as an organization champions its impact on increasing access to quality preschool in San Francisco. The program has expanded over the past ten years, culminating in its current partnerships with over 150 schools. The quality of PFA partner sites has continued to increase during this time, especially as compared to the quality of non-PFA schools in San Francisco. There is still a spectrum of quality within PFA preschools, and the question remains as to who receives what kind of quality preschool education. Because the program places special emphasis on improving the livelihoods and opportunities for low-income families, it is of particular !!!!!!!!!!!!!!!!!!!!!!!!!!!!!!!!!!!!!!!!!!!!!!!!!!!!!!!! 105 Ibid.!
  • 49.
    ! %*! importance tomore closely examine the relationship between the spectrum of quality preschool education and the different socioeconomic and racial groups in the city. This section addresses the issue of whether or not PFA is enabling affluent families to send their children to well to-do schools and low-income families to send their children to still underperforming or lower quality preschools. The evidence ultimately suggests that PFA has increased overall access to preschool for four year olds in the city, especially for children from low-income families, and income is not a determining factor in families’ ability to access quality programs. In order to better understand the relationship between quality and access, it is necessary to clearly define what quality is and how it is measured. Defining quality preschool education is a much more difficult task than it may seem on the surface. State and local education agencies are often caught between choosing older or current quality assessments versus developing new, more comprehensive and locally based ones. All measures of quality preschool education to some extent incorporate common elements or criteria. These elements include teacher qualifications, class size, and assessments of the program’s learning environment among other criteria. In an interview with Scott Moore, the former executive director of the California Early Learning Advisory Council and current Chief Policy Advisor at Early Edge California, he discussed the framework for effective quality assessments. While the previously mentioned elements are no doubt important in assessing the quality of preschool programs, they should really only serve as the foundation for better understanding and assessing quality. According to Moore, the quality of instruction should be the most important aspect of any quality assessment.106 All learning, but especially early learning, must involve instructional scaffolding, or the ability for teachers to adjust their teaching styles and learning environments to best !!!!!!!!!!!!!!!!!!!!!!!!!!!!!!!!!!!!!!!!!!!!!!!!!!!!!!!! 106 !The information and opinions referenced were noted during an in-person interview with Scott Moore on April 10th , 2015.!
  • 50.
    ! &+! accommodate eachstudent’s needs. Effective quality assessments find a way to address teachers’ abilities to reach each and every one of their students. The ultimate purpose of preschool programs and the quality metrics used to assess them is straightforward: coming out of preschool, children should be better prepared for school and achieve better results in future learning environments. Effective quality assessments should account for these elements and provide insight not only into the current state of preschool, but also ways of improving education policy moving forward. Going off of Moore’s definition of effective quality assessments, it is evident that PFA’s system of quality assessment is adequate given its emphasis on teacher quality and ultimate goal of improving the program. PFA determines the quality of its partner preschool sites based on a statewide Quality Rating and Improvement System (QRIS). Within the past few years, California has sought to create a more uniform, locally based rating system. In 2012, the state of California received over $50 million from the U.S. Department of Education as part of the Race to the Top- Early Learning Challenge Grant Award; seventy-seven percent of these funds is spent at the local level to support organizations, such as San Francisco First 5 and the PFA program, in developing and implementing a QRIS.107 Upon receiving grant funding from the U.S. Department of Education, a voluntary network of local early education agencies formed a consortium to align their local QRIS to a common framework based on various research-based elements and improvement measures.108 First 5 San Francisco is part of this consortium, and the PFA program uses the established QRIS in its assessment of its preschool partner sites in the hopes of ensuring that children have access to high quality programs. !!!!!!!!!!!!!!!!!!!!!!!!!!!!!!!!!!!!!!!!!!!!!!!!!!!!!!!! 107 "RTT-ELC Implementation." California Department of Education. January 9, 2015. http://www.cde.ca.gov/sp/cd/rt/rttelcapproach.asp. 108 Ibid.
  • 51.
    ! &"! The QRISused by PFA and various other early education agencies throughout California is based on three core elements: child development and school readiness, teachers and teaching, and the program and environment quality.109 Each core category’s scoring is based on specific criteria. For instance, scores for the child development and school readiness core are based on the programs’ compliance with the state of California’s Desired Results Developmental Profile (DRDP) as well as the programs’ ability to work with families in screening all children using the Ages and Stages Questionnaire (ASQ).110 The teachers and teaching core is predominately based on teacher qualifications, with higher scores related to higher degree levels on the part of lead teachers. In addition, seventy-five percent of lead teaching staff must meet the education degree requirements as specified by the state of California.111 Effective teacher-child interactions, as determined by classroom assessments, are also taken into account in the scoring of this core. Last, the program and environment core is scored according to student/teacher ratios and group size, Environment Rating Scale (ERS), and the education qualifications of the centers’ directors.112 More specifically, the ERS is a scale designed to assess process quality in ECE that takes health and safety, the building of positive relationships, and opportunities for stimulation and learning into account.113 The fully detailed QRIS matrix can be found in the appendix for more precise details. By summing the scores from the three core categories, each school receives a total score between zero and thirty-five. Depending on its score, a partner PFA site is placed between tiers 1 !!!!!!!!!!!!!!!!!!!!!!!!!!!!!!!!!!!!!!!!!!!!!!!!!!!!!!!! 109 See Appendix for full Quality Rating Matrix 110 The Desired Results Developmental Profile is an observation based early childhood assessment that is meant to provide documentation of children’s behavior in natural environments. The assessment is broken down into eight domains, with each based on its own focus. These domains include Approaches to Learning-Self-Regulation, Social and Emotional Development, Language and Literacy Development, English- Language Development, Cognition, Physical Development-Health, History-Social Science, and Visual and Performing Arts. Because the assessment is developed by California’s Department of Education and is modified annually, it is important to view the most up-to-date profile, which can be located at http://www.cde.ca.gov/sp/cd/ci/documents/drdp2015preschool.pdf. Moreover, the Ages and Stages Questionnaire is a questionnaire designed to help schools and families check children’s development. The questionnaire focuses specifically on developmental and social-emotional screening for children between birth and age 6. This assessment is created independently of state and federal government and can be accessed via agesandstages.com. 111 See Appendix for full Quality Rating Matrix. 112 Ibid. 113 "Environment Rating Scales." Frank Porter Graham Child Development Institute. 2015. http://ers.fpg.unc.edu/.
  • 52.
    ! &#! and 5,with tier 5 representing the highest quality preschools according to the QRIS. Table 8.0 lists the QRIS ratings for 127 PFA preschools in thirty-nine neighborhoods in San Francisco. The frequency of QRIS tier levels is listed, representing the number of preschools in that particular neighborhood with the corresponding tier level. Of the 127 preschools included in the data, the average tier level is 3.46 with a median of 3. Seventy schools are Tier 3, fifty-five schools are Tier 4, and just 2 of the schools included in the data are Tier 5. Before diving deeper into the analysis of this data, it is important to note that this sample of 127 PFA preschools is not entirely comprehensive. The program currently partners with over 150 preschools, which is about half of all preschools in the city of San Francisco. 114 Table 8.0. The above information lists neighborhoods in San Francisco with participating PFA preschools. The frequency of QRIS tier levels and total number of preschools in each neighborhood is also listed. It should be cautioned that the total preschool count in this instance, 127, does not include all PFA preschools, which now totals over 150 preschools. !!!!!!!!!!!!!!!!!!!!!!!!!!!!!!!!!!!!!!!!!!!!!!!!!!!!!!!! 114 Note: data was collected by Xavier Morales, Data Analyst for SF PFA, and forwarded to me for the purposes of this project.
  • 53.
    ! &$! Nonetheless, theinformation provided in Table 8.0 does provide meaningful insight into the quality of a large proportion of PFA preschools. Going off of the QRIS matrix, the minimum tier of three and average tier score of 3.46 offers several conclusions. For instance, the PFA partner schools included in this data use valid and reliable child observation and assessment tools aligned with the California Department of Education and local First 5 agency. These schools also work with families to screen all children using valid and reliable child screening tools as developed and approved by the state. With regard to teacher qualifications, the average tier of partner PFA sites indicates that, at the minimum, preschool classroom teachers have taken twenty-four units in ECE, sixteen units of general education, and have twenty-one hours of professional development annually. This means that, on the whole, PFA teachers pass the basic qualifications required by the state and have studied from an ECE-specific curriculum. Each of the 127 schools has a group size ratio of two teachers/staff members to twenty- four students. While there is no limit to class size in California, this ratio falls in line with the typical enrollment of twenty-four children per classroom.115 In terms of program and environment ratings, these schools annually receive an ERS assessment, which is conducted independently by a Quality Improvement System rater. In addition, the average QRIS tier rating indicates that each program’s director has at least an associate’s degree with twenty-four units in ECE, six units in management and administration, and two units in supervision. This again implies that PFA preschool directors are qualified for their positions and have received specific training in ECE and school administration. !!!!!!!!!!!!!!!!!!!!!!!!!!!!!!!!!!!!!!!!!!!!!!!!!!!!!!!! 115 Barnett, Stephen, Megan Carolan, James Squires, and Kirsty Brown. "The State of Preschool 2013." National Institute for Early Education Research, 2013. 36.
  • 54.
    ! &%! The minimumcriteria met by these schools, as suggested by the minimum and average QRIS tier ratings, offers several implications when compared to the state as a whole. PFA preschool teachers are much more qualified than the typical preschool teacher in California, who is not actually required to hold a degree in ECE or complete annual professional training.116 Only one quarter of preschool teachers in California hold degrees related to ECE, a standard that PFA schools well surpass given their minimum tier rating observed in the data.117 PFA preschools’ compliance with state and local assessments, including the ERS assessment, also places them ahead of the curve in California. Median and average QRIS scores indicate that PFA preschools receive annual classroom assessments and meet the overall score level required by the state. In contrast, many CSPP schools do not require or receive site visits and other developmental support services.118 On the whole, PFA partner preschools excel compared to state preschool programs in child development and school readiness, teaching and teacher qualifications, and program environment. Still, a spectrum of quality exists within the program. The neighborhood distribution of QRIS tier levels, as previously mentioned and listed in Table 8.0, highlights that not all children in San Francisco and even within the PFA program receive the same degree of quality preschool education. This begs the question posed at the onset of this chapter: is PFA truly reaching its target audience of low-income families, or does the standard paradigm of affluent children attending high-quality schools and low-income children attending lower-quality schools persist? Answering this question requires an analysis of the neighborhoods in San Francisco that PFA serves. The data collected includes median household income of each neighborhood, the !!!!!!!!!!!!!!!!!!!!!!!!!!!!!!!!!!!!!!!!!!!!!!!!!!!!!!!! 116 "California Children's Report Card: How Kids Are Doing in Our State and What Needs to Be Done About It." Children Now. 2014. 9. 117 Ibid.! 118 Barnett, Stephen, Megan Carolan, James Squires, and Kirsty Brown. 36.
  • 55.
    ! &&! quality ofpreschools in these neighborhoods, and the PFA preschool participation rates for each neighborhood. The results from this data ultimately suggest that PFA does offer increased access to quality preschool programs for families of all income levels, but especially for low-income families, and the level of quality is not directly determined by family income. These results also support the argument that PFA is one example of an effective universal preschool program that works to reduce economic inequities in education while increasing access to quality preschool for all children in San Francisco. !!"#$%&'(")*,!-./!0123/!4050!6.276!5./!4865981:582;<!1=!125.!;:>1/9!0;4!?/9@/;50A/<!2B!/;92CC>/;5!8;!DEF!?9/6@.22C6!1=!;/8A.129.224! 8;!G0;!E90;@86@2,!-./6/!;:>1/96!09/!106/4!2;!5./!>265!9/@/;5!4050!@2CC/@582;!1=!5./!DEF!?92A90>!0;4!E8965!&!GE,!-./!501C/!706!@9/05/4! 1=!H038/9!I290C/6<!J050!F;0C=65!B29!5./!DEF!?92A90>,! !!!!!!!!!!!!!!!!!!!!!!!!!!!!!!!!!!!!!!!!!!!!!!!!!!!!!!!! 119 Data was collected by Xavier Morales, Data Analyst for SF PFA, and forwarded to me for the purposes of this project.
  • 56.
    ! &'! The breakdownin median household income by neighborhood affirms the city of San Francisco as one of the most expensive in the country. The neighborhoods served by PFA have a median household income of $83,017, well above the median household incomes for both California and the United States as a whole.120 The data on neighborhood incomes also highlights the extreme levels of income inequality in the city. In spite of this large discrepancy between high and low income neighborhoods, access to preschool through the PFA program is actually more pronounced in low-income neighborhoods. By providing greater access to quality preschool in low-income neighborhoods, the PFA program is indeed reaching its target audience of low-income families while still promoting preschool participation citywide. Tables 10.1 and 10.2 show the top five highest and lowest income neighborhoods in San Francisco, respectively, based on median household income. In addition, the tables include the number of children from those neighborhoods attending PFA preschools and its corresponding percentage. It is critical to point out that the percentage of children attending PFA partner preschools from the highest income neighborhoods is significantly lower than that of children from the poorest neighborhoods. As of December 2014, the number of children enrolled in the PFA program totaled 5,194.121 Only 8.2% of the total number of children enrolled in the PFA program comes from the richest five neighborhoods in San Francisco. In contrast, 30.2% of children enrolled in PFA come from the five poorest neighborhoods. It should come as no surprise, then, that the preschool count is much higher in low-income neighborhoods as compared to high-income neighborhoods. In referring back to the total preschool counts in Table !!!!!!!!!!!!!!!!!!!!!!!!!!!!!!!!!!!!!!!!!!!!!!!!!!!!!!!! 120 "State and County Quick Facts." United States Census Bureau. March 31, 2015. http://quickfacts.census.gov/qfd/states/06000.html. Note: The median household income of California in 2013 was $61,094 compared to $53,046 for all of the United States. 121 See Table 9.0.
  • 57.
    ! &(! 8.0, thereare ten PFA preschools in the five richest neighborhoods in San Francisco and forty- one PFA preschools in the five poorest neighborhoods. Table 10.1 !"#$%$&'()*+",*""-.$/+0$(12"3'4$ 5'-(61$7"8.'*"9-$:12"3'$/;4$ &"<$"=$>*(9-,'1$ ?$>*(9-,'1$ !"#$%&'($)*% +,-./-,% 01% +2,% &("#343'% +,5.5-6% 5,% /2-% 7)(38)9:';%<'**';% ++5.=1,% 5=% /26% >88"(%?@8#"$% +/1.0/+% 5/-% ,2A% B@C'D"9:)#$('9E'"%F)**"G% +//.//6% ++/% 52+% Table 10.2 @"A'.B$%$&'()*+",*""-.$/+0$(12"3'4$ 5'-(61$7"8.'*"9-$:12"3'$/;4$ &"<$"=$>*(9-,'1$ ?$>*(9-,'1$ :3H3D%:"8$"(9%I"84"(*'38% 5-./6+% 5,=% -20% :J38)$';8% ,5.1,1% 1+% +20% K)GH3";9%<@8$"(L#%&'38$% ,=.0=0% 0+6% ++21% !"#$"(8%M443$3'8% -0.61/% +-6% 521% F3#3$)D3'8%F)**"G% 6,.6,,% -1A% A2-% It is also significant to note that there is no clear link between the quality of preschools in each neighborhood, as measured by the aforementioned QRIS, and neighborhood income. In fact, the average quality tier of preschools in the richest five neighborhoods, at 3.37, is slightly below that of the poorest five neighborhoods, which have an average QRIS rating of 3.42. This suggests that, as a result of PFA, children from low-income families have greater access to high quality preschool, and the quality of their preschool education actually rivals that of their wealthier counterparts within the city. This is a major success of the program, and it holds much broader implications for the policy, especially as program administrators and local government officials reflect on the program’s impact over the past ten years. The data presented in Tables 10.1 and 10.2 affirms PFA’s ability to uphold its mission of increasing access to quality preschool for all children but especially children from low-income
  • 58.
    ! &)! families. Theprogram addresses the evidence-based gap in the market for preschool. This gap, which refers to the inequities in access to quality preschool for low-income families, represents an ongoing challenge for PFA, but also an area of marked improvement since the program’s implementation. As the program has continued to expand over the past few years, it has strengthened its focus on serving low-income neighborhoods in the city. For instance, in 2011 seventy percent of children not attending preschool in San Francisco lived in five communities: Bayview/ Hunter’s Point, Visitacion, Potrero Hill, Inner Mission, and Outer Mission.122 Based on 2014 preschool enrollment numbers, these communities compose 36.3% of total enrollment in PFA preschools, highlighting the program’s strong commitment to under-resourced neighborhoods in the city.123 While low-income families are traditionally underrepresented in and underserved by preschool in California, PFA has acted on its mission to improve access to high quality preschool for the very neighborhoods in San Francisco most in need of these services. A Response to Concerns Over Preschool Expansion Referring back to Olsen and Snell’s assessment of preschool policy proposals, one of the central arguments against preschool expansion in California is that it provides middle class and wealthy families with a free ride. As the argument goes, universal preschool programs create an entitlement program for the poor and inefficiently subsidize early education programs for families who would be able to pay regardless. From the evidence and analysis just provided, these claims are for the most part refuted by PFA’s impact thus far in San Francisco. The distribution of participation rates by income clearly shows that PFA serves a disproportionately low-income population. The program and its impact over the past ten years highlight that !!!!!!!!!!!!!!!!!!!!!!!!!!!!!!!!!!!!!!!!!!!!!!!!!!!!!!!! 122 Ricks, Alice. Increasing School Readiness Among Children in Families with CALWORKS Childcare Vouchers. Berkeley, California, 2011. 6. 123 See Table 9.0. Percentage is calculated by summing the enrollment percentages for Bayview/ Hunter’s Point, Visitacion, Potrero Hill, and the Mission neighborhoods.!
  • 59.
    ! &*! universal preschoolpolicy can reach a wide audience while still paying special attention to certain groups. Low-income families stand to gain more from universal preschool in San Francisco and are in fact served by PFA at a higher rate than their wealthier counterparts. Even without PFA, the city’s wealthiest families will continue to have access to quality preschool through various program options. This does not mean, however, that funding for PFA is wasted on middle and upper class families and certainly does not mean that these families are taking advantage of public subsidies. On the whole, PFA has helped to enable what is left of the middle class to stay in San Francisco. In the absence of PFA, middle-income families like the Daars would have limited options for quality, affordable preschool and would be under even greater financial duress to leave the city.124 The middle class is financially vulnerable as a result of city trends in increased cost of living and housing, and it will continue to shrink in the absence of public programs and policies that subsidize essential services such as early education. Furthermore, the number of wealthy families served by PFA is limited compared to the number of low-income families. This percentage of families who unnecessarily receive subsidized preschool is even less significant when the proportion who have given their tuition credits back for scholarships and other subsidies for the program is taken into account. PFA can certainly improve its mechanisms for tracking funding and tuition credits, and the program is already in the process of identifying ways to improve in this regard. This is discussed further in the section on policy recommendations. Moreover, it is worth mentioning the potential benefits of socioeconomic diversity in the classroom. The nine percent of PFA children whose families earn more than $100,000 a year offer one financial inefficiency for an organization that has at times been strapped for funding. Still, this financial inefficiency may also enhance the learning experience for all children at PFA !!!!!!!!!!!!!!!!!!!!!!!!!!!!!!!!!!!!!!!!!!!!!!!!!!!!!!!! 124 See page 37.
  • 60.
    ! '+! sites. Severalstudies on socioeconomic diversity and early learning report the benefits of having children from various income brackets in the same classroom. Reid, an early education researcher at Columbia University, argues that there is a positive association between socioeconomic diversity and children’s language and math skills.125 The study further indicates that the socioeconomic composition of classrooms plays a critical role in early learning. In this way, socioeconomic diversity of PFA schools may in fact present a learning advantage for children. In spite of this positive externality, a more efficient and effective tracking system for high-income families receiving subsidies and tuition credits is still necessary in creating a more efficient financial model. Other criticism from opponents of state preschool expansion touches on concerns over universal preschool and the creation of entitlement programs. Because the PFA initiative is a universal preschool policy, it cannot be identified as an entitlement program. Even though the program predominantly serves low-income families, it does not limit its services to any one income group or require children to qualify for general participation based on income. PFA offers one clear-cut example of a universal preschool policy that has succeeded in promoting access to quality preschool for all but has especially helped to narrow the gap in school readiness that typically persists between high and low-income groups. The program’s impact over the years is evidence that universal preschool policies can provide services for those who need them most without giving the bulk of wealthy families a free ride. The criticism surrounding preschool policies that in turn create entitlement programs is also void in this instance. Even though PFA is not an entitlement program, aren’t all children entitled to a quality preschool education? The well-researched benefits of a quality preschool !!!!!!!!!!!!!!!!!!!!!!!!!!!!!!!!!!!!!!!!!!!!!!!!!!!!!!!! 125 Reid, Jeanne. “Socioeconomic Diversity and Early Learning: The Missing Link in Policy for High-Quality Preschools.” The Century Foundation. February 6, 2012. http://tcf.org/assets/downloads/tcf-earlylearning.pdf.
  • 61.
    ! '"! education forthree and four year olds should not be limited to a select few. All children are entitled to a quality early education and have the right to enter kindergarten and elementary school on a level playing field with their peers. PFA shows that there are alternative policy solutions to reaching children most in need of quality preschool aside from creating new entitlement programs. PFA honors children’s right to a quality preschool education in San Francisco without relying solely on entitlement programs and limiting its reach to families on the basis of income. PFA’s impact as a policy invalidates the dissent over preschool expansion that stems from issues surrounding freedom of choice. Conservative groups and individuals such as the Goldwater Institute, Olsen and Snell, purport that universal preschool policies limit families’ freedom of choice and impede the already efficient market for preschool. In the ten years since the program’s implementation, PFA has actually expanded families’ options on where to send their child to preschool. The program has not fundamentally changed the market for preschool in San Francisco and has certainly not created a government monopoly on preschool, as these critics warned might happen. It should be noted that PFA remains a voluntary program in San Francisco. Although PFA as a program has expanded significantly since its implementation in 2005, there is still a large number of non-PFA schools that offers early education services in the city. The mixed market for preschool continues to operate alongside the PFA program, which partners with all different types of preschools. As aforementioned, the distribution of PFA preschool partnerships consists of 63% of preschools that receive some form of public subsidies
  • 62.
    ! '#! and 37%that are unsubsidized.126 Within subsidized and unsubsidized program types, families in San Francisco have a variety of options for where to send their child, including but not limited to preschool centers run by SFUSD, tuition-based schools, state preschools, Head Start programs, Title I preschools and even a handful of family child care homes (FCCH).127 These options additionally include preschools offering part, full, and school day enrollment types. By partnering with a variety of types of preschool, PFA works within the mixed market to provide families an array of preschool options and in no way inhibits families’ freedom of choice. Another primary concern over state-supported expansion of preschool mentioned in the literature review is that it holds the potential to create a standardized classroom with limited quality, using ‘drill and kill’ teaching methods instead of more creative and play-based approaches to teaching. The data on program quality indicates otherwise. Preschool expansion in San Francisco has not limited quality, and classroom observations show that the PFA program actually serves as a model on how to incorporate play as a tool for creating more effective learning environments. Tucker points out that PFA’s approach to structuring play in order “to learn skills” has proven successful in both maintaining and nurturing school environment and enhancing the quality of education.128 This was also apparent during my visit to Capp Street Head Start Center in the Mission District. Cecelia Lopez, who’s four year old son, Daniel, is currently enrolled there, noted the quality of education: “preschool is free, and the quality is great. Daniel gets to play with his friends and receives special attention from his teacher.” Preschool teachers at Capp Street try to personalize children’s education as much as possible, and visit each student’s home at least once to develop personal relationships with families. PFA !!!!!!!!!!!!!!!!!!!!!!!!!!!!!!!!!!!!!!!!!!!!!!!!!!!!!!!! 126 Note: these percentages are taken from my own data set, which contains data from only 137 of the roughly 150 PFA partner preschools. Accordingly, these numbers cannot be considered a complete data set of the types of PFA partner schools, but the information does offer insight and trends into the distribution of preschool types involved with the PFA program. 127 Ricks, 17.! 128 Tucker, Jill. "Preschool For All Gives Youths Edge in Kindergarten." SF Gate, September 28, 2013.
  • 63.
    ! '$! preschools maintainhigh quality standards, but also stress the importance of play and a more personalized learning experience. IV. Policy Recommendations and Limitations After speaking with several members of the PFA program, the organization is well aware of some of its financial inefficiencies and recognizes room for improvement. The main financial inefficiency stems from program subsidies for families who can already afford quality preschool. Matthew Rector, a program administrator for PFA since 2006, focuses specifically on onboarding sites and contract administration. In discussing the dilemma of working toward universal preschool and subsidizing families who are not necessarily in need of financial assistance, Rector acknowledged that families can give back their tuition credit from PFA to schools, which can then be used to “offer a greater number of scholarships, more cost reduction, and deeper discounts.”129 In the past, it has been difficult for PFA to track reimbursements from families who have chosen to give their tuition credits back to their schools. While the organization does not have precise numbers on the amount of money given back to schools, Rector suggests that, on the high end, ten to fifteen percent of reimbursements for PFA partner sites come from tuition donations. Moving forward, the program hopes to track such information so that it may paint a more accurate picture of who is and is not using PFA subsidies. A more efficient system for tracking tuition credits and program subsidies offers PFA several benefits. Such a system would dispel concerns over subsidizing preschool for families who are already financially capable of sending their children to quality schools. More importantly, a better tracking system of tuition credits and subsidies will enable a more efficient !!!!!!!!!!!!!!!!!!!!!!!!!!!!!!!!!!!!!!!!!!!!!!!!!!!!!!!! 129 Information is sourced from my interview with Matthew Rector, Preschool For All Program Administrator.
  • 64.
    ! '%! use offunds. Greater transparency in PFA’s funding schemes involves establishing a more comprehensive enrollment and data collection process.130 Data collection on participating families’ use of subsidies and credits will enable more efficient distribution of program subsidies and ultimately increase the number of preschool slots. The demand for quality preschool is still greater than the supply, and it is important for PFA to continue working towards its mission of providing quality preschool to all children in San Francisco. The Age Debate Since its inception in 2005, PFA has improved preschool participation rates of four year olds throughout the city, but its efforts to increase participation amongst three year olds have proven to be lackluster. Over the years, the program’s emphasis on increased accessibility to four year olds has overshadowed the importance of an even earlier start to quality preschool education. In 2012, PFA made its first attempts at expanding program services to three year olds. In taking a targeted approach to increased accessibility, PFA started offering full-day subsidies for as many as 200 qualifying low-income three year olds.131 While the number of three year olds enrolled in PFA preschools still pales in comparison to the more than 5,000 four year olds enrolled, this initiative marked a step in the right direction. As the program looks for new ways to improve its impact in San Francisco, it must continue to expand access to quality preschool education not just for four year olds, but three year olds as well. Preschool participation rates for three year olds, as compared to four year olds, are lower by all local, state and federal accounts. About seventy percent of the nation’s four year olds are !!!!!!!!!!!!!!!!!!!!!!!!!!!!!!!!!!!!!!!!!!!!!!!!!!!!!!!! 130 Ricks, Alice. 59. 131 Note: data was prepared by First 5 SF in 2013 and forwarded by PFA Data Analyst, Xavier Morales.
  • 65.
    ! '&! enrolled inpreschool versus only fifty percent of three year olds.132 Within this, twenty-eight percent of four year olds are enrolled in state-funded pre-K programs while the rate of enrollment for three year olds stands at just four percent.133 The NIEER’s most recent annual report on the state of preschools indicates that eleven percent of three year olds and thirty-eight percent of four year olds are enrolled in state pre-K and Head Start nationwide.134 California offers a slightly different picture in terms of the differences between three and four year old enrollment rates. Table 11.0 below shows that seventeen percent of California’s three year olds are enrolled in state-funded preschool initiatives, special education, and Head Start programs compared to twenty-six percent of four year olds.135 This shows that PFA’s lower participation and enrollment rates for three year olds are not uncommon results for early education policies both within and outside of California, but they still present an opportunity for greater impact moving forward. 136 Table 11.0. These pie charts illustrate the percentages of three and four year olds enrolled in state-funded preschool initiatives, special education, and Head Start. The “Other” category consists of types of programs that qualify as child care rather than preschool, such as state- subsidized child care, and also includes children who may not be attending a center-based preschool program. !!!!!!!!!!!!!!!!!!!!!!!!!!!!!!!!!!!!!!!!!!!!!!!!!!!!!!!! 132 Herman, Julia, Sasha Post, and Scott O'Halloran. "The United States Is Far Behind Other Countries on Pre-K." Center for American Progress. May 2, 2013. 133 Barnett, Stephen, Megan Carolan, James Squires, and Kirsty Brown. "The State of Preschool 2013." 9.! 134 Ibid. 7. Note: These percentages reflect enrollment as a percent of the total population for these ages, respectively.!135 Ibid. 36. 136 Ibid.
  • 66.
    ! ''! The discrepanciesbetween three and four year old participation rates in preschool are particularly alarming given the significant body of research suggesting that three year olds stand to gain a tremendous amount from an earlier start to preschool. Steven Barnett, Director of the NIEER, argues that expanding early education policies to incorporate three year olds is critical in creating a lasting impact; he bases this assertion on the numerous studies that indicate an earlier start and longer duration of preschool ultimately produce better results.137 The positive effects of earlier preschool participation, which include improvements in both cognitive and social development, are lasting effects that benefit children into their future learning experiences. Bearing this in mind, Barnett champions more ECE initiatives that target children under the age of four, especially economically disadvantaged children who stand to benefit the most.138 Loeb et al.’s study examines the extent to which early education benefits children and offers additional support for increased preschool access for three year olds. By looking into the cognitive and social effects of preschool attendance at different ages, the authors’ suggest that more preschool yields better results. The results of their research indicate that the optimal age for entering center-based programs is three years of age.139 Children under the age of two who entered center-based programs did not achieve any significant gains in cognitive development and actually experienced negative impacts in social development.140 It is also important to note that full day programs were especially beneficial for three year olds coming from lower-income families.141 This evidence not only supports calls for PFA to increase access to quality preschool for three year olds, but provides additional support for preschool policies that stand to benefit low-income families the most. !!!!!!!!!!!!!!!!!!!!!!!!!!!!!!!!!!!!!!!!!!!!!!!!!!!!!!!! 137 Barnett, Steven. “Preschool Education and Its Lasting Effects: Research and Policy Implications.” NIEER. 2008. 2.! 138 Ibid. 21. 139 Loeb, Susanna, Margaret Bridges, Daphna Bassock, Bruce Fuller, and Russell Rumberger. "How Much Is Too Much? The Influence of Preschool Centers on Children’s Social and Cognitive Development." Economics of Education Review, no. 26 (2007). 65. 140 Ibid. 141 Ibid.!
  • 67.
    ! '(! Increased accessto preschool for three year olds is a critical issue given the existing levels of inequality in access. PFA was created with the purpose of providing universal access to four year olds with a special emphasis on families who would not otherwise have access to quality early education. The program’s mission can also be interpreted as an initiative to increase accessibility as well as reduce the inequities in overall access to preschool for all four year olds. Still, the inequality in access is even more pronounced for three year olds than it is for four year olds.142 Although policies and programs like PFA have improved access to preschool for four year olds, increased access for three year olds has remained negligible. Perhaps most importantly, improvements in access for children from low and middle-income families have been limited.143 This means that, in addition to being more likely to have attended preschool before kindergarten, children from high-income families are more likely to have started preschool at an earlier age. Moving forward, it is essential that PFA use this information to better address the issue of equity in preschool participation for three year olds. Without a more focused approach for increasing access for three year olds, disparities in school readiness for four and five year olds will persist, especially for low-income families who stand to gain the most from access to quality preschool and family services. Changing Demographics in San Francisco Amid changes in the socioeconomic demographics of San Francisco in recent years, the question remains as to how well PFA can remain true to its mission of increasing access to all but especially low-income families. Although the San Francisco Bay Area was certainly not immune to the 2007-2008 economic recession and its detrimental effects on the housing market !!!!!!!!!!!!!!!!!!!!!!!!!!!!!!!!!!!!!!!!!!!!!!!!!!!!!!!! 142 Barnett, Stephen, and Donald Yarosz. "Who Goes to Preschool and Why Does It Matter?"National Institute for Early Education Research, no. 15 (2007). 14. 143 Ibid.!
  • 68.
    ! ')! and employment,the city has experienced a strong recovery as a result of new job growth from the bustling tech industry. The revitalization of San Francisco’s economy and housing market represents, for many long time residents of the city, both positive and negative change. The rapid demographic changes within San Francisco inherently affect who is served by the PFA program, and recent census data provides further insight into possible population trends that will continue to affect PFA’s focus on low-income families. According to the most recent U.S. census data, the city of San Francisco experienced a four percent population increase from 2010 to 2013 compared to 2.9 percent for the state of California as a whole.144 In real terms, this percentage increase is equivalent to an increase of 20,000 people to the city’s population. While a population increase in and of itself by no means indicates neighborhood gentrification, the growth in income statistics associated with this population increase does offer a more transparent picture of the city’s changing socioeconomic demographics. The cost of living index, which incorporates the cost of housing, food, utilities, transportation, health care and other goods and services, is based on an average of 100, with each city’s index read as a percentage of the average for all cities included in U.S. census data. Next to Manhattan’s index of 216.7, San Francisco has the highest cost of living index in the United States, with an overall cost of living index of 164.145 Even within California, San Francisco’s cost of living index is still far higher than that of Los Angeles and San Diego, cities with cost of living indexes of 136.4 and 132.3, respectively, and larger populations. Such high cost of living indexes does not imply a lack of poverty in these cities, but it does relate to well above average median incomes and housing prices. !!!!!!!!!!!!!!!!!!!!!!!!!!!!!!!!!!!!!!!!!!!!!!!!!!!!!!!! 144 "State and County Quick Facts." United States Census Bureau, 2015. 145 Ibid.
  • 69.
    ! '*! San Francisco’smedian household income stands at a whopping $75,600, significantly higher than California’s average of $61,094.146 Since 2010, the median income in San Francisco increased by twenty percent and shows no signs of slowing down.147 Compared to California as a whole, San Francisco also has a lower percentage of residents living below the poverty level – 13.5 percent compared to 15.9 percent for all of California.148 Median income levels and existing poverty rates are indicative of San Francisco’s high degree of income inequality. In fact, San Francisco has the second highest level of income inequality of any major city in the United States.149 While median household and per capita incomes have continued to increase rapidly over the past few years, the gap between rich and poor has widened. This hollowing out of the middle class is further impacted by the city’s booming housing market. 150 Note: this graph displays dramatic increases in the price of renting an apartment in the city of San Francisco between June of 2013 and 2014. Prices have increased for studio, one bedroom, two bedroom, and three bedroom apartments. Trends in the cost of housing continue to impact the demographics of San Francisco. !!!!!!!!!!!!!!!!!!!!!!!!!!!!!!!!!!!!!!!!!!!!!!!!!!!!!!!! 146 Ibid.!147 Kloc, Joe. "Tech Boom Forces Ruthless A Gentrification in San Francisco." Newsweek, April 15, 2014. 148 “State and County Quick Facts,” 2015. 149 Kloc, Joe. 2014.! 150 Stone, Madeline. "Here's What The Average One-Bedroom Rental Costs Around San Francisco." Business Insider, August 15, 2014.!
  • 70.
    ! (+! Much likethe cost of living index, San Francisco’s cost of housing is second only to Manhattan; by some accounts, the housing market in San Francisco is now the most expensive in the country.151 Median rent in the city is $3,460 a month, and the median price for a new or existing single family home hit $1 million in July of 2014.152 Although these numbers are astonishing in and of themselves, the pace at which housing prices are increasing has realtors across the city ecstatic. From 2013 to 2014, the median price for housing in San Francisco shot up thirty-three percent.153 In addition to monthly rent increases, the number of evictions went up 115 percent, further perpetuating neighborhood gentrification.154 These increases highlight the tremendous economic growth of the city, but also the ensuing changes to local culture and demographics. Due to geographical constraints and strict development laws in San Francisco, gentrification and the associated trends in the city’s socioeconomic demographics are unlikely to change any time soon. San Francisco’s inelastic housing market has left city policy-makers with trade-offs between the preservation of local and cultural contexts versus the continued economic benefits of increasing rent and real estate values. These changes and policy decisions are especially relevant to the PFA program and its mission of providing universal preschool. As the percentage of low and middle-income families in San Francisco decreases, the ability for PFA to maintain its focus on economically disadvantaged families remains uncertain. Dramatic increases in housing prices have undoubtedly contributed to one of the most significant demographic changes in San Francisco with regard to preschool policy: the number of families living in the city is alarmingly low and continues to decrease. San Francisco has the !!!!!!!!!!!!!!!!!!!!!!!!!!!!!!!!!!!!!!!!!!!!!!!!!!!!!!!! 151 Pender, Kathleen. "$1 Million City: S.F. Median Home Price Hits 7 Figures for 1st Time." SF Gate, July 17, 2014. 152 Stone, Madeline. 2014. 153 Pender, Kathleen. 2014. 154 Kloc, Joe. 2014!
  • 71.
    ! ("! lowest percentageof kids of any major city in the United States.155 According to U.S. census data from 2013, just 4.6 percent of the city’s population is five or below compared to 6.5 percent statewide.156 The number of children living in San Francisco has been declining since the 1960s, a time when a quarter of the city’s population was below the age of eighteen.157 This “fleeing” of families from San Francisco to the East Bay suburbs and elsewhere directly impacts the city’s early education policies. Preschool and other ECE policies can only be effective where there are children to serve, and the overall impact of these policies depends on the demand for quality preschool. The low and still declining number of children in San Francisco poses serious limitations to PFA’s potential for impact. The data presented throughout this report illustrates the need for high quality preschool in San Francisco, most importantly for low-income families. While the number of children in the city may be low, there is still plenty of room for PFA to increase access and expand the scope of its programs and partnerships. Waitlists and excess demand for high quality preschool persist, and the city must renew and expand its commitment to early education. PFA must also continue its community outreach efforts to ensure that all families in San Francisco are aware of the benefits of preschool and the resources available to them. Nonetheless, the dwindling number of children in the city does highlight the need for effective and comprehensive early education policy where the population of children and overall demand is even greater than in San Francisco. The benefits of preschool are too important for any child to be ignored. The limited number of children in the city should not detract from support for PFA, but instead encourage similar policies and programs in areas of California where even greater demand for access to high quality preschool programs exists. !!!!!!!!!!!!!!!!!!!!!!!!!!!!!!!!!!!!!!!!!!!!!!!!!!!!!!!! 155 "Families Flee San Francisco: City Has Lowest Percentage Of Kids Of Any Major U.S. City."Huffington Post, March 11, 2012. 156 “State and County Quick Facts,” 2015. 157 "Families Flee San Francisco: City Has Lowest Percentage Of Kids Of Any Major U.S. City," 2012.!
  • 72.
    ! (#! V. Conclusion Accessto quality preschool is a right, not a privilege. This paper provides an in depth look at preschool policy in California and identifies increased access to quality preschool as a key tool in ensuring all three and four year olds a fair start to their education. Starting with an overview of preschool policy frameworks, this paper addresses different views of preschool policy that include but are not limited to preschool expansion as an economic investment, obligation of the state, and unnecessary extension of government in families’ lives. The literature review provided a foundation for better understanding preschool policy and highlighted the central arguments both for and against preschool expansion in California. Data included in media discourse analysis suggested that funding, access and quality are major areas of discussion within preschool policy. This implied that policy debates not only address if preschool should be expanded, but to whom and of what quality and cost. The differing perspectives on preschool policy beg the question of whether or not access to preschool can increase for all, but especially children most in need, without limiting quality. To answer this question, this paper first offers an overview of the market for preschool in California. This section details the various private and public options available to families and importantly identifies the preschool system as a mixed market of mixed quality. Although the majority of three and four year olds attend center-based programs, there is still a tremendous amount of room for increasing participation, especially amongst certain groups. The analysis of the preschool market pays close attention to persisting gaps in access and quality. It is evident that access to quality preschool in California is far from universal, and low-income families have significantly less access to quality preschool compared to their higher-income peers. The state
  • 73.
    ! ($! holds acentral role in maintaining the preschool system and provides funding for many of these essential services. In the absence of a self-correcting private market for preschool, many of California’s children will continue to forego the benefits of preschool solely because of their families’ income level. It is imperative moving forward that the state offers policy solutions to increase access to quality preschool for families most in need and who stand to benefit the greatest, namely economically disadvantaged families. San Francisco’s Preschool For All initiative serves as a policy model for increasing access to quality preschool for all children but especially those from low-income backgrounds. This paper analyzes PFA’s effectiveness in terms of access and quality. PFA operates with the goal of increasing access to quality preschool for all children in San Francisco, and it is evident that the program has lived up to its mission. PFA’s impact extends beyond that of increasing preschool participation rates to well above state and national averages. In its ten years since implementation, the program has reached families most in need of quality preschool services. Increases in preschool participation rates are most pronounced for low-income and minority families. It is also critical to note that family income is not a determinant of the level of quality preschool education a child receives through PFA. Data included in this study highlights that the quality of PFA partner preschools is high across neighborhoods of varying incomes, and children from low-income families have access to the same quality early education as their wealthier peers. PFA’s ability to increase access to quality preschool without limiting quality helps to refute many of the criticisms surrounding preschool expansion. PFA works within the mixed market for preschool to offer families a number of options for where to send their child. Moreover, the program shows that universal policies can increase access for all children while
  • 74.
    ! (%! focusing especiallyon families most in need. Preschool expansion does not have to limit quality or lead to standardized classrooms. PFA preschools hold high quality standards but also recognize the importance of maintaining local and cultural contexts as well as personalizing the learning experience. There is certainly still room for improvement. A more efficient tracking system of tuition credits and subsidies as well as expanded efforts to collect enrollment data will help the program further increase access. While the program has had a significant impact on increasing access for four year olds, it has not fully implemented strategies for increasing enrollment of three year olds. These improvements will help the program come closer to achieving its goal of universal access to quality preschool in San Francisco. Through its commitment to increasing access and quality, PFA will continue to make an impact and help level the playing field for all children in the city as they begin their primary education. San Francisco’s PFA model highlights the potential for policy to create a more fair and inclusive early education system. There are certainly limitations in replicating this model elsewhere in California – universal preschool is politically salient in San Francisco, and the city has the budget to be able to offer these services. Nonetheless, local and state government must adopt a similar commitment to ensure all three and four year olds receive a quality preschool education and are prepared for primary education. All children have the right to a quality education; preschool policy that promotes access and quality for all children but especially California’s most economically disadvantaged families is a great starting point for ensuring this right. The benefits of preschool are too great and the stakes too high for preschool access to remain limited to a select few. Increased access to quality preschool through policy is possible, and we as a society can ensure that all children have equal opportunity as they begin their education.
  • 75.
    ! (&! Works Cited “AboutHead Start.” California Head Start Association. 2015. caheadstart.org. Barnett, Stephen, and Donald Yarosz. "Who Goes to Preschool and Why Does It Matter?"National Institute for Early Education Research, no. 15 (2007). Barnett, Stephen, Ellen Frede, and Kenneth Robin. “Is More Better? The Effects of Full-Day vs. Half-Day Preschool on Early School Achievement.” 2006. http://nieer.org/resources/research/IsMoreBetter.pdf. Barnett, Stephen, Megan Carolan, James Squires, and Kirsty Brown. "The State of Preschool 2013." National Institute for Early Education Research, 2013 Bernstein, Sharon. "In Newly Solvent California, Dems Propose Free Preschool." Huffington Post, January 7, 2014. Boskin, Michael. "Quit Taxing the Rich to Fund Your Pet Projects." Los Angeles Times, May 1, 2006. Burke, Lindsey, and Lisa Snell. "Universal Pre-K May Not Be as Good as It Sounds." Reason Foundation, 2014. http://reason.org/news/show/universal-pre-k-may-not-be-as-good. "California Children's Report Card: How Kids Are Doing in Our State and What Needs to Be Done About It." Children Now. 2014. "Child Care and Development Programs." California Department of Education. March 20, 2015. http://www.cde.ca.gov/sp/cd/op/cdprograms.asp. “City of San Francisco Children and Families First City Funds, Tax and Administration Proposal, Proposition C.” Ballotpedia. 2014. Cote, John. “S.F. Mayor Ed Lee Promises Funds for Preschool, Muni.” SF Gate. January 14, 2015. "Environment Rating Scales." Frank Porter Graham Child Development Institute. 2015. http://ers.fpg.unc.edu/. "Evaluating Preschool For All Effectiveness." First 5 SF. August 1, 2013. "Families Flee San Francisco: City Has Lowest Percentage Of Kids Of Any Major U.S. City."Huffington Post, March 11, 2012. Fuller, Bruce, Alejandra Livas, and Margaret Bridges. "How to Expand and Improve Preschool in California." Policy Analysis for California Education, 2006.
  • 76.
    ! ('! Fuller, Bruce.Standardized Childhood. Stanford: Stanford University Press, 2007. Garland, Sarah. "More, Better Early Education Could Help Close California's Achievement Gap." The Hechinger Report, October 24, 2011. Graff, Amy. “SF’s PFA Adds 10 New Sites.” SF Gate. June 4, 2009. http://blog.sfgate.com/sfmoms/2009/06/04/s-f-s-preschool-for-all-adds-10-new-sites/. Herman, Julia, Sasha Post, and Scott O'Halloran. "The United States Is Far Behind Other Countries on Pre-K." Center for American Progress. May 2, 2013. “Improving Basic Programs Operated by Local Educational Agencies.” US Department of Education. June 4, 2014. http://www2.ed.gov/programs/titleiparta/index.html. Jacobson, Linda. "On The Cusp in California: How PreK-3rd Strategies Could Improve Education in the Golden State." New America Foundation, 2009 Karoly, Lynn. "Preschool Adequacy and Efficiency in California." RAND Corporation, 2009. Karoly, Lynn, Bonnie Ghosh-Dastidar, Gail Zellman, Michal Perlman, and Lynda Fernyhough, “Prepared to Learn: The Nature and Quality of Early Care and Education for Preschool-Age Children in California.” RAND Corporation, 2008. Karoly, Lynn, and James Bigelow. "The Economics of Investing in Universal Preschool in California." RAND Corporation, 2005. http://www.rand.org/pubs/monographs/MG349z1.html. Kirp, David. "California Should Give All Kids the Pre-K Advantage." Los Angeles Times, January 1, 2014. Kirp, David. The Sandbox Investment: The Preschool Movement and Kids-First Politics. Cambridge: Harvard University Press, 2007. Klein, Karin. "Scary Preschool Utopia." Los Angeles Times, June 5, 2005. Kloc, Joe. "Tech Boom Forces Ruthless A Gentrification in San Francisco." Newsweek, April 15, 2014. Loeb, Susanna, Anthony Bryk, and Eric Hanushek. Getting Down to Facts: School Finance and Governance in California. Stanford University, 2007. Loeb, Susanna, Margaret Bridges, Daphna Bassock, Bruce Fuller, and Russell Rumberger. "How Much Is Too Much? The Influence of Preschool Centers on Children’s Social and Cognitive Development." Economics of Education Review, no. 26 (2007).
  • 77.
    ! ((! Lucich, Mardi,and Kelly Lynch. “Cost Models of Three Types of Early Care and Education in San Francisco: What is the True Cost of High Quality Care?” SF Department of Youth and Their Families. 2009. “Mission Head Start." Mission Neighborhood Centers, Inc.2014. www.mncsf.org. Mongeau, Lillian. "Not Investing in Preschool Is 'Mortgaging Our Future'"EdSource, March 11, 2013. "Most California Children Attend Center-Based Preschools; Educational Quality of Programs Falls Short." Rand Corporation, 2008. Olsen, Darcy, and Lisa Snell. "Assessing Proposals for Preschool and Kindergarten." Reason Foundation, 2006. http://reason.org/news/show/assessing-proposals-for-presch. Pender, Kathleen. "$1 Million City: S.F. Median Home Price Hits 7 Figures for 1st Time." SF Gate, July 17, 2014. "Preschool Adequacy and Efficiency in California: Issues, Policy Options, and Recommendations." The David and Lucile Packard Foundation. January 1, 2009. "Preschool For All!" Goldwater Institute. October 8, 2007. http://goldwaterinstitute.org/article/preschool-all-0. “Proposition H-Public Education Fund.” SPUR. March 1, 2004. http://www.spur.org/publications/voter-guide/2004-03-01/proposition-h-public-education-fund “Proposition H Funding.” First 5 San Francisco. http://www.first5sf.org/press/proph. “Public Education Enrichment Fund.” San Francisco Unified School District. 2015. http://www.sfusd.edu/en/about-sfusd/voter-initiatives/public-education-enrichment-fund.html. Reid, Jeanne. “Socioeconomic Diversity and Early Learning: The Missing Link in Policy for High-Quality Preschools.” The Century Foundation. February 6, 2012. http://tcf.org/assets/downloads/tcf-earlylearning.pdf. "Research Shows: The Benefits of High Quality Learning." Early Edge California. 2015. http://www.earlyedgecalifornia.org/resources/research--studies/making-the-case.html. Resmovits, Joy. "Preschool Funding Reached 'State Of Emergency' In 2012: NIEER Report."Huffington Post, April 29, 2013. Ricks, Alice. Increasing School Readiness Among Children in Families with CALWORKS Childcare Vouchers. Berkeley, California, 2011.
  • 78.
    ! ()! "RTT-ELC Implementation."California Department of Education. January 9, 2015. http://www.cde.ca.gov/sp/cd/rt/rttelcapproach.asp. Schumacher, Kristin. "Reinvesting in California’s Children: Preschool for All?" California Budget and Policy Center. May 7, 2014. “SF Family Resource Initiative Evaluation.” First 5 San Francisco. 2013. http://www.first5sf.org/programs/preschool-all. “San Francisco Family Resource Center Initiative, Year 2 Evaluation.” First 5 San Francisco. July 2012. http://www.first5sf.org/sites/default/files/page-files/11_frc_es.pdf. "State and County Quick Facts." United States Census Bureau. March 31, 2015. http://quickfacts.census.gov/qfd/states/06000.html. Stone, Madeline. "Here's What The Average One-Bedroom Rental Costs Around San Francisco." Business Insider, August 15, 2014. “TK California." TK California: A Project of Early Edge California. 2015. http://www.tkcalifornia.org/. “Top 10 Daily California Newspapers." Cision. March 3, 2010. Tucker, Jill. "Preschool For All Gives Youths Edge in Kindergarten." SF Gate, September 28, 2013. Tucker, Jill. “School Board Votes to Save Prop. H Cash for Shortfall.” SF Gate. January 23, 2008. http://www.sfgate.com/bayarea/article/School-board-votes-to-save-Prop-H-cash-for- 3230110.php. “2013/2014 PFA Preschools.” First 5 San Francisco. 2013. http://www.first5sf.org/sites/default/files/page-files/Directory_PFA_CURRENT.pdf.
  • 79.
  • 80.
  • 81.
    ! )"! SF PFAPreschool Partner Sites Funding Type Funding Type Subset Top Words Frequency Top Bigrams Top Trigrams Preschool 1267 1, Billion % 3, Year, Olds Children 783 Child, Care % Children, Low, Income State 608 Childhood, Education Darrell, Steinberg, D Year 599 Day, Care % Early, Childhood, Education Education 561 Early, Childhood Gov., Jerry, Brown School 462 Early, Education High, Quality, Early Programs 426 Early, Learning High, Quality, Preschool Program 400 First, 5 % Low, Income, Children Early 375 Funded, Preschool Low, Income, Families California 373 Gov., Jerry % Preschool, Year, Olds Budget 338 Head, Start % President, Barack, Obama Income 333 High, Quality Publicly, Funded, Preschool Kindergarten 328 High, School % Rainy, Day, Fund Years 283 Income, Children Say, Start, Conversation New 267 Income, Families President, Pro, Tem Child 262 Jerry, Brown % State, Funded, Preschool Families 247 K, 12 % % Money 243 Long, Term % % High 240 Los, Angeles % % Care 237 Low, Income % Kids 229 Middle, Class % Percent 222 Pre, K % % Start 220 Pre, Kindergarten % Parents 216 Preschool, Program % Quality 215 Preschool, Programs % Day 214 Prop, 82 % % Low 213 Quality, Preschool % Also 209 State, Preschool % One 206 Transitional, Kindergarten % Funding 205 Universal, Preschool % States 201 % % Olds 193 % % Public 186 % % Million 185 % % Billion 184 % % Universal 182 % % Students 181 % % First 179 % %
  • 82.
    ! )#! Subsidized UnsubsidizedTuition- Based Scholarship Sliding Scale State Preschool Head Start Title I C5 Children's School State Building ! ! ! ! C5 Children's School City Building ! ! ! ! CDI Head Start Cadillac Center ! ! Clara House/Helen Hawk Children's Center ! ! ! ! Compass Children's Center ! ! ! ! Cross Cultural Family Center- Tenderloin Center ! ! ! ! ! Glide Child Care & Family Support ! ! ! ! Salvation Army Harbor House ! ! ! ! SFUSD Tenderloin Community School CDC ! ! ! Wu Yee Children's Services- Golden Gate ! ! Holy Family Day Home ! ! ! ! ! Mission Neighborhood Centers, Inc.- Stevenson Head Start Center ! ! Mission Neighborhood Centers, Inc.-Valencia Gardens Head Start Center ! ! Presidio Knolls School ! ! SFUSD- Bessie Carmichael CDC ! ! ! South of Market Child Care, Inc.- Judith Baker Center ! ! ! Bright Horizons/Marin Day Schools- Main St. Campus ! ! Bright Horizons/marin Day Schools- Fremont St. Campus ! ! Bright Horizons/Marin Day Schools- Healthy Environments CDC ! ! CDI Head Start Potrero Hill Center ! ! Mission Neighborhood Centers, Inc.- Mission Bay Head Start Center ! ! ! Potrero Kids at Daniel Webster ! ! ! ! Potrero Kids at 3rd St. Site ! ! ! ! SFUSD - Starr King Early Education School ! ! South of Market Child Care, Inc.- Yerba Buena Gardens CDC ! ! ! Chinatown Community Children's Center ! ! ! Kai Ming, Inc.- Powell head Start Center ! ! SFUSD- Commodore Stockton CDC ! ! ! SFUSD- Gordon J. Lau Title I Pre-K ! ! True Sunshine Preschool Center, Inc. ! ! ! ! ! Wu Yee Children's Services- Lok Yuen Child Development Program ! ! Community Preschool, Grace Cathedral ! ! ! !
  • 83.
    ! )$! Buen DiaFamily School ! ! ! ! Centro Las Olas ! ! Cdi Head Start Alemany Center ! ! CCSF- Mission Community College Center ! ! Family Service Agency SF- Family Developmental Center ! ! ! The Family School ! ! ! ! FCC-Acosta, Milagros ! ! Good Samaritan Family Resource Center Preschool ! ! ! ! ! Little Tree Preschool ! ! Mission Kids ! ! Mission Neighborhood Centers, Inc.-Bernal Dwellings Head Start ! ! Mission Neighborhood Centers, Inc.-Capp st Head Start ! ! Mission Neighborhood Centers, Inc.-Regina Chiong Head Start ! ! Mission Neighborhood Centers, Inc.- Women's Building Head Start ! ! SFUSD-Bryant CDC ! ! ! SFUSD- Cesar Chavez Title I Pre-K ! ! SFUSD-Junipero Serra Annex CDC ! ! ! SFUSD-Las Americas CDC ! ! ! SFUSD-Paul Revere Elementary School PFA Pre-K ! ! SFUSD-Zaida Rodriguez CDC ! ! ! Kai Ming, Inc.-Broadway Head Start ! ! CCSF-Campus Children's Center ! ! FCC-Estrada, Esperanza ! ! FCC-Fuentes, Nancy ! ! FCC-Guidry, Monique ! ! FCC-Manzanares, Barbara ! ! FCC-Ramirez,Elena ! ! Mission Neighborhood Centers, Inc.-Jean Jacobs Head Start ! ! SFUSD-Excelsior CDC ! ! ! SFUSD-San Miguel CDC ! ! ! SFUSD-Sheridan ! ! YMCA SF- Mission Branch Preschool ! ! ! ! FCC-Fellom, Julie ! ! Friends of St. Francis Childcare Center ! ! ! ! ! SFUSD-Sanchez Elementary School Preschool ! !
  • 84.
    ! )%! SFUSD-Theresa S.Mahler CDC ! ! ! CDI Head Start Ella Hill Hutch Center ! ! CDI Head Start Westside Center ! ! Chibi Chan Preschool ! ! ! ! Cross Cultural Family Center- Marcus Garvey Center ! ! ! ! ! Little Children's Developmental Center ! ! ! ! Nihonmachi Little Friends Bush Site ! ! ! ! ! Nihonmachi Little Friends Sutter Site ! ! SFUSD-Dr. William Cobb Pre-K ! ! ! SFUSD-Raphael Weill CDC ! ! FCC-Cherdak, Juliya ! ! FCC-Melikyan, Gayane ! ! FCC-Moy,Xiao-Song ! ! Kai Ming, Inc.-Sunset Head Start ! ! Little Footprints Preschool ! ! CCSF-Orfalea Family Center ! ! FACES-SF Masonic Preschool ! ! Pacific Primary ! ! ! ! SFUSD-Grattan CDC ! ! ! SFUSD- John Muir Title I Pre-K ! ! Bright Horizons/Marin Day Schools-UCSF Laurel Heights ! ! Congregation Beth Sholom Preschool ! ! ! ! SFUSD-Argonne CDC ! ! ! St. James Preschool ! ! ! ! Cross Cultural Family Center- Richmond Center ! ! ! ! ! FCC-Yuan,Philip ! ! Happy Shalom School ! ! ! ! Kai Ming, Inc.-Geary Head Start ! ! Kai Ming, Inc-Richmond Head Start ! ! Land's End School ! ! ! ! FCC-Chen Selina ! ! FCC- Schmit Marina ! ! SFUSD-Jefferson CDC ! ! ! SFUSD-Noriega CDC ! ! ! Wah Mei School ! ! ! ! ! SFUSD-Tule Elk Park CDC ! ! ! CDI Head Start Hunters' Point ! !
  • 85.
    ! )&! CDI HeadStart Southeast Center ! ! FACES-SF Bayview Preschool ! ! ! FCC-Suarez,Delia ! ! FCC-Underwood,Renee ! ! Frandelja Enrichment Center ! ! ! ! ! Mission Neighborhood Centers, Inc.-Southeast Families United Center ! ! SFUSD-Bret Harte CDC ! ! ! ! SFUSD-Dr.Charles Drew CDC ! ! ! ! SFUSD-Leola M. Havard Early Education School ! ! ! YMCA SF-Stonestown Family Preschool ! ! ! ! SFUSD-Presidio CDC ! ! ! Catholic Charities CYO-Treasure Island CDC ! ! SFUSD-Fairmount Title I Pre-K ! ! CDC Head Start Oceanview- Merced-Ingleside Center ! ! Economic Opportunity Council SF-OMI Site ! ! FCC-Khazan Larisa ! ! ! Utopia St. Thomas More Preschool ! ! ! ! Kai Ming, Inc.-North Beach Head Start ! ! Telegraph Hill Neighborhood Center Preschool ! ! ! ! ! Wu Yee Children's Services- Generations CDC ! ! 1st Place 2 Start ! ! CDI Head Start Sunnydale Center ! ! ! Child's Time Preschool ! ! ! ! Cross Cultural Family Center- Visitacion Valley Family School ! ! ! Cross Cultural Family Center- Visitacion Valley John King Center ! ! Cross Cultural Family Center- Visitacion Valley Tucker Center ! ! ! FCC-Chow Sandy ! ! Portola Family Connections ! ! ! ! SFUSD-E.R. Taylor Title I Pre-K ! ! SFUSD-John McLaren CDC ! ! Wu Yee Children's Services- Sunnydale CDC ! ! Total (Out of 135) 85 50 90 34 34 52 31 5 Total % 63% 37% 67% 25% 25% 39% 23% 4%
  • 86.
    ! )'! SF PFAPreschool Partner Sites Enrollment Type Full Day Part Day School Day C5 Children's School State Building ! C5 Children's School City Building ! CDI Head Start Cadillac Center ! Clara House/Helen Hawk Children's Center ! Compass Children's Center ! Cross Cultural Family Center- Tenderloin Center ! ! Glide Child Care & Family Support ! Salvation Army Harbor House ! SFUSD Tenderloin Community School CDC ! Wu Yee Children's Services- Golden Gate ! Holy Family Day Home ! Mission Neighborhood Centers, Inc.- Stevenson Head Start Center ! Mission Neighborhood Centers, Inc.-Valencia Gardens Head Start Center ! Presidio Knolls School ! SFUSD- Bessie Carmichael CDC ! South of Market Child Care, Inc.- Judith Baker Center ! Bright Horizons/Marin Day Schools- Main St. Campus ! Bright Horizons/marin Day Schools- Fremont St. Campus ! Bright Horizons/Marin Day Schools- Healthy Environments CDC ! CDI Head Start Potrero Hill Center ! Mission Neighborhood Centers, Inc.- Mission Bay Head Start Center ! Potrero Kids at Daniel Webster ! Potrero Kids at 3rd St. Site ! SFUSD - Starr King Early Education School ! South of Market Child Care, Inc.- Yerba Buena Gardens CDC ! Chinatown Community Children's Center ! Kai Ming, Inc.- Powell head Start Center ! SFUSD- Commodore Stockton CDC ! ! SFUSD- Gordon J. Lau Title !
  • 87.
    ! )(! I Pre-K TrueSunshine Preschool Center, Inc. ! Wu Yee Children's Services- Lok Yuen Child Development Program ! Community Preschool, Grace Cathedral ! ! Buen Dia Family School ! Centro Las Olas ! Cdi Head Start Alemany Center ! CCSF- Mission Community College Center ! Family Service Agency SF- Family Developmental Center ! The Family School ! FCC-Acosta, Milagros ! Good Samaritan Family Resource Center Preschool ! ! Little Tree Preschool ! Mission Kids ! Mission Neighborhood Centers, Inc.-Bernal Dwellings Head Start ! Mission Neighborhood Centers, Inc.-Capp st Head Start ! Mission Neighborhood Centers, Inc.-Regina Chiong Head Start ! Mission Neighborhood Centers, Inc.- Women's Building Head Start ! SFUSD-Bryant CDC ! SFUSD- Cesar Chavez Title I Pre-K ! SFUSD-Junipero Serra Annex CDC ! SFUSD-Las Americas CDC ! SFUSD-Paul Revere Elementary School PFA Pre-K ! SFUSD-Zaida Rodriguez CDC ! Kai Ming, Inc.-Broadway Head Start ! CCSF-Campus Children's Center ! FCC-Estrada, Esperanza ! ! ! FCC-Fuentes, Nancy ! ! ! FCC-Guidry, Monique ! ! ! FCC-Manzanares, Barbara ! ! ! FCC-Ramirez,Elena ! ! !
  • 88.
    ! ))! Mission Neighborhood Centers,Inc.-Jean Jacobs Head Start ! SFUSD-Excelsior CDC ! SFUSD-San Miguel CDC ! SFUSD-Sheridan ! YMCA SF- Mission Branch Preschool ! FCC-Fellom, Julie ! Friends of St. Francis Childcare Center ! SFUSD-Sanchez Elementary School Preschool ! SFUSD-Theresa S. Mahler CDC ! CDI Head Start Ella Hill Hutch Center ! CDI Head Start Westside Center ! Chibi Chan Preschool ! ! ! Cross Cultural Family Center-Marcus Garvey Center ! Little Children's Developmental Center ! Nihonmachi Little Friends Bush Site ! ! ! Nihonmachi Little Friends Sutter Site ! ! ! SFUSD-Dr. William Cobb Pre-K ! SFUSD-Raphael Weill CDC ! FCC-Cherdak, Juliya ! ! FCC-Melikyan, Gayane ! ! ! FCC-Moy,Xiao-Song ! ! ! Kai Ming, Inc.-Sunset Head Start ! Little Footprints Preschool ! CCSF-Orfalea Family Center ! FACES-SF Masonic Preschool ! Pacific Primary ! SFUSD-Grattan CDC ! SFUSD- John Muir Title I Pre-K ! Bright Horizons/Marin Day Schools-UCSF Laurel Heights ! Congregation Beth Sholom Preschool ! SFUSD-Argonne CDC ! St. James Preschool ! Cross Cultural Family Center-Richmond Center !
  • 89.
    ! )*! FCC-Yuan,Philip !! ! Happy Shalom School ! Kai Ming, Inc.-Geary Head Start ! Kai Ming, Inc-Richmond Head Start ! Land's End School ! FCC-Chen Selina ! ! ! FCC- Schmit Marina ! ! ! SFUSD-Jefferson CDC ! SFUSD-Noriega CDC ! ! Wah Mei School ! ! ! SFUSD-Tule Elk Park CDC ! CDI Head Start Hunters' Point ! CDI Head Start Southeast Center ! FACES-SF Bayview Preschool ! FCC-Suarez,Delia ! ! ! FCC-Underwood,Renee ! ! ! Frandelja Enrichment Center ! Mission Neighborhood Centers, Inc.-Southeast Families United Center ! SFUSD-Bret Harte CDC ! SFUSD-Dr.Charles Drew CDC ! SFUSD-Leola M. Havard Early Education School ! YMCA SF-Stonestown Family Preschool ! ! SFUSD-Presidio CDC ! Catholic Charities CYO- Treasure Island CDC ! SFUSD-Fairmount Title I Pre-K ! CDC Head Start Oceanview-Merced- Ingleside Center ! Economic Opportunity Council SF-OMI Site ! FCC-Khazan Larisa ! ! ! Utopia St. Thomas More Preschool ! ! ! Kai Ming, Inc.-North Beach Head Start ! Telegraph Hill Neighborhood Center Preschool ! Wu Yee Children's Services-Generations CDC ! 1st Place 2 Start ! ! !
  • 90.
    ! *+! CDI HeadStart Sunnydale Center ! Child's Time Preschool ! ! ! Cross Cultural Family Center-Visitacion Valley Family School ! Cross Cultural Family Center-Visitacion Valley John King Center ! Cross Cultural Family Center-Visitacion Valley Tucker Center ! FCC-Chow Sandy ! ! ! Portola Family Connections ! SFUSD-E.R. Taylor Title I Pre-K ! SFUSD-John McLaren CDC ! Wu Yee Children's Services-Sunnydale CDC ! Total (Out of 135) 115 38 31 Total % 85% 28% 23%