1
Subject
Project
Topic
Financial Analysis Of Cement Industry
Submitted To,
Sir Umer Iqbal Siddiqi
Submitted By,
Muhammad Imran (3009)
Mudassar Nazar (3015)
Muhammad Asif (3021)
Group Leader, Mudassar Nazar (3015)
Class
B.B.A 8th
(Evening)
2
Dedication
Dedicated to
Our dear and near, those who always help us when we need them and give us the
lesson of encouragement to say that,
“A winner is one who accepts his failures and mistakes, picks up the pieces, and
continues striving to reach his goals”.
We are very thankful to our respected teacher and also dedicate our this project
to our teacher,
3
Sir Umer Siddiqi
2. Acknowledgement
Firstly we would like to pay our deep thanks to Allah Almighty who gave us the
strength and ability to make this project report.
Next we owe our bottomless thanks to our respected teacher SIR UMER IQBAL
SIDDIQI who directed us well and was always available to clear our doubts and
misunderstanding.
We wish to thanks to our friends for suggestions and critical review of the
manuscript.
Thank You
4
3. ABSTRACT
The purpose of this research report is to evaluate, analyze and compare the financial
statements of Pioneer Cement Comparison with Kohat & Cherat Cement comparative analysis.
We have chosen these three companies on the basis of their financial performance, they are also
listed on all major stock exchanges of the country.
After researching, surveying, observing, collection of data, we have arrived at the written
analysis follows hereafter. As the requirement of the report, We have conducted a detailed study
of the analysis the financial statements and ratios.
On the basis of above information, We have arrived on specific recommendations from
strategic management‟s viewpoint. We have supported suggestions through strategic theories,
matrices and exhibits, present in the report.
The report includes the whole financial status of both the companies through which a
reader can get the financial strengths & weakness of both the organizations.
The fundamentals of the research is to build the reader‟s capability to evaluate the
financial data & information into projective manner as to compare the financial stability &
growth with each other in consequence either for enhancement & for decrement.
Pakistan currently has a per capita consumption of 120kg of cement, which is comparable
to that for India at 135kg per capita but substantially below the World Average 270kg and the
regional average of over 400kg for peers in Asia and over 600kg in the Middle East. Over the
years a number of tax policy and administrative measures have been introduced to attract
investment and facilitate growth of the cement industry. The Government has reduced central
excise duty (CED) on cement in the budget for 2011-12 in order to boost construction activity.
5
In Pakistan APCMA plays a significant role in protecting the cement industry to the
Government and coordinating various activities in respect of formulation of Government policies
for the cement industry. Cement demand is significantly affected by the Public Sector
Development Program (PSDP), construction of dams, elevated and concrete roadways,
residential construction as well as exports.
Table of Content
Sr. Topic Page No.
Dedication 2
Acknowledgement 3
Abstract 4
1. Introduction cement industry 7
1.1 At the time of independence 7
1.1.1 Ayub Khan Era 7
1.1.2 Nationalization In Bhutto‟s Era 8
1.1.3 De-Nationalizationin Zia Ul Haq Era 8
1.1.4 Privatization In Nawaz Shariff‟s Era 9
1.1.5 General Musharaf Era 10
1.1.6 Historical development of cement industry 11
1.1.7 Economic development 11
1.2 World perspective of cement industry 12
1.2.1 Wto‟s regulation and its economic impact 13
1.2.2 Dumping 14
1.2.3 Subsidy 14
1.2.4 Countervailing duties ordinance, 2000 14
1.2.5 Agreement of subsidy and countervailing measures 15
1.2.6 Safeguard actions 15
1.2.7 Economic impact of wto on cement industry Pakistan 16
1.2.8 Types of cement production worldwide 18
1.2.9 Types of cement available in international market 18
1.2.10 Types of cement in Pakistan 19
1.3 Total employment in Cement industry 23
1.4 Challenges and issues and their solutions 24
2. Market shares of firms in cement industry 30
Profile of selected firms 31
2.1 Poineer cement limited 31
6
2.2 Cherat cement limited 33
2.3 Kohat cement limited 35
2.4 Trade of union of cement industry 39
3. Financial analysis 41
3.1 Data collection 45
3.2 Ratio analysis 47
3.3 Data collection procedures 48
3.4 Analysis procedures 48
3.5 Tool of analysis 50
4. Data analysis, Result/Findind and discussion 51
4.1 Kohat cement company 51
4.1.1 Balance sheet (horizontal analysis) 51
4.1.2 Balance sheet (vertical analysis) 55
4.1.3 Income statement (horizontal analysis) 59
4.1.4 Income statement (vertical analysis) 62
4.2 Pioneer cement limited 65
4.2.1 Balance sheet (horizontal analysis) 68
4.2.2 Balance sheet (vertical analysis) 74
4.2.3 Income statement (vertical analysis) 76
4.2.4 Income statement (horizontal analysis) 82
4.3 Ratio analysis 86
4.3.1 Liquidity ratio 86
4.3.2 Current ratio 86
4.3.3 Quick ratio 89
4.3.4 Turnover ratio 92
4.3.5 Debtors turnover ratio 94
4.3.6 Total assets turnover ratio 96
4.3.7 Fixed turnover ratio 97
4.4.1 Profitability ratio 99
4.4.2 Gross profit ratio 99
4.4.3 Operating Profit Ratio 101
4.4.4 Return On assets 103
4.4.5 Return on equity ratio 105
4.4.6 Debt ratio 107
4.4.7 Debt service ratio 109
4.5 General ratio analysis 111
4.5.1 Probitability analysis 111
4.5.2 Liquidity analysis 112
4.5.3 Debt analysis 112
4.5.4 Assets 113
5 SWOT Analysis of Cement industry 114
5.1 Strengths 114
5.2 Weakness 116
5.3 Opportunities 117
7
5.4 Threats 119
6 Conclusion 120
7 Recommodations 122
8 Referances 127
1. HISTORY OF THE CEMENT INDUSTRY
1.1 AT THE TIME OF INDEPENDENCE
The development of cement sector has made rapid strides, both in public and private sectors
during last two decades. The history of cement industry in Pakistan dates back to 1921 when the
first plant was established at Wah. Pakistan has come a long way since independence in 1947
when the country https://www.youtube.com/watch?v=Eh4yK1yQXcUy had inherited four
cement plants having total installed capacity of 0.5 million tons, all of which were controlled
from India. These units were located at Karachi, Rohri, Dandot and Wah. During the decade of
1948-58, the number of cement units increased to six.
1.1.1 AYUB KHAN’S ERA
During the Ayub era the economy started to grow and the construction activities underwent a
boom. In 1956 Pakistan Industrial Development Corporation (PIDC) established two plants at
Daudkel and Hyderabad and subsequently more plants were established in the private sector.
However these expansions that took place in 1956–66 could not keep pace with the economic
development and the country had to resort to imports of cement in 1976-77 and continued to do
so till 1994-95.
8
Pakistan is fortunately rich in the deposits of limestone, clay and gypsum, which constitute basic
raw materials for manufacturing of cement. In spite of having abundant raw materials and rising
growth in demand of cement, only five cement factories were established during the initial thirty
years of independence, with aggregate capacity of 3.2 million tones.
Among these units one was established in Hyderabad (Sind) in the public sector. It was called
Zeal Pak and was set up in 1956. Another unit in the public sector was known as Maple Leaf
which was established in the province of Punjab in the same year. Three units were set up during
1965-66 in the private sector. These were Javedan in Sind, Gharibwal and Mustehkam in the
province of Punjab.
1.1.2 NATIONALIZATION IN BHUTTO’S ERA
After nationalization of industries in early seventies, cement industry remained under the control
of government till late seventies. During this period, growth in demand of cement was around 7
per cent per annum, whereas new capacities were not coming up to match with the demand.
Consequently, Pakistan had to import cement for a long period, which reached to a level of 1.3
million tones in the year 1981-82. Import of cement continued from 1971 to 1985. Its scarcity
also hampered the development process in the country.
During the period of Zulfiqar Ali Bhutto all the industrial units, including cement industry, were
nationalized, therefore, no new unit was set up during 1971-77. The industry was nationalized in
1972 and the State Cement Corporation of Pakistan (SCCP) was established following the
Economic Reforms Order, 1972, and was given the responsibility to manage the production of
cement in the country.
As a result of nationalization, a total of 10 cement units with an installed capacity of 2.8 million
tones per annum were transferred to the SCCP. Effective price control was also vested with the
SCCP and for a long time the industry operated under a regime of strict regulation and price
control. While the cement industry was working under state control, the SCCP established five
new units with an installed capacity of 1.8 million tones per annum.
9
1.1.3 DE-NATIONALIZATION IN ZIA-UL-HAQ’S ERA
During the period of General Zia-ul-Haq, 1977-88, denationalization of industrial units boosted
the investments. Housing and construction industries picked up and the demand for cement
increased. Thus, the number of cement units increased from 9 to 23 and finally 24. After the
change in government in 1977, private sector was allowed to establish cement plants. As a result,
seven projects having a capacity of 2.54 million tons were installed in private sector and
simultaneously, State Cement Corporation of Pakistan also put four projects having a capacity of
1.6 million tons, enhancing the total capacity of the country to over 8.5 million tons by the end of
1990.
1.1.4 PRIVATIZATION IN NAWAZ SHARIFF’S ERA
During the regime of Nawaz Sharif the industry went through major transformation. The industry
was privatized in 1990 which led to setting up of new plants. The government embarked upon an
ambitious privatization programme and eight units were privatized. The units working under the
SCCP control are old and inefficient using 'wet process' whereas the units established in the
private sector are new, efficient and use 'dry process'. With the privatization of cement units after
1990, The SCCP lost its control over the supply of cement and controlled less than 25% of the
total installed capacity in the country which was shrinking with the establishment of more plants
in the private sector and expansion in the privatized units.
At that time there was an acute shortage of cement in the Northern areas of the country. In the
first half of nineties, Pakistan had to import cement which led to the increase in cement prices
exorbitantly making cement companies to earn very high profits. This tempted some of the
existing units like Cherat, Pakland, Dadabhoy, Ac Wah, D.G. Khan, Maple Leaf and Kohat to go
for expansion in their plants.
Simultaneously, 5 more new projects with aggregated capacity of 5 million tons came on the
stream. As such, production capacity went up to 16 million tons by the end of 2000. The five
new units in the private sector were Pioneer (Punjab) 1994, Lucky (NWFP) 1996, Askari
(NWFP) 1997, Kohat (Punjab) 1997 and Best Way (NWFP) 1998. Privatization and effective
10
price decontrol in 1991-92 heralded a new era in which the industry has reached a level where
surplus production after meeting local demand is expected in 1997.
1.1.5 GENERAL MUSHARRAF’S ERA
In the year 1999-2000 the cement industry survived from its earlier crisis of excess production
and low demand and resultant under cutting and unhealthy competition. It came out of red
because of joint strategy to tailor production to the market requirements. This helped the industry
to achieve a price level which not only covered the cost of production but also left some margin
of profit to the manufacturers. This agreed sale price was also accepted by the consumers.
The industry is again on the war-path against its own members. The dispute arose in Sept. 2000
when the government levied sales tax on the cement industry. Immediately after, however, the
government allowed 4 cement units established in the NWFP and Baluchistan extension from
payment of sales tax till June 2001.
The remaining 19 cement plants operating in Punjab and Sind who were bound to pay sale tax
amounting to about Rs. 20 per bag, could not compete with the four privileged one. These four
units Best Way, AWT Cement, Lucky Cement were allowed sales tax exemption under an SR0
issued between 1992 and 96 allowing tax exemption to all industrial units set up in NWFP &
Baluchistan. The present government allowed this exemption to only cement industries located
in these areas till June 2001.
11
1.1.6 HISTORICAL DEVELOPMENT OF CEMENT INDUSTRY
 1947(Bad era): Only four units were producing grey cement in the country.
 1948-58: The number of cement units increased to six
 1958-68(Boom era/Ayub era): The cement units increased from 6-9
 1971-77(Nationalization/Bhutto era): No new units were setup
 1977-78(Denationalization): Cement units increased from 9 to 23
 90‟s(Dark era /Cement sector had to bear massive losses): 24 units
 Current scenario: 29 players are
operating
Table: 1 Historical development of cement industry
1.1.7 ECONOMIC DEVELOPMENT
The contribution of cement industry in the economic development can be measured by the value
addition of the cement industry to Gross Domestic Product of the country, creation of
employment opportunities, receipts from exports, tax payments, and the entire revenue generated
by the cement industry. The cement industry of Pakistan is one of the major industries of
Pakistan which have an enormous impact on the economic development of the country. The
contribution of cement industry is very effective not for only the manufacturing sector but also
for the entire economic development of Pakistan. The cement industry of Pakistan was once a
very small industry but it rapidly grew with the passage of time and finally it entered in the
export market. The cement industry contributes in the Gross Domestic Product (GDP), it creates
employment opportunities for thousands of people and it creates huge revenue for the
government in the form of taxes. It directly and indirectly contributes in the economic
development of Pakistan. It also makes contribution in the development of its allies industries
12
especially the transportation sector is largely benefitted by it. The cement industry of Pakistan
attracted not only domestic investors but also foreign investors.
Figure 1
1.2 WORLD PERSPECTIVE OF CEMENT INDUSTRY
The international cement market is one of the least regulated markets on an international scale
whereas international cement trade has been growing intensively in recent decades. While the
amount of cement traded has increased, the percentage of internationally traded cement to total
cement production remains in single percent digits (5% to 7%). This means that most of cement
production exists to satisfy local consumption.
The problem this research will explore is identifying the most critical factors required to regulate
the growing market for international cement. Initial fact finding suggests that cement production
has recently been concentrating in the developing world (Miller, 2009). Such increasing
production of a capital-intensive (labor-saving) industry means that the impact the cement
market is having on the local labor markets is low compared to the impact it is having on the
capital market. Even though economic rents are considerable, cement is one of the most polluting
industries: 5% of the world‟s total emission of greenhouse gases is caused by cement production
(Loreti, 2015). This means that the developing world is increasingly baring the environmental
burden.
13
Any solution suggested to the problems caused by the cement industry has to be composed of
three crucial elements. First, it must be implemented on an international scale. Local solutions
cannot solve the problem. The environmental impact of burning fuel necessary to produce
cement in China, if uncontrolled, will lead to global warming because of the emission of
greenhouse gases caused by the burning. The impact of global warming however is not limited to
China alone but may have an extended impact on countries even as far away as South Africa.
Second, the developed world has to create an incentives system that does not shift all production
to areas that are less regulated. While it is desirable for European and North American countries
to achieve green economies by closing down cement factories or enacting strict environmental
regulations, it is a major problem when such cement production is only shifted to countries with
looser environmental regulations (Miller, 2009). Third, corruption and hidden transaction costs
within developing nations exacerbate the problem. Whether it is the lack of strong environmental
regulations or weakly implemented competition laws, developing countries can be a haven for
poor environmental control and strong cartels especially in a very high fixed cost industry such
as cement (Mishkin, 2014 and Selim, 2009). Any solution that does not contain these three
elements should be considered lacking.
The growing production of cement calls on all countries and NGOs to begin seriously
considering a global policy to solve the problems posed by this industry. An effective global
policy can only be found if different actors cooperate. Being a capital-intensive industry that
utilizes scarce resources to operate (such as fuel) means that governments need to keep some sort
of an eye on production. Even though cement is locally produced the impact of the production is
global and the presence of lucrative opportunities to shift production sites makes the industry an
attractive one for governmental regulation. It is this interaction between the economic
(efficiency) and the political (institutional) that calls for finding a framework for evaluating
solutions that takes into account both ends.
1.2.1 WTO’S REGULATIONS AND ITS ECONOMIC IMPACT
Pakistan was one of the WTO‟s members when it was established in 1995. There is a
considerable impact of WTO on all sectors of Pakistan's economy. Pakistan‟s domestic industry
faces problems of increased imports and unfair practices under the global trade regime. Pakistan
through national legislation has come up with anti-dumping laws against dumping,
14
countervailing duties laws against subsidies and safeguard action laws against surge of imports
in order to protect its domestic industry.
1.2.2 DUMPING
A product is considered dumped if the export price is less than the price charged for the like
product in the exporting country. Thus, one identifies dumping simply by comparing prices in
two markets.
Anti-Dumping Duties Ordinance 2000
Pakistan through Anti-dumping Ordinance, 2000 has repealed the Import of Goods Ordinance,
1983 and has given effect to WTO provisions relating to imposition of anti-dumping duties in
order to offset dumping. This Ordinance has also provided a framework for investigation and
determination of dumping and injury in respect of goods imported into Pakistan. The rules made
by Pakistan in this regard are Anti-Dumping Duties Rules, 2001.
Agreement on Anti-Dumping
The Agreement on Anti-dumping elaborates the provisions of Article VI of GATT 1994. The
GATT provides the right to the contracting parties to apply anti-dumping measures i.e. measures
against imports of a product at an export price below its “normal value”, if such dumped imports
caused injury to a domestic industry in the territory of the import contracting party.
1.2.3 SUBSIDY
Subsidy contains three basic elements:
 A financial contribution
 By a government or any public body within territory of a WTO Member
 Which confers a benefit?
All three of these elements must be satisfied in order for a subsidy to exist
1.2.4 COUNTERVAILING DUTIES ORDINANCES, 2000
15
The basic aim of these provisions is either to prohibit or to restrain the use of subsidies by a
WTO Member that affects the interests of other Members. However, the rules permit the
importing country to take remedial measures, which could take the form of countervailing duties
on subsidized imports. Pakistan through Countervailing Duties Ordinance, 2000 has given effect
to WTO provisions relating to imposition of countervailing duties to offset such subsidies. This
has been done by providing a framework for investigation and determination of such subsidies
and injury in respect of goods imported into Pakistan. The rules made by Pakistan in this regard
are Countervailing Duties Rules, 2002.
1.2.5 AGREEMENT ON SUBSIDIES AND COUNTERVAILING MEASURES
The Uruguay Round Agreement on Subsidies and Countervailing Measures (SCM) lays down
rules on the subsidies for industrial products and on countervailing duties to counteract the
effects of subsidies. Subsidies are divided into three categories; prohibited subsidies, actionable
subsidies and non-actionable subsidies. Export subsidies and those contingents on the use of
domestic as opposed to imported products are categorized as prohibited subsidies. However,
least developed countries (LDC‟s) and developing countries with per capita income of less than $
1,000 are exempt from this restriction and may use prohibited subsidies. Non-actionable
subsidies include those for research and development, for backward regions and for
environmental regions. All the remaining subsidies are actionable subsidies.
1.2.6 SAFEGUARD ACTIONS
Safeguard measures are defined as "emergency" actions with respect to increased imports of
particular products, where such imports have caused or threaten to cause serious injury to the
importing Member's domestic industry.
Safeguard Measures Ordinance of 2002
 Pakistan through Safeguard Measures Ordinance, 2002 has given effect to the provisions
of Article XIX of the General Agreement on Tariffs and Trade, 1994, and to the WTO
Agreement on Safeguards for the imposition of safeguard measures. This has been done
by providing a framework for investigation and determination of serious injury or threat
16
of serious injury caused by products imported into Pakistan. The rules made by Pakistan
in this regard are Safeguard Measures Rules, 2003.
Agreement on Safeguards
 Whereas the agreements on anti-dumping and SCM provide remedies for domestic
producers if they are hurt by unfair imports, the Agreement on Safeguards provides
remedies for domestic producers injured by fairly traded imports. It allows the use of
temporary protective measures but sets rules to guard against the abuse of such measures.
Regulations of the other international treaties
 There was increasing pressure from international governing bodies, such as the ILO and
WTO and other organizations like the International Confederation of Free Trade Unions
(ICFTU), with regard to the issues of labour rights, the role of unions and labour
standards involving the Therefore, it is crucial for both the international community and
the Pakistanis people to seek a more informed perspective on the current situation and the
future engagement of the Pakistanis economy into the global economic system, as well as
Pakistan‟s future economic and political reforms.
1.2.7 ECONOMIC IMPACT OF WTO ON CEMENT INDUSTRY PAKISTAN
Pakistan follow must follow the role of WTO. Before WTO agreement there was a serious
disconnect between the needs of the industry and the availability of special skills suited to the
needs of the industry. There was no data available so that the industry could match the needs and
the skills available in the domestic manpower market. It was also pointed out that the existing
number of technical and vocational centers had been languishing for the past several years.
These were usually run and managed by the Provincial the Governments while the provincial the
Governments do not.
17
Industries that have recently developed and have become capable of competing with foreign
firms are more likely to meet the challenge of increased Changing patterns of HRM in Pakistan
trade and undergo restructuring to consolidate their businesses and become more competitive.
The demand of Pakistani cement is expected to continue to grow at the rate of 20 per cent for
about Four years to come. It may then follow traditional growth rate of seven per cent per year.
Announcement of major dams will dramatically increase this demand. Deregulation after
accession of Pakistan to WTO is expected to open the window of competition from cheaper
markets. There may be no tariff after this deregulation on import of cement allowing its entry
into Pakistan from cheaper market at lower rate. Cement from cheaper markets may also block
Pakistan‟s export of cement to its neighboring countries.
WTO regime will have no negative impact on the operation of the cement sector. On the other
hand it is felt that WTO might offer opportunities for exporting cement/clinker to the
neighboring countries.
Pakistan is a signatory to the WTO and cannot keep its eyes shut to the realities. What Pakistan
needs to do is to make the best of a given situation and try and develop a strategy to get
maximum benefit from globalization and WTO.
• The local industry now cannot be protected with the use of quotas or very high tariffs.
The government needs to build a very strong network of Anti-dumping and countervailing duties
to protect the local industry against the onslaught of unfair foreign competition.
• The developing countries including Pakistan face problems in hiring law firms to advice
on WTO related issues, which is a constraining factor in seeking relief from Dispute Settlement
Body (DSU). This underscores the need to train local lawyers with WTO expertise.
• Our survival lies in enhancing credibility through adoption of international quality
standards, but Pakistan has a long way to go in obtaining certification of ISO‟s and other
18
standards. A proper policy is required in this direction which should involve both public and
private quarters to address this issue.
• Special policies are needed for sectors which are working under deletion program such as
automobiles and engineering goods so that they could become efficient in shortest possible time.
1.2.8 TYPES OF CEMENT PRODUCED WORLDWIDE
Cements that are used for construction are divided into two main categories based on cement
properties, hydraulic or non-hydraulic. Although only certain types of cement are commonly
utilized today, there are several different types of cement that can be created. Various types of
cement are possible by blending different proportions of gypsum, clinker, and other additives
together.
Non-Hydraulic Cement
Non-hydraulic cement is cement which cannot harden while in contact with water, as compared
to hydraulic cement which can. When non-hydraulic cement is utilized in construction, it must be
kept dry so that it will hold the structure. Due to the difficulties related with waiting long periods
for drying, non-hydraulic cement is rarely used in current market.
Hydraulic Cement
Hydraulic cements are cements that have the ability to set and harden after being combined with
water. Hydraulic cement is made mainly from limestone, certain clay minerals, and gypsum,
which are burned together in a high temperature. Hydraulic cement is the main cement utilized in
modern day construction.
1.3 TYPES OF CEMENT AVAILABLE IN INTERNATIONAL MARKET
1. Portland cement
2. Portland cement blend
3. Portland Blast furnace Cement
4. Portland Fly ash Cement
5. Portland Pozzolan Cement
6. Portland Silica Fume cement
19
7. Masonry Cement
8. Expansive Cement
9. White blended cement
10. Colored cement
11. Very finely ground cement
12. Pozzolan-lime cement
13. Slag-lime cement
14. Super sulfated cements
15. Calcium aluminate cements
16. Calcium sulfoaluminate cements
17. Natural Cements
18. Geopolymer cements
19. Sulphate resistance cement
1.2.8.1 TYPES OF CEMENT PRODUCED IN PAKISTAN
Cement industry is indeed a highly important segment of industrial sector that plays a vital role in the
socio-economic development. Since cement is a specialized product, requiring sophisticated
infrastructure and production location. Mostly of the cement companies in Pakistan are located
near mountainous regions that are rich in clay, iron and mineral capacity. Cement industries in
Pakistan are currently operating at their maximum capacity due to the boom in commercial and
industrial construction within Pakistan. Although a large number of cement varieties are
produced in different countries of the world, Pakistan has been producing following types of
cement.
1. Ordinary Portland cement
2. Portland Blast Furnace Slag Cement
3. Sulphate Resisting Cement
4. White Cement
20
1. Portland cement
It is the most popular type of cement, formerly known as Ordinary Portland
Cement (OPC), CEM I. It is the cement that has been most commonly used
throughout the world in building works.
Figure 2: OPC
2. Portland blast furnace slag cement
The Slag Cement of the Portland Blast Furnace is a type of cement that is
hydraulic and is manufactured in a blast furnace. The manufacture of
Portland Blast Furnace Slag Cement requires 75% less energy than that for
the production of the Portland cement. The low cost of production of
Portland Blast Furnace Slag Cement makes it cheaper than Portland cement.
It is for this reason that in recent years, the sales of Portland Blast Furnace
Slag Cement have increased. Figure 3: Slag Cement
3. Sulphate Resistance
SRPC is a special type of CEM I cement. However, it is not the only
sulphate-resisting cement available; various factory-made composite cements
are also sulphate-resisting. SRC is specially used in sea and coastal areas as
it offers greater resistance to chemical attack from sulphate and dissolved
salts and alkalies present in sea and saline waters.
Figure 4: SRPC
4. White Cement
21
White Portland cement is a unique kind of Portland cement. It is different from ordinary Portland
cement. It is of white color, instead of a dull grey one. White cement is frequently chosen by
architects for use in white, off-white or coloured concretes that will be exposed, inside or outside
buildings, to the public's gaze.
Figure 5: White Cement
CEMENT INDUSTRY CONTRIBUTION IN GDP
 Cement contribution in GDP is 3.5%
 Exported last year 700 million USD (47% increaed)
 Pakistan has ranked 5th position in world exporter of cement
 Total companies 23, 4 forigen and 3 controlled by armed forces 19 are listed in stock
exchange
Comparison of the industrial sector with other countries
Demands Growth VS GDP Growth:
 GDP growth is used as yardstick for measuring demand growth of cement. In its
simplest form, the theory suggests, a strong positive correlation between GDP
0%
10%
20%
30%
contribution
of industries
GDP growth
Pakistan
India
Bandladesh
srilanka
22
growth rate and Cement demand growth. High GDP growth leads to high cement
consumption. The reverse is true when GDP growth declines. It is believed that
cement consumption increases along with the rise in per capita income. Cement
consumption is also reflective of the economic development achieved by a
country.
Developments in the sector:
Expansion of existing capacities is in the shape of plant up gradation or setting up new
production lines, is talk of the town these days. With its roots fixed on the ground of prospective
demand growth in the years to come, expansion is what almost all cement manufacturers are
pursuing. Annual production capacity has reached 25 million tons by June 2013 against
capacity of 18.6m tons per annum in June 2012. If all the expansion plans are materializes,
capacity is likely to touch 28m tons by the June 2014 & subsequently it would reach 35.7m tons
in 2015. Most of the new projects or expansions are concentrated in northern region, which
already captures around 77% capacity in total industry. Against 14.3m tons per annum current
capacity out of total capacity, northern region‟s capacity may jump sharply to 20.7m tons per
annum by 2013. While, capacity of south region is expected to reach 7.0 tons per annum against
current capacity which is 4.25m tons per annum.
23
The bothersome fact lies on the other side of coin, that is, demand. A Big question that kills all
the joy of expansion is “Will there be enough demand in the country to absorb the excess
supply?” or putting it in other words “Will the recent spurt in cement demand will be sustained
over the period of time?”
Current stance of the cement sector:
After completion of major expansion plans in Pakistan in 2014, there would be a surplus
to export in regional markets particularly to China, India and Afghanistan, however in the
same period Iran would also be able to approach vigorously these markets as its most of
the cement plant will start to come online.
Iran would get benefit in terms of price as cement prices in Iran is among the cheapest in
the world as the price of cement in Iran remained in range of $20-$25 per ton. On the
other hand it is expected that being the US ally, Pakistan would get most of the favor in
order to keep its market share in these markets given the fact that all the construction
activities in Iraq and Afghanistan would be taken by US.
1.3 TOTAL EMPLOYMENT
24
The company in cement sector takes their people as one of the most valuable assets, they view their
human resource as the competitive advantage therefore they ensure that they employ only those people
who are self-motivated and professionally qualified. They also take into consideration that their business
goal are realized through such diverse work force providing equal opportunities without any
discrimination on the basis of cast, creed, gender and religion.
Cement industry is also serving the nation by providing job opportunities and presently more
than 150,000 persons are employed directly or indirectly by the industry.
1.4 CHALLENGES AND ISSUES AND THEIR SOLUTIONS
Key issues in the economy that impact cement industry
 The Pakistani currency has been depreciating. This has caused a greater problem to the
industries who have taken loans in the foreign exchange currencies.
25
 According to the federal bureau of statistics, Pakistan hit record inflation during 2015.
The SBP, in order to control the inflation, tightened the monetary policies by increasing
the interest rates. The increase in the interest rates made the industries pay more interest
against the long term loans that they had borrowed at lower interest rates.
 The investors in the cement sector are well aware of the importance of technology in the
present day and they realize the returns they can get using advance technologies. The
cement factories such as D.G. cement, lucky cement and may other factories is using
latest technologies. However, the old cement industries such as maple leaf are now
shifting towards the new technology as well.
 Main component of the cost is fuel. Pakistan's cement industry has converted their plants
to coal considering it to be the cheapest fuel, but its price in international markets has
gone up by more than 300 percent in the last one year, which directly relate increasing
the cost of Production.
Certain factors that affect the growth of cement industry are as follows:
 Slow construction activities in the country badly upsets domestic sale of cement.
 Higher GDP growth has positive impact on cement demand.
 Reconstruction work in result of earthquake boosts construction material demand
 Four large Dams (Bhasha Daimer Dam, Munda Dam, Akhori Dam and Neelum Jhelum)
are announced by government. Construction of these dams will generate demand of 3.7
million tons.
Proposed solution
 Federal Excise Duty and GST over Cement industry should be reduced. It‟s being treated
as a luxury item for the purpose of taxes and duties.
 The local cement industry faces high fuel costs. The government has given incentives in
order to facilitate their conversion to coal, which is widely available in the country.
 High Freight charges should be reduced as it‟s affecting negatively the domestic demand
of cement.
 Government of Pakistan should stress on factors that increase the GDP
 Government of Pakistan should do its upmost to control the instability in the country.
26
 Government of Pakistan should provide infrastructure to the cement industry to setup
new factories
 Government of Pakistan should provide incentives to the cement industry so that they can
import new plants.
Impact of political parties on the cement industry
 Low domestic cement demand in the country is due to the political uncertainty.
 The political stability in pakistan is at unrest. Due to this, the cement factories are facing
problems regarding the investments they have made.
 The stock market has shown sheer down fall since the political unrest. Although the
market share index showed improvement after the resignation of pervez musharraf on
18th of august. But still the failure to restore the judges on time and many other issues
has made the share index to slope downward once again.
Key hurdles in marketing
 Since cement is a specialized product, requiring sophisticated infrastructure and
production location. So, most of the cement industries in Pakistan are located near/within
mountainous regions that are rich in clay, iron and mineral capacity. Structure of Cement
industry in Pakistan is as such that there is not much substitutability to buyers. Which
shows that the Cross elasticity of demand is negligible.
 Consumers face a tough decision with regards to prefer which brand over which because
of the similar pricing of cement industry.
 A price war was witnessed which ended up with no conqueror. Similar apprehensions
exist for the future. Any hurdle in the growth of cement demand may force the sector into
the price war. Yet, we expect cement manufacturers to act wise and learn lesson from the
history. Any mistake, similar to the one made in the last decade, will again drive the
sector into the era where all are losers with no winner.
27
 Containers are used for transportation purposes and even trains when cement is required
urgently from north to south or vice versa. As for exports, ships are launched from ports
but the cost of transportation faced by firms is so high that at maximum they can reach
till South Africa for exports and the price gets out of budget when the ship reaches USA
 Not much of innovation is possible in this industry. Intense rivalry can make it difficult
for smaller firms to survive.
 Firms cannot compromise much on the prices. It is hardly possible for any firm to get an
edge due to price.
Proposed solution
 Measures should be taken to insure that the customers are not exploited by the cement
industry.
 Cement industry should enter into long term contracts with cement transporters to gain
discounts and seek reduced transport prices.
 Cement industry can enter in to contracts with international logistics transportation
companies such as Mersk to export cement to USA in huge volumes at low cost
 When the big companies are forming an association, small manufactures should be also
considered as otherwise they would go out of business.
Availability of finance
Cement plant is a highly capital intensive business which requires a lot of investment which only
a Giant company or Group can afford. In old times, when cement plants were established,
comparatively less investment was required. There were also banks, banker‟s equity etc that
provided loans easily. Now only self financing exists which a bank provides and they sees the
feasibility of the project.
A new plant should be established after wide market research in an industry where the capacity is
already in surplus. This could be possible only if production cost is targeted. The old cement
plants were not established keeping in mind the production cost. Nowadays about 70% cost
constitutes the energy cost. If a company focuses on lowering the energy cost, making efficient
28
use of technologically advanced machinery then the production cost would apparently be low.
There is always a potential for such plants.
Types of loans provided to the industry
Short term loans:
Short term loans are obtained against the current assets of the company. When the company
requires a short term loan it sends a request for the loan to the bank. The banks or other
financiers put down their facilities in a term sheet against which they can provide the loan to the
company.
Long term Loans:
The long term loans are obtained against the fixed assets of the company. These assets must be
insured by the insurance company. This is the basic requirement for the bank. When the
company requires a huge amount of loan it contacts to the bank for the loan. The bank than
forms a group with other banks in order to arrange the amount. A finance agreement is signed by
both the parties and the loan is given under the agreed terms and conditions.
Trade issues
 Import policy regarding construction equipment is not reorganized.
 Trade policy does not facilitate contractors.
 Regulatory framework discourages international contractors/consultants.
 Shortage of Electricity or power break down is a major constraint as the frequent
restoring to load shedding is causing an adverse effect on the trade and industry.
 Duties on import of Fuel
 Strict procedures for registration of contractors by Pakistan Engineering Council (PEC).
29
 Audit should play a positive role.
Proposed solutions
 Custom duty over the import of pet coke should be withdrawn as its‟ negatively affects
the cement industry.
Key human resource issues in cement industry
 Shortage of qualified and skilled manpower at all levels is an important issue.
 Another issue is lack of training facilities for the development of required human
resources.
 Human resource policies of clients, contractors and consultants need improvement.
 Fully skilled and semi skilled workers in search of opportunities have gone to the Middle
East and other foreign countries.
 Some contractors and consultants lack professional management.
 Inadequate research and development.
 Limit use of IT in industry.
Proposed solutions
 Availability of qualified and skilled manpower should be given priority by government
 The training facilities should be developed at fast track.
 Foreign and local experts should be hired to do the research and development.
 Proper workshops that are held under the supervision of experts so that the practical
knowledge is properly imparted to the labor.
 The cement industry can use reward and bonuses to increase the motivational and
performance level of the labor force.
 Better machinery and management should be used to become cost efficient and become
competitive.
30
2. MARKET SHARE OF THE FIRMS IN CEMENT
INDUSTRY
The market share of the cement company‟s in Pakistan is as follows:
Figure 6: market share of cement in Pakistan
Cement Company Market Share (%)
Kohat cement 6
Maple leaf 7
Askari cement 11
DG cement 13
Bestway cement 12
Lucky cement 16
31
Chart 1: market shares of firms in cement industry
PROFILES OF SELECTED CEMENT COMPANIES
There are three major players in the Cement industry of Pakistan Lucky Cement, D.G. Khan Cement and
best way cement. According to the market share of 2015 lucky Cement occupy 18%, D.G. Khan 13% and
Best way Cement 12%
2.1 PIONEER CEMENT LIMITED
PHILOSOPHY:
The Management of Pioneer Cement Limited is committed to maintaining this quality policy at
all levels of the company. For this, as well as to achieve our corporate objectives, we all shall
work as a team and pursue continuous improvement.
INCORPORATION:
Others 35
32
Pioneer Cement Limited (PCL) was incorporated in Pakistan as a public company limited by
shares on February 09, 1986. Its shares are quoted on all stock exchanges in Pakistan. The
principal activity of the Company is manufacturing and sale of cement.
PAID-UP CAPITAL/EQUITY
Paid up Capital 199.5 million shares of Rs.
10/= each
1,995
Shareholders’ Equity 2,401
VISION AND MISSION
Pioneer Cement Limited is committed to make sustained efforts towards optimum utilization of
its resources through good corporate governance for serving the interests of all its stakeholders.
CORPORATE INFORMATION
Company Name PIONEER CEMENT COMPANY
LIMITED.
Legal Status Public Limited Company
33
COMPANY’S PROFILE
BOARD OF DIRECTORS
Chairman
Mr. Manzoor Hayat Noon
Managing Director & CEO
Mr. Javed Ali Khan
Directors
Mr. Aly Khan
Mr. Nadir Rahman
Mr. William Gordon Rodgers
Mr. Wajahat A. Baqai (NBP)
Mr. Rafique Dawood (FDIB)
Mr. Cevdet DAL
Mr. Etrat Hussain Rizvi
Mr. Saleem Shahzada
AUDIT COMMITTEE
Chairman
Mr. Rafique Dawood (FDIB)
Members
Mr. Aly Khan
Mr. William Gordon Rodgers
Mr. Etrat Hussain Rizvi
Mr. Wajahat A. Baqai (NBP)
CHIEF FINANCIAL OFFICER
Mr. Muhammad Saleem
COMPANY SECRETARY
Syed Anwar Ali
CHIEF INTERNAL AUDITOR
Mr. Muhammad Zafar Qidwai
STATUTORY AUDITORS
Ford Rhodes Sidat Hyder & Co.
COST AUDITORS
Siddiqui & Co.
LEGAL ADVISORS
Hassan & Hassan
Sayeed & Sayeed
BANKS
The Bank of Punjab
National Bank of Pakistan
Bank Islami Pakistan Limited
Meezan Bank Limited
The Royal Bank of Scotland
Askari Commercial Bank Limited
Bank Al-Habib Limited
Habib Bank Limited
United Bank Limited
34
2.2 CHERAT CEMENT
History:
Before 1981 there was an association who created MONOPOLY in the cement sector because of
no close competitor in such industry. So to break that association and to offer cement to The public
Cherat Cement factory was founded.
Cherat cement is not only one of the best qualities cements in Pakistan, but in the entire region
because of its natural favor "the limestone" which is one of the best quality reserve in the world.
Cherat Cement Company limited is one of the largest companies of Ghulam Faruque group. Cherat
Cement Company was incorporated at Karachi on May 25, 1981 as a public limited company and
the certificate of commencement of business was obtained from the register of joint stock
companies Karachi on July 8, 1998.
Land of about 2219 canals and 4 Marias were obtained on lease from the government of NWFP.
Mining concession over an area of 10378.54 acres was obtained from the government of NWFP.
The foundation stone of Cherat Cement Company was laid on 1st
January 1982 by the then
president of Pakistan General Zia Ul Haq. It is situated at the foothills of Cherat cement near
Lakarai village at distance of about 40 kilometer from Peshawar city. It started its production on
10n
January 1985 after its inauguration by the governor of NWFP Lt. Gen. Fazl-e-Haq. The plant
was built by a French firm named Creuot Loire to enterprises abbreviated as CLE. It was the first
cement factory in private sector. Due to its importance the government of NWFP built road and
power lines for the factory.
The factory had the capacity to produce 1460 tons of cement per day but after plant expansion in
1993-94 its production capacity has increased to 2400 tons per day.
The plant expansion was completed in October 1994. But the recent production of the factory is
3300 tons per day.
35
Quality Policy:
We want Cherat Cement Company to be regarded by our customer and our employees as the best
and the most profitable organization in the market we serve.
We seek innovation and improvement in every part of our business, through a system of ideas,
suggestions, feedback and application.
Every member of Cherat Cement Company Limited continuously perceives quality improvement
through procedures, designed to provide the knowledge and skills needed to achieve the goal of
our quality policy in line with customer requirements and by adhering to applicable statutory and
regulatory requirements related to product.
The Company Slogan:
"BIND YOUR BRICKS"
ISO 9002 Certification:
SO 9002 is a quality assurance model made up of quality system requirements. This model applies
to the organizations that produce, install, and service products. ISO expects organizations to apply
this model, ad to meet these requirements by developing a quality system. Cherat Cement
Company is an ISO 9002 certified company and follows sections on management and contract
review requirements etc.
Expansion of the Plant:
The factory had the capacity to produce 1460 tons of cement per day but after plant expansion in
1993-94 its production capacity has increased to 2500 tons per day. The plant expansion was
completed in October 1994. Now the plant produces 3400 tons per day. And lucky cement is the
market leader because it produces 6000 tons per day.
36
Board of Directors:
Muhammad Faruque Chairman
Mr. Azam Faruque Chief Executive
Mr. Akbarali Peshni Director
Mr. Muhammad Nawaz Tishni (NIT) Nominee Director
Mr. Iftikhar Ahmad Bashir (NIT) Nominee Director
Mr. Javid Anwar (NIT) Nominee Director
2.3 KOHAT CEMENT COMPANT LIMITED
HISTORY OF KCCL
KCCL was incorporated as a State Cement unit with an installed capacity of 800-
900 tons/day and the cost of installation was about 718,900 million. At start there
were 250 officers and 1000 workers for the operation of business. It is situated in
the southwest of the Kohat city near Babri Banda on the Rawalpindi road. Its
distance from the Kohat city is about 12 kms (Kilometers) and its distance from
the other cities of Pakistan is i.e. 64 kms from Peshawar, 142 kms from Bannu,
165 kms from Rawalpindi and Islamabad etc. Its total height above the sea level is
about 450 meters. The total area bound by the KCCL is about 164 acres i.e. 656
kanals and this enclosed area consists of the factory plant, hill, colony, hospital,
school, mosque, playground, hostel for single workers, club and community hall
for the refreshment of employees, railway siding and also the leading road to the
main road.
37
For the operation of business the first machinery was imported from Romania in
the month of April 1978 and in Pakistan only KCCL has the Romanian
machinery. KCCL was incorporated on 30th
April 1980 under the companies‟ act
1913 and now the act has changed to Companies Ordinance 1984. Lt. Gen. Saeed
Qadir, minister of production, on 30th
June 1983, performed the opening
ceremony. The first commercial production of the KCCL was started on 1st
October 1984.
As the total outlay of the company was 718,900 million and its registered
authorized capital was 200 million. In the early stages, the shares of worth 188
million were floated in the capital market. The first Board of Directors of the
KCCL were; MR. Zaheer Sajjad (Chairman), MR.M. Saleem (Director/ GM),
MR. Mushtaq Hussain (Director), MR. Ghulam Murtaza (Director) and MR. Fida
Hussain (Director). The first Secretary of the company was MR. Fazal Karim
(GM Finance). During the first year of inauguration KCCL earned a net profit of
3 million.
In early days, company faced the problems like: delay in the supply of equipment,
defective supply of equipment as well as problems with the technical services but
the Pakistani engineers and the management of those days overcome the problems
efficiently.
a- Privatization of KCCL
Being working under the State Cement Corporation of Pakistan, KCCL was
privatizing by the Privatization Commission of Pakistan after nine years i.e. it was
privatized on October 31st
1992 in the Government of Main Muhammad Nawaz
Sharif. Privatization was followed through an open auction.
Atta Muhammad Sheikh, who has a prominent name in the business society, made
the highest bid and purchased the 90 percent shares of the company,. The partial
amount of the bid was 520 million and 300 million were paid to the State Cement
Corporation of Pakistan and hence, the total amount of the bid was 820 million.
38
The company started its operation under the new management team and showed a
great efficiency. However, company suffered the loss in 1993 because of large
amount deducted as taxes but the new management made the tremendous efforts
to overcome the loss.
b- KCCL Achievements after Privatization
After Privatization, the new management team performed a vital role in the
growth of the company. In present the authorized capital of the company has been
extended up to 1000 million and plans to increase the authorized capital to 1500
million by changing the Memorandum and Articles of Association of the
company to reflect the increase in the authorized share capital of the company.
c- Mission Statement
 Our customer with quality cement at competitive pricing
 Our share holders with good returns and sustainable growth
 Our employee with care and career development opportunities.
d- Vision Statement
 Be the best in the eyes of all stake holders
e- Company Background
Kohat Cement Company Limited (incorporated in 1980) is an ISO 9001-2015
certified company, listed on Stock Exchanges of Pakistan and engaged in
manufacturing of Grey and White Cements. Quality of our products is better than
approved British and Pakistan Standards.
Company Registration Number & National Tax Number
1: Company Registration Number CUIN: 0007693
39
2: National Tax Number 1758919-3
Board of Directors
Mr. Aizaz Mansoor Sheikh Chief Executive
Mr. Nadeem Atta Sheikh Director
Mrs. Ghazala Amjad Director
Mr. Omer Aizaz Sheikh Director
Mr. Muhammad Atta Tanseer Sheikh Director
Membership of industry associations and trade bodies
1. APCMA (All Pakistan Cement Manufacturer Association)
2. LCCI (Lahore Chamber of Commerce and Industry)
3. KPCCI (Khyber Pakhtunkhwa Chamber of Commerce and Industry)
6. Employers Federation of Pakistan
2.3 TRADE UNION OF CEMENT INDUSTRY
All PAKISTAN CEMENT MANUFACTURERS ASSOCIATION (APCMA)
YEAR OF FORMATION
APCMA is the collective voice of all the cement manufacturers
of Pakistan. It is registered under Trade Organization
Ordinance 2014. It was established on 14th of September 1992
under the Companies Ordinance 1984.
Figure 7
LOCATION OF HEAD OFFICE AND PRINCIPAL OFFICES OF APCMA
location of head office and other office of APCMA
Offices  Lahore (Head office)
 Karachi
Figure 8
40
KEY RESPONSIBILITIES OF APCMA
1. To create an understanding amongst the private sector cement manufacturers of Pakistan
for the following purpose :
a. To increase the production of cement
b. To improve the quality of cement produced and to increase exports
c. To avoid undercutting in the sales price
d. To create healthy circumstances for production and sales of cement.
2. To protect, safeguard and promote the interest of its members
3. To help coordination and ensuring co-operation amongst its members to attain primary
objectives.
4. To identify and strengthen industry‟s role in the economic development of the country
5. To help and solve all the problems either faced by the cement manufacturers as a whole
or by individual cement manufacturers
6. Provides up-to-date statistical data/information to the industry and other agencies
7. To make representations to the government or other authorities for and on the behalf of
cement manufacturers in general and the trade in particular
8. To convene when necessary conferences and seminars at such times and such places as
may be determined for the promotion of cement industry in Pakistan.
9. Focuses infrastructural problems (Rail, Coal, Power, etc) and suggests suitable measures
for their solution.
10. Interacts for Industry's problems with the Government and co-ordinates various activities
with other bodies.
REGULAR EVENTS OF APCMA
 Annual elections
The elections for the management and President are held every year in which 80%
participation of the members is mandatory.
 Annual General Meeting
41
The General Meeting of the association is held annually at the head office of APCMA in
Karachi. The meeting is presided by the Chairman APCMA and upcoming issues , yearly
progress, The Announcement of final result of election of members of executive
committee and office bearers and Approval of annual audited accounts of APCMA.
FAILURE OF APCMA
Price war was started in 2013 which was resulted due to market saturation by major cement plant
expansion. DGKK was the first player to destabilize the established industry, set prices in order
to transfer its excess production capacity
On 21st
Feb, 2014 the govt. has given one week deadline to APCMA to bring down the
unjustified cement prices or face action including ban on export. The government of Pakistan
held a detailed inquiry and ordered All-Pakistan Cement Manufacturers Association (APCMA)
to increase production and reduce the price of cement to its original level.
APCMA Expected the yearly sale to grow by five per cent however total dispatches had
increased by an insufficient two per cent in 2015-09.
Competition authorities in Pakistan fined about $77 million on 20 cement companies found
guilty of operating as a cartel and raising prices under mutual agreement.
ACHIEVEMENTS OF APCMA
 Took measures to bring prices to normal levels on in 2013
 Suspend export of cement from the 6th
April 2013 to 30th
April 2013, which resulted in
the availability of additional 200,000 tons of cement in the domestic market
 Increased the capacity utilization from 86% to 92 % of total installed capacity, which
brought an additional 91,000 tons of cement every month.
Reduction in excise duty by Rs 10 per bag which enabled stability in cement prices this year
(2009)
3 FINANCIAL ANALYSIS
Financial Analysis is the summary of all transactions that have occurred over a particular period.
42
Financial Analysis refers to the assessment of a business to deal with the planning, budgeting,
monitoring, forecasting, and improving of all financial details within an organization.
These indicate a firm's financial health and stability.
Two key financial statements are:
BALANCE SHEET
 A balance sheet or statement of financial position is a summary of the financial balances
of a sole proprietorship, a business partnership or a company. Assets, liabilities and
ownership equity are listed as of a specific date, such as the end of its financial year. A
balance sheet is often described as a "snapshot of a company's financial condition”. Of
the four basic financial statements, the balance sheet is the only statement which applies
to a single point in time of a business' calendar year.
 A standard company balance sheet has three parts: assets, liabilities and ownership
equity. The main categories of assets are usually listed first and typically in order of
liquidity. Assets are followed by the liabilities. The difference between the assets and the
liabilities is known as equity or the net assets or the net worth or capital of the company
and according to the accounting equation, net worth must equal assets minus liabilities.
INCOME STATEMENT
Income statement (also referred as profit and loss statement (P&L), statement of financial
performance, earnings statement, operating statement or statement of operations)
 Is a company's financial statement that indicates how the revenue (money received from
the sale of products and services before expenses are taken out, also known as the "top
line") is transformed into the net income (the result after all revenues and expenses have
been accounted for, also known as the "bottom line"). It displays the revenues recognized
for a specific period, and the cost and expenses charged against these revenues, including
write-offs (e.g., depreciation and amortization of various assets) and taxes.
43
 The purpose of the income statement is to show managers and investors whether the
company made or lost money during the period being reported.
 The important thing to remember about an income statement is that it represents a period
of time. This contrasts with the balance sheet, which represents a single moment in time
Horizontal Analysis
The analysis is based on a year-to-year comparison of a firm's ratios,
Vertical Analysis
The comparison of Balance Sheet accounts either using ratios or not, to get useful information
and draw useful conclusions
RATIO ANALYSIS:
A comparison of relationship among account balances.
FINANCIAL RATIOS
Financial Ratios are helpful in analyzing the actual performance of the company compared to its
financial objectives. They also provide insights into the firm‟s performance compared to other
firms in the industry. Ratio simply means one number expressed in term of another. A ratio is a
statistical yardstick by means of which relationship between two or various figures can be
compared or measured. The term accounting ratio is used to describe significant relationship
between figures shown on a balance sheet, profit and loss account or in any other part of
accounting organization. Accounting ratio thus shows the relationship between the accounting
data.
ACCOUNTING RATIOS
The term "accounting ratios" is used to describe significant relationship between figures shown
on a balance sheet, in a profit and loss account, in a budgetary control system or in any other part
of accounting organization. Accounting ratios thus shows the relationship between accounting
44
data. Ratios can be found out by dividing one number by another number. Ratios show how one
number is related to another. It may be expressed in the form of co-efficient, percentage,
proportion, or rate.
ADVANTAGES OF RATIOS ANALYSIS
Ratio analysis is an important and age-old technique of financial analysis. The following are
some of the advantages of ratio analysis:
SIMPLIFIES FINANCIAL STATEMENTS
It simplifies the comprehension of financial statements. Ratios tell the whole story of changes in
the financial condition of the business.
INTER PERIOD COMPARISON
It provide data for inter period comparison.
FACILITATES INTER-FIRM COMPARISON
It provides data for inter-firm comparison. Ratios highlight the factors associated with successful
and unsuccessful firm. They also reveal strong firms and weak firms, overvalued and
undervalued firms.
HELPS IN PLANNING
It helps in planning and forecasting. Ratios can assist management, in its basic functions of
forecasting. Planning, co-ordination, control and communications.
45
MAKES INTER-FIRM COMPARISON POSSIBLE
Ratios analysis also makes possible comparison of the performance of different divisions of the
firm. The ratios are helpful in deciding about their efficiency or otherwise in the past and likely
performance in the future.
HELP IN INVESTMENT DECISIONS
It helps in investment decisions in the case of investors and lending decisions in the case of bankers etc
3.1 DATA.
Three cement industries for their comparative financial analysis (Inter firm &
inter period Analysis). We have collected the annual reports of our respective companies for
five years (2011-2015) .The companies are as follows:
 Pioneer Cement Ltd.
 Kohat Cement Ltd.
 Cherat Cement Ltd.
PROBLEM STATEMENT
Analysis will be made for Balance Sheet and Profit & loss A/c .the following financial statement
analysis and ratio analysis will also be analyzed.
Trend analysis (Horizontal Analysis).
Common size statement (Vertical Analysis)
RATIO ANALYSIS
 Liquidity ratios.
 Long term Liquidity / Long term Debt paying ability.
 Activity ratios / Asset turnover ratios / Efficiency ratios.
46
 Profitability ratios.
 Financial leverage ratios.
 Dividend policy ratios
 Comparison will be made on the entire above ratio to find how good the business of the
company is going.
PURPOSE OF STUDY
The purpose of the this research report is to extract the most out of the financial performance of
the Cement Industry by comparing the performance of the surveying units (Pioneer Cement Co.
Ltd.Comparison with Kohat & Cherat).
Pioneer Cement comparative analysis will be made by both inter period and inter firm analysis is
comparison with kohat Cement & Cherat Cement.
The main objective of this research is to find out the financially analysis of cement Industry of
Pakistan and also the current position of the cement industry in comparison of highly developed
and automated cement industry of the world and suggest the improvements needed to reach at
the same level, in term of trading process, trading volume and automation as well in term of
recognition as other the cement Industry have. Financial literacy for the business students is the
secondary purpose of this report especially for those students who don‟t select course related to
the finance.
RESEARCH OBJECTIVES
The objective of this study is to analyze the financial performance of the companies based on the
financial ratio during the period of 2011 to 2015.
Other objectives of this research report is to give the better investment opportunities to the
investors as well as to give the opportunity to the students to learn and have some knowledge
about the financial & comparative analysis of the industries.
47
LIMITATIONS OF REPORT
There are many performance measurements using financial ratio analysis. There might be
difficult to use all the measure. This study will select a certain financial ratio only. So, different
performance measurement will give different result.
This study based on the data collected through annual report, there could be some error in the
data sources, which could make the result not accurate.
This study limited to Five years research period from 2011 to 2015 for the ratio analysis in order
to determine the analysis and conclusion.
This research report is only the comparison of financial performance of two units of the Cement
Industry (i.e. Pioneer Cement compare with Kohat & Cherat.) and not the analysis of Cement
Industry as a whole.
METHODOLOGY:
This study used a comparative analysis (horizontal analysis) as a methodology because it is most
suitable and easy to interpret and compare the performance of this companion‟s. I will begin by
looking at the comparative ratios of the company for a Five -Years period by using trend
analysis.
Trend Analysis (Horizental) & ( Common size statement or Vertical)
Ratio Analysis.
3.2 RATIO ANALYSIS
A comparison of relationship among account balances. The term accounting ratio is used to
describe significant relationship between figures shown on a balance sheet, profit and loss
account or in any other part of accounting organization.
1. Profitability
48
It is ability to earn income and sustain growth in both short-term and long-term. A company's
degree of profitability is usually based on the income statement, which reports on the company's
results of operations;
2. Solvency
Its ability to pay its obligation to creditors and other third parties in the long-term;
3. Liquidity
Its ability to maintain positive cash flow, while satisfying immediate obligations;
4. Stability
The firm's ability to remain in business in the long run, without having to sustain significant
losses in the conduct of its business. Assessing a company's stability requires the use of both the
income statement and the balance sheet, as well as other financial and non-financial indicators
3.3. DATA COLLECTION PROCEDURES
The data has been collected from the annual report of selected company from the web site of the
respective company. Financial statement in the annual report will be used as a main source for
financial ratio analysis. For this study, the financial statement for three years (2011 to 2015) will
be used to get the result.
I choose Pioneer Cement comparative analysis with kohat & Cherat Cement.
Data has been collected from annual report (Balance Sheet & Income Statement) of five years
2011 to 2015 will be used to get the result.
3.4. ANALYSIS PROCEDURES
The financial ratio will be used in the analysis of the performance for the companies. The
selected company will be tested on the Trend Analysis / Vertical Analysis , profitability, liquidity
and solvency; certain financial ratio will be used such as;
49
Test of profitability
Return on Assets (ROA)
Return on Equity (ROE)
Profit margin
Earnings per share (EPS)
The test profitability ratios as its self described which include that how a company or an
organization can get its profitability factor enhance which influenced by its return on assets;
equity; margin & earning per share. The whole mechanism directly proportional to the
capability of firm or organization.
Test of liquidity
Current ratio
Quick/ acid test ratio
The test liquidity ratio defines that how quickly a firm or an organization transform its assets i.e.
cash securities; inventory & others into the form of cash its also enable the decision maker to
make corrective & proactive decisions which impact as increment in profitability of the
organization or firm.
Assets Turnover Ratio / Efficiency Ratio
Receivable Turn Over
Inventory Turn Over
50
The asset turnover ratio also known as efficiency ratio, the main emphasize in both the ratio on
the capability of how the company receivable convert quickly from the suppliers & the inventory
in similar way.
Financial Leverage Ratio
Debt-equity ratio
Debt-assets ratio
Times Interest Earned
The financial leverage ratios including debt-equity to asset & to time interest earned as a part
from those it‟s essential to conclude the financial stability of the organization which might be
essential for the company‟s whole structure including production, overhauling; forecasting &
utilizing the parameters into growth & corrective measures.
Dividend Policy Ratio
Dividend Yield
Payout Ratio
3.5 TOOLS OF ANALYSIS
PERCENTAGE ANALYSIS
Tools Of Analysis
Percentage Analysis Ratio Analysis
51
RATIO ANALYSIS
4 DATA ANALYSIS , RESULTS / FINDINGS AND DISCUSSIONS.
4.1 KOHAT CEMENT COMPANY LTD
A longtime leader in the cement manufacturing industry, Kohat Cement Company,
headquartered in Islamabad, operates a cement plant at Jhang Bahtar, Tehsil Fateh Jang, District
Attock in the province of Punjab. The Company has a strong and longstanding tradition of
service, reliability, and quality that reaches back more than 11 years. Sponsored by Kohat
Foundation, the Company was incorporated in Rawalpindi in 1992.
Horizontal Analysis Trend Analysis Vertical Analysis
Profitablility
Ratios
• Gross Profit
Ratio
• Operating Profit
Ratio
• Return On
Equity
• Return On
Assets
Liquidity Ratios
• Current Ratio
• Quick(Acid-
Test) Ratio
Efficiency Ratios
• Recievable
Turnover
Ratio
• Turnover
Days
• Total Asset
Turnover
Ratio
Debt Ratios
• Debt-To-Equity
Ratio
• Interest Coverage
Ratio
52
4.1.1 BALANCE SHEET (HORIZONTAL ANALYSIS)
Formula
Trend Analysis (Horizontally)= 100X
BaseYear
rCurrentYea
Trend Analysis (Horizontally= %15.204100
574460
1172765
X
Kohat Cement Company Limited
Balance Sheet (Trend Analysis)
As on December….. RS(000)
2011 2012 2013 2014 2015
CURRENT ASSETS 100.00% 204.15% 274.93% 340.06% 921.58%
Cash and bank balances 100.00% 306.01% 430.06% 214.69% 1919.91%
Deposit accounts 100.00% 407.60% 580.74% 293.17% 2733.41%
Current accounts 100.00% 121.17% 230.95% 94.01% 126.79%
Collection accounts 100.00% 43.97% 0.00% 0.00% 0.00%
Cash in hand 100.00% 485.19% 398.15% 329.63% 479.63%
Advances, Deposits, prepayments and
other receivables: 100.00% 62.57% 95.59% 1167.06% 469.63%
To suppliers 100.00% 53.31% 92.59% 2395.69% 45.59%
To employees 100.00% 174.39% 365.03% 138.31% 550.78%
Due from associated undertaking –
unsecured 100.00% 99.82% 283.05% 0.00% 0.00%
Deposits 100.00% 113.18% 142.04% 136.71% 436.94%
Prepayments 100.00% 40.68% 93.69% 29.46% 37.39%
53
Excise duty 100.00% 30.84% 0.00% 0.00% 0.00%
Advance tax –net 100.00% 175.82% 166.06% 295.30%
Sales tax refundable –net 100.00% 0.00% 0.00% 0.00% 2191.81%
Derivative foreign currency options used as
hedging instrument 100.00%
Interest accrued 100.00% 46.07% 251.77% 233.43% 681.75%
Prepaid arrangement fee for loans 100.00% 678.82%
Margin on letters of credit 100.00%
Other receivables- Considered goods 100.00% 1276.74% 439.69% 323.10% 1113.02%
Others 100.00% 0.00% 0.00% 66.72% 15.09%
TRADE DEBTS 100.00% 239.41% 56.88% 43.67% 60.12%
Unsecured 100.00% 104.98% 113.46% 67.62% 20.34%
Considered goods 100.00% 105.34% 114.41% 34.89% 0.00%
Considered doubtful 100.00% 100.00% 100.00% 532.74% 309.38%
Secure-considered goods 100.00% 371.96% 0.00% 52.34% 119.55%
Less: Provision for doubtful debts 100.00% 100.00% 100.00% 532.74% 309.38%
STOCK IN TRADE 100.00% 90.80% 235.54% 297.58% 373.52%
Raw and packing material 100.00% 121.32% 184.00% 157.19% 205.41%
Work in process 100.00% 41.87% 337.42% 415.05% 549.44%
Finished goods 100.00% 138.80% 125.74% 237.21% 248.67%
STORES, SPARES AND LOOSE
TOOLS 100.00% 182.60% 248.68% 237.47% 459.77%
Stores 100.00% 149.83% 276.30% 86.30% 578.20%
Spares 100.00% 206.65% 236.79% 333.02% 404.46%
Loose tools 100.00% 114.73% 168.79% 175.80% 188.62%
DEFERRED TAX ASSETS – NET 100.00% 59.14% 0.00% 0.00% 0.00%
54
LONG TERM DEPOSITS 100.00% 127.35% 127.35% 127.35% 127.35%
Islamabad Electric Supply Company
Limited 100.00% 100.00% 100.00% 100.00% 100.00%
Sui Northern Gas Pipelines Limited 100.00% 166.74% 166.74% 166.74% 166.74%
LONG TERM ADVANCES – Considered
goods 100.00% 100.00% 90.00% 80.00%
Sui Northern Gas Pipelines Limited 100.00% 90.00%
Less: Amount receivables within 12 months
shown under current assets 100.00% 100.00%
FIXED ASSETS – Tangible: 100.00% 98.50% 96.49% 92.88% 150.27%
Property, Plant and equipment 100.00% 98.50% 96.49% 92.88% 150.27%
Total Assets 100.00% 105.30% 104.87% 108.30% 210.72%
CURRENT LIABILITIES 100.00% 324.35% 340.54% 387.59% 659.68%
Current portion of long term financing: 100.00% 639.24% 635.78% 635.78% 635.78%
Short term borrowings – secured: 100.00% 76.52% 121.57% 446.25%
Markup accrued: 100.00% 528.15% 455.16% 368.03% 252.71%
Trade and other payables: 100.00% 101.19% 154.54% 171.92% 181.01%
Creditors 100.00% 100.70% 130.91% 179.11% 144.57%
Accrued liabilities 100.00% 105.82% 100.07% 187.35% 275.43%
Retention money 100.00% 97.36% 118.71% 110.79% 143.42%
Security deposits 100.00% 113.82% 149.19% 153.37% 144.98%
Advances from customers 100.00% 183.57% 254.07% 293.11% 178.82%
Workers‟ (Profit) Participation Fund 100.00% 234.20% 103.84% 61.11%
Workers‟ Welfare fund 100.00% 157.67%
Sales tax payable- net 100.00% 140.33% 175.91% 146.16% 0.00%
55
Excise duty payable 100.00% 6098.28% 17696.55% 14796.55% 99360.34%
Other liabilities 100.00% 7.21% 11.09% 49.87% 55.52%
Compensated absences 100.00% 10.67% 10.84%
Unclaimed dividend 100.00% 275.43% 107.67%
NON – CURRENT LIABILITIES 100.00% 71.33% 45.80% 33.99% 19.89%
Retention money payables: 100.00%
Deferred tax liability – net: 100.00% 157.82% 168.61%
Deferred liability 100.00% 112.29% 19.65% 20.56% 23.51%
Long term financing: 100.00% 70.87% 40.04% 24.59% 9.13%
Loans from banking companies –
Secured:
Habib Bank Limited 100.00% 65.29% 47.11% 28.93%
MCB Bank Limited 100.00% 65.29% 47.11% 28.93%
United Bank Limited 100.00% 65.29% 47.11% 28.93%
Bank Al Falah Limited 100.00% 65.29% 47.11% 28.93%
NIB Bank Limited 100.00% 61.40%
PICIC Commercial Bank Limited 100.00% 65.29% 0.00% 0.00%
Loan from related party:
Kohat Foundation- Unsecured 100.00% 0.00% 0.00% 0.00%
Less: amount payable within 12 months
shown under current liabilities 100.00% 99.46% 99.46% 99.46%
SHARE CAPITAL AND RESERVES 100.00% 126.33% 169.28% 192.62% 478.77%
Reserves: 100.00% -405.93%
Accumulated loss 100.00% 77.36% 40.43% 0.00% 0.00%
Share capital: 100.00% 100.00% 100.00% 100.00% 176.90%
56
Total Liabilities + Owner’s Equity 100.00% 105.30% 104.87% 108.30% 210.72%
4.1.2 BALANCE SHEET (VERTICAL ANALYSIS)
Formula
Common Size Statement (Vertically)= 100
.
X
TotalAsset
Item
Example:- Vertical Analysis = %72.9100
5910353
574460
X
Kohat Cement Company Limited
Balance Sheet (Vertical Analysis)
As on December….. RS(000)
2011 2012 2013 2014 2015
CURRENT ASSETS 9.72% 18.84% 25.48% 30.52% 42.51%
Cash and bank balances 3.33% 9.69% 13.67% 6.61% 30.38%
Deposit accounts 2.33% 9.00% 12.88% 6.29% 30.16%
Current accounts 0.36% 0.42% 0.79% 0.31% 0.22%
Collection accounts 0.65% 0.27% 0.00% 0.00% 0.00%
Cash in hand 0.00% 0.00% 0.00% 0.00% 0.00%
Advances, Deposits, prepayments and
other receivables: 1.24% 0.74% 1.13% 13.42% 2.77%
To suppliers 0.58% 0.29% 0.51% 12.74% 0.12%
To employees 0.01% 0.01% 0.03% 0.01% 0.02%
Due from associated undertaking –
unsecured 0.02% 0.02% 0.05% 0.00% 0.00%
57
Deposits 0.02% 0.02% 0.03% 0.03% 0.05%
Prepayments 0.18% 0.07% 0.16% 0.05% 0.03%
Excise duty 0.17% 0.05% 0.00% 0.00% 0.00%
Advance tax –net 0.00% 0.13% 0.22% 0.20% 0.19%
Sales tax refundable -net 0.06% 0.00% 0.00% 0.00% 0.66%
Derivative foreign currency options used
as hedging instrument 0.00% 0.00% 0.00% 0.00% 0.68%
Interest accrued 0.04% 0.02% 0.09% 0.08% 0.12%
Prepaid arrangement fee for loans 0.00% 0.00% 0.00% 0.17% 0.60%
Margin on letters of credit 0.00% 0.00% 0.00% 0.00% 0.24%
Other receivables- Considered goods 0.01% 0.13% 0.05% 0.03% 0.06%
Others 0.16% 0.00% 0.00% 0.10% 0.01%
TRADE DEBTS 0.76% 1.72% 0.41% 0.31% 0.22%
Unsecured 0.40% 0.40% 0.44% 0.25% 0.04%
Considered goods 0.38% 0.38% 0.41% 0.12% 0.00%
Considered doubtful 0.03% 0.03% 0.03% 0.13% 0.04%
Secure-considered goods 0.38% 1.35% 0.00% 0.18% 0.22%
Less: Provision for doubtful debts -0.03% -0.03% -0.03% -0.13% -0.04%
STOCK IN TRADE 1.04% 0.90% 2.34% 2.86% 1.85%
Raw and packing material 0.26% 0.30% 0.45% 0.37% 0.25%
Work in process 0.47% 0.19% 1.51% 1.80% 1.22%
Finished goods 0.31% 0.42% 0.38% 0.69% 0.37%
STORES, SPARES AND LOOSE
TOOLS 3.34% 5.79% 7.92% 7.32% 7.29%
Stores 1.22% 1.73% 3.20% 0.97% 3.34%
Spares 2.00% 3.93% 4.52% 6.16% 3.84%
58
Loose tools 0.12% 0.13% 0.20% 0.20% 0.11%
DEFERRED TAX ASSETS - NET 9.64% 5.42% 0.00% 0.00% 0.00%
LONG TERM DEPOSITS 0.62% 0.75% 0.75% 0.73% 0.37%
Islamabad Electric Supply Company
Limited 0.37% 0.35% 0.35% 0.34% 0.17%
Sui Northern Gas Pipelines Limited 0.25% 0.40% 0.40% 0.39% 0.20%
LONG TERM ADVANCES -
Considered goods 0.00% 0.14% 0.15% 0.13% 0.06%
Sui Northern Gas Pipelines Limited 0.00% 0.00% 0.00% 0.14% 0.07%
Less: Amount receivables within 12
months shown under current assets 0.00% 0.00% 0.00% -0.01% -0.01%
FIXED ASSETS - Tangible: 80.02% 74.85% 73.62% 68.62% 57.06%
Property, Plant and equipment 80.02% 74.85% 73.62% 68.62% 57.06%
Total Assets 100.00% 100.00% 100.00% 100.00% 100.00%
CURRENT LIABILITIES 6.30% 19.39% 20.44% 22.53% 19.71%
Current portion of long term financing: 1.46% 8.89% 8.87% 8.59% 4.42%
Short term borrowings - secured: 0.00% 4.96% 3.81% 5.87% 11.07%
Markup accrued: 0.22% 1.11% 0.96% 0.76% 0.27%
Trade and other payables: 4.61% 4.43% 6.79% 7.32% 3.96%
Creditors 0.77% 0.74% 0.96% 1.28% 0.53%
Accrued liabilities 1.07% 1.08% 1.02% 1.86% 1.40%
Retention money 0.18% 0.17% 0.21% 0.19% 0.12%
Security deposits 0.43% 0.47% 0.61% 0.61% 0.30%
Advances from customers 0.39% 0.68% 0.95% 1.06% 0.33%
Workers' (Profit) Participation Fund 0.00% 0.64% 1.51% 0.65% 0.20%
59
Workers' Welfare fund 0.00% 0.00% 0.00% 0.25% 0.20%
Sales tax payable- net 0.38% 0.50% 0.63% 0.51% 0.00%
Excise duty payable 0.00% 0.06% 0.17% 0.13% 0.46%
Other liabilities 1.38% 0.09% 0.15% 0.64% 0.36%
Compensated absences 0.00% 0.00% 0.55% 0.06% 0.03%
Unclaimed dividend 0.00% 0.00% 0.03% 0.09% 0.02%
NON - CURRENT LIABILITIES 60.89% 41.25% 26.59% 19.11% 5.75%
Retention money payables: 0.00% 0.00% 0.00% 0.00% 0.15%
Deferred tax liability - net: 0.00% 0.00% 3.47% 5.31% 2.92%
Deferred liability 0.68% 0.73% 0.13% 0.13% 0.08%
Long term financing: 60.21% 40.52% 22.99% 13.67% 2.61%
Loans from banking companies -
Secured:
Habib Bank Limited 0.00% 14.73% 9.66% 6.75% 2.13%
MCB Bank Limited 0.00% 14.73% 9.66% 6.75% 2.13%
United Bank Limited 0.00% 7.36% 4.83% 3.37% 1.06%
Bank Al Falah Limited 0.00% 7.36% 4.83% 3.37% 1.06%
NIB Bank Limited 0.00% 0.00% 0.00% 2.02% 0.64%
PICIC Commercial Bank Limited 0.00% 4.42% 2.90% 0.00% 0.00%
Loan from related party:
Kohat Foundation- Unsecured 0.00% 0.80% 0.00% 0.00% 0.00%
Less: amount payable within 12 months
shown under current liabilities 0.00% -8.89% -8.87% -8.59% -4.42%
SHARE CAPITAL AND RESERVES 32.81% 39.36% 52.96% 58.36% 74.54%
Reserves: 0.00% 0.00% 0.00% -7.17% 14.97%
Accumulated loss -38.16% -28.03% -14.71% 0.00% 0.00%
60
Share capital: 70.97% 67.39% 67.67% 65.53% 59.58%
Total Liabilities + Owner's Equity 100.00% 100.00% 100.00% 100.00% 100.00%
4.1.3 INCOME STATEMENT (TREND ANALYSIS)
Kohat Cement Company Limited
Income Statement (Trend Analysis)
For the Year Ended June…… RS(000)
2011 2012 2013 2014 2015
Sales 100.00% 120.76% 175.02% 147.20% 146.25%
Less: Government Levies 100.00% 113.16% 146.93% 138.46% 126.53%
Net Sales 100.00% 123.90% 186.66% 150.82% 154.42%
Cost of sales 100.00% 113.38% 134.69% 152.49% 185.66%
Raw material Consumed 100.00% 118.80% 178.66% 204.39% 197.47%
Packing material consumed 100.00% 95.18% 117.61% 142.21% 181.31%
Stores and spares consumed 100.00% 124.37% 114.51% 211.37% 206.51%
Spares written off 100.00% 5.02% 0.00%
Salaries, wages and benefits 100.00% 95.40% 155.63% 146.55% 146.19%
Rent, rates and taxes 100.00% 144.75% 269.12% 232.46% 555.04%
Insurance 100.00% 121.17% 85.05% 82.86% 81.91%
Fuel consumed 100.00% 123.95% 149.47% 173.41% 255.39%
61
Power consumed 100.00% 107.21% 127.01% 139.21% 145.60%
Depreciation 100.00% 103.67% 107.62% 113.65% 119.51%
Others 100.00% 114.80% 165.96% 174.47% 135.68%
100.00% 112.19% 139.05% 154.36% 188.03%
Add: Opening work-in-process 100.00% 477.24% 199.83% 1610.30% 1980.76%
Less: Closing work-in-process 100.00% 41.87% 337.42% 415.05% 549.44%
Cost of goods manufactured 100.00% 114.84% 135.70% 155.16% 188.29%
Add: Opening finished goods 100.00% 58.18% 80.75% 73.16% 138.01%
Less: Closing finished goods 100.00% 138.80% 125.75% 237.21% 248.67%
100.00% 113.38% 134.69% 152.49% 186.53%
Less: Own consumption capitalized 100.00%
100.00% 113.38% 134.69% 152.49% 185.66%
Gross profit 100.00% 146.00% 295.77% 147.34% 88.84%
Other income 100.00% 26.24% 101.35% 172.74% 251.67%
Distribution cost: 100.00% 104.49% 155.24% 199.08% 261.48%
Salaries, wages and benefits 100.00% 92.29% 178.07% 171.93% 156.45%
Export freight and other charges 100.00%
Traveling and entertainment 100.00% 179.59% 143.91% 68.18% 108.99%
Vehicle running and maintenance
expenses 100.00% 59.78%
Rent, rates and taxes 100.00% 102.45% 97.20% 118.27% 128.32%
Repairs and maintenance 100.00% 212.17% 152.07% 42.09% 70.07%
Printing and stationery 100.00% 125.74% 79.17% 81.73% 107.07%
Depreciation 100.00% 93.98% 138.67% 223.56% 346.22%
Others 100.00% 109.88% 123.62% 284.05% 51.63%
62
Administrative expenses: 100.00% 106.97% 168.53% 180.35% 193.49%
Salaries, wages and benefits 100.00% 100.08% 163.46% 194.52% 188.63%
Traveling and entertainment 100.00% 161.67% 232.29% 169.85% 364.49%
Vehicle running and maintenance
expenses 100.00% 89.94%
Insurance 100.00% 114.10% 170.51% 190.38% 192.95%
Rent, rates and taxes 100.00% 117.48% 404.32% 557.71% 607.61%
Repairs and maintenance 100.00% 156.12% 324.05% 135.02% 82.98%
Printing and stationery 100.00% 101.40% 170.91% 226.75% 153.97%
Depreciation 100.00% 181.21% 197.21% 277.50% 481.21%
Others 100.00% 92.87% 127.51% 75.31% 67.55%
Other Operating expenses: 100.00% 7597.19% 17659.85% 10900.19% 6433.40%
Audits' remuneration 100.00% 102.06% 106.00% 99.44% 112.57%
Workers' (Profit) Participation Fund 100.00% 234.20% 103.84% 61.11%
Workers' Welfare Fund 100.00% 57.67%
Finance Cost: 100.00% 112.44% 129.42% 101.41% 71.96%
Fee and charges on loans 100.00% 90.95% 4.30% 4.30% 4.30%
Interest/mark-up on long term finance 100.00% 306.65% 443.15% 350.01% 226.66%
Interest/mark-up on long term loan
from related party 100.00% 364.83% 52.23% 0.00% 0.00%
Interest on short term borrowings and
other charges 100.00% 25.16% 17.90% 266.75%
Interest on Workers' Profit
Participation Fund 100.00% 3.13% 0.00%
Guarantee commission 100.00% 28.76% 0.43% 0.87% 0.59%
Bank charges and commission 100.00% 77.84% 104.45% 90.39% 93.31%
Foreign exchange risk
100.00% 0.00% 0.00% 0.00% 0.00%
63
insurance(FERI) contract
Amortization of deferred cost 100.00% 0.00% 0.00% 0.00% 0.00%
Net profit before taxation 100.00% -311.99% -730.69% -323.97% -186.84%
Less: Taxation 100.00% -44.59% -102.96% -25.45% -7.35%
Net profit after taxation 100.00% 162.50% 383.17% 205.74% 131.66%
4.1.4 INCOME STATEMENT (VERTICAL ANALYSIS)
Kohat Cement Company Limited
Income Statement (Vertical Analysis)
For the Year Ended June…… RS(000)
2011 2012 2013 2014 2015
Sales 100.00% 100.00% 100.00% 100.00% 100.00%
Less: Government Levies -29.29% -27.45% -24.59% -27.55% -25.34%
Net Sales 70.71% 72.55% 75.41% 72.45% 74.66%
Less: Cost of sales 47.90% 44.97% 36.86% 49.62% 60.81%
Raw material Consumed 3.55% 3.49% 3.62% 4.92% 4.79%
Packing material consumed 4.79% 3.77% 3.22% 4.63% 5.94%
Stores and spares consumed 0.16% 0.17% 0.11% 0.23% 0.23%
Spares written off 0.00% 0.00% 0.33% 0.02% 0.00%
Salaries, wages and benefits 2.81% 2.22% 2.50% 2.80% 2.81%
Rent, rates and taxes 0.03% 0.04% 0.05% 0.05% 0.11%
64
Insurance 0.46% 0.46% 0.22% 0.26% 0.26%
Fuel consumed 17.39% 17.85% 14.85% 20.48% 30.36%
Power consumed 9.55% 8.48% 6.93% 9.03% 9.51%
Depreciation 7.48% 6.43% 4.60% 5.78% 6.12%
Others 1.95% 1.85% 1.84% 2.31% 1.81%
48.16% 44.75% 38.26% 50.50% 61.92%
Add: Opening work-in-process 0.18% 0.71% 0.20% 1.96% 2.43%
Less: Closing work-in-process -0.85% -0.30% -1.65% -2.41% -3.21%
Cost of goods manufactured 47.49% 45.16% 36.82% 50.05% 61.14%
Add: Opening finished goods 0.99% 0.47% 0.45% 0.49% 0.93%
Less: Closing finished goods -0.57% -0.66% -0.41% -0.92% -0.97%
47.90% 44.97% 36.86% 49.62% 61.09%
Less: Own consumption capitalized 0.00% 0.00% 0.00% 0.00% -0.28%
47.90% 44.97% 36.86% 49.62% 60.81%
Gross profit 22.81% 27.58% 38.55% 22.83% 13.86%
Other income 1.32% 0.29% 0.76% 1.54% 2.27%
Distribution cost: 0.63% 0.54% 0.56% 0.85% 1.12%
Salaries, wages and benefits 0.37% 0.28% 0.38% 0.43% 0.40%
Export freight and other charges 0.00% 0.00% 0.00% 0.00% 0.52%
Traveling and entertainment 0.03% 0.05% 0.03% 0.01% 0.02%
Vehicle running and maintenance
expenses 0.00% 0.00% 0.00% 0.06% 0.03%
Rent, rates and taxes 0.04% 0.03% 0.02% 0.03% 0.03%
Repairs and maintenance 0.01% 0.02% 0.01% 0.00% 0.01%
Printing and stationery 0.02% 0.02% 0.01% 0.01% 0.01%
65
Depreciation 0.02% 0.02% 0.02% 0.04% 0.06%
Others 0.14% 0.13% 0.10% 0.27% 0.05%
Administrative expenses: 1.22% 1.08% 1.17% 1.49% 1.61%
Salaries, wages and benefits 0.67% 0.56% 0.63% 0.89% 0.87%
Traveling and entertainment 0.06% 0.08% 0.08% 0.07% 0.16%
Vehicle running and maintenance
expenses 0.00% 0.00% 0.00% 0.05% 0.05%
Insurance 0.01% 0.01% 0.01% 0.01% 0.01%
Rent, rates and taxes 0.03% 0.03% 0.08% 0.12% 0.14%
Repairs and maintenance 0.02% 0.03% 0.04% 0.02% 0.01%
Printing and stationery 0.03% 0.02% 0.03% 0.04% 0.03%
Depreciation 0.06% 0.09% 0.07% 0.11% 0.20%
Others 0.33% 0.25% 0.24% 0.17% 0.15%
Other Operating expenses: 0.02% 1.03% 1.66% 1.22% 0.72%
Audits' remuneration 0.02% 0.01% 0.01% 0.01% 0.01%
Workers' (Profit) Participation Fund 0.00% 1.02% 1.65% 0.87% 0.51%
Workers' Welfare Fund 0.00% 0.00% 0.00% 0.34% 0.20%
Finance Cost: 6.29% 5.86% 4.65% 4.33% 3.09%
Fee and charges on loans 0.36% 0.27% 0.01% 0.01% 0.01%
Interest/mark-up on long term finance 1.77% 4.48% 4.47% 4.20% 2.74%
Interest/mark-up on long term loan from
related party 0.03% 0.08% 0.01% 0.00% 0.00%
Interest on short term borrowings and
other charges 0.00% 0.11% 0.02% 0.02% 0.24%
Interest on Workers' Profit Participation
Fund 0.00% 0.00% 0.05% 0.00% 0.00%
Guarantee commission 3.45% 0.82% 0.01% 0.02% 0.01%
66
Bank charges and commission 0.14% 0.09% 0.08% 0.09% 0.09%
Foreign exchange risk insurance(FERI)
contract 0.55% 0.00% 0.00% 0.00% 0.00%
Amortization of deferred cost 23.47% 0.00% 0.00% 0.00% 0.00%
Net profit before taxation -7.49% 19.36% 31.28% 16.49% 9.57%
Less: Taxation 17.17% -6.34% -10.10% -2.97% -0.86%
Net profit after taxation 9.67% 13.02% 21.18% 13.52% 8.71%
4.2 PIONEER CEMENT LIMITED
FIVE YEARS HORIZONTAL ANALYSIS OF INCOME STATEMENT
PIONEER CEMENT COMPANY LIMITED
FIVE YEAR POSITION OF INCOME SATEMENT
For the year ended June 30 2011 2012 2013 2014 2015
Net Sales 55% 2% 50% 55% 40%
Cost of goods sold 54% 52% 34% 47% 31%
Gross Profit 61% -74% 83% 74% 73%
Administrative And Selling expenses 293% 25% -15% 55% 19%
Operating Operating/Loss -124% -84% 107% 80% 91%
Other operating expenses 1997% -88% 13% 123% -5%
Other operating income 162% -84% 162% -65% 19%
67
ANALYSIS:
Sales of the Company has shown increasing trend and has increased up to 40% in 2011,55% in
2012 and 50% in 2013 and 2% in 2014 and 55% in 2015 and respective from previous years
Cost of sales has also shown an increasing trend. In 2011 it is 31%, 2012 it increased 47%, in
2013 in increased 34%, 52% increase in 2014 and 54% in 2015 from respective years cost of sale
increase more than increase in sales which result there is loss in 2014. The major reason of this
increase in cost was the plant shutdown due to irregular power supply of WAPDA and increase
in prices of diesel and empty bags.
Profit/loss from operations -189% -84% 120% 45% 84%
Financial & Other Voluntary separation
scheme charges
13% -286% 63% 3% 28%
Profit/loss before taxation 211% -120% 137% 65% 56%
Taxation 333% -135% 316% -133% -44%
Profit/loss after taxation 92% -114% 104% -22% 87%
68
Gross profit of the company has also shown a increasing trend in from 2011 to 2012 up to 2013
respectively and then decrease and got loss in 2014 and then gross profit increase 61% in 2015
company cost of sale increases but sale decrease, in 2014 gross profit decreases -74% and it was
61% in 2015.Selling and distribution expenses also increases in 2015 as 293% and 25% in 2014
respectively. This decrease in gross profit was due to the increase in cost of goods sold and also
administrative and selling expenses which cause company got loss.
Operating profit showing increasing trend from 2011 to 2013 as 91%, 80% and 107%
respectively and then it decrease in 2014 and 2015 as -84% and -124% which show big loss in
the year of 2015.
Finance cost Decrease in 2014 as 286% and increased in 2015 as 13% which is not at higher side
but it is at higher side in 2011 to 2013 as 63% for expansion of new grey and white cement
plants. There is a great increase in 2015 which cause the loss of the company. Profit before tax
shows decrease in 2014 as 120% and increase in 2015 as 211% and company got loss in 2015.
Profit after tax decreased in 2014 by 114% and it was increase 92% in 2015. Company
management tries to expand its operations so it needs more finds that were got from short and
long term financing. Due to economic crises and dispute with unionized permanent workers,
company faces losses. Company is good for long term benefits, because it had declared bonus
shares for last five years. It had a great capacity to produce cement and they are improving
technology. They had implemented Enterprise Resource Planning software to increase the
efficiency and for better management planning.
69
4.2.2 HORIZONTAL ANALYSIS OF BALANCE SHEET
BALANCE SHEET
As at June 30 2015 2014 2013 2012 2011
EQUITY AND LIABILITIES
SHARE CAPITAL AND RESERVE
Authorized Share Capital 0% 0% 0% 0% 0%
Issue Subscribed & Paid Up Capital 18% 5% 5% 62% 26%
Reserves -22% -43% 847% -118% -28%
10% -10% 43% 197% -2%
Surplus on Revaluation of fixed assets-net of tax 290% -5% -4% - -
NON-CURRENT LIABILITIES
Redeemable capital - - -100% -8% 9.61%
Long term financing-secured 6% -83% - - 10.44%
Long term loans-secured -26% 27% -8% 3% -
Long term Musharaka finance -100% - - - -
Liabilities against assets subject to finance lease -51% 7% 65% 2780% 4.41%
Long term deposits -65% -7% -15% 187% 0.145%
Long term creditor-unsecured -30% -26% - - -
Deferred liabilities -10% 17% -12% -21% 8.28%
Deferred tax liabilities - -100% 122% - -
-25% -3% 12% 9% 32.8%
BALANCE SHEET
70
CURRENT LIABILITIES
Creditors against expansion project -90% -5% -39% -
Trade and other payables 120% 7% 27% 251% 10.98%
Interest/ Mark up accrued 54% 70% -44% -25% 0.11%
Short term Murabah-secured -73% - - -
Short term Musharaka secured - - - -
Short term finances - - - - 4.90%
Short term borrowings - - -100% - -
Current maturity of redeemable capital - - -100% 93% -
Current maturity of long term loan - -100% -36% -64% 3.24%
Current portion of long term loan - -100% - -
Current portion of liabilities against assets
subject to finance lease
39% 761% 919% 112% 2.11%
Current portion of deferred liability -100% -99% - - - -
Sales tax payable - -100% 62% 340% -
49% 43% 41% 158% 21.34
%
22% 2% 22% 61% 11.46
%
ASSETS
NON CURRENT ASSETS
FIXED CAPITAL EXPENDITURE
Property, plant and equipment 27% -2% 20% 74% 52.31%
71
Long term loans -11% 43% -25% 13% 0.10%
Long term deposits -15% 28% 169% 55% 0.105%
Deferred tax assets - - - -100% -
27% -2% 21% 66% 52.52
%
CURRENT ASSETS
Stock in trade -54% 55% 70% 12% 2.55%
Store, spare and loose tools 3% 11% 31% 13% 8.01%
Assets held for disposal -100% - - - -
Trade Debts 35% 138% -34% -23%
Loan & advances 156% 80% -78% 939% 0.21%
Deposits & prepayments -59% -33% -16% -32% 1.03%
Other receivables 8471% -87% -73% 22% -
Current portion of long term deposits 838% - - - -
Sales tax net -100% - - - -
Taxation-net - -100% -11% -8% -
Cash & bank balance -54% 325% 310% -53% 0.72%
-19% 56% 34% 17% 12.52
%
22% 2% 22% 61% 23.83
%
ANALYSIS:
1) NON-CURRENT ASSETS:
As we can see from the horizontal balance sheet analysis of five years, the total non-current
assets have shown increasing trend. In 2011 it is 52.52%, 2012 it is 66% than it increase 21% in
72
2013, 21% in 2013 and then it decrease in 2014 by 2% and then again increase in 2015 by 27%
as compare to 2014. This shows heavy investment in fixed assets by the management.
Operating fixed assets showed increasing trend in from 2011 to 2013 by 74%, 20% respectively
it decreases 2% in 2014 and then again increase in 2015 from 2014 by 27%. Long term loans
showing mix trend it increased by 13% in 2012 and then it decreased 25% in 2013 and increased
by 43% in year 2014 and decrease 11% respectively. Lon-term deposit has shown an increasing
trend from 2012 to 2014 by 55%, 169% and 28% from respective years, and it decrease in 2015
by 15% from 2014. Deferred tax assets just in 2012 than no more 2013, 2014, 2015 so it
decrease almost 100%
2) CURRENT ASSETS:
Store, spare and tools has shown increasing trend from 2011 to 2015 by 13%, 31%, 11%,and 3%
from their respective years, which shows that company is in good position as liquidity point of
view. Stock in trade shows increasing trend from 2012 to 2014 by 12% in 2012, 70% in 2013,
55% in 2014 and decrease 54% in 2015.This higher inventory is indication of weak inventory
management. Trade debts has shown decreasing trend in 2012 from 2011 by 23% and then
decrease by 34% from 2012 an it increased by 138% in 2014 which is at higher side and then it
increase by 35% in 2015 from 2014.Receivable management is inefficient in 2014 and 2015 by
showing increasing trend as compare it with 2012 and 2013.Loan and advances shown increasing
trend in 2012 in huge amount it increase 939% from 2011 which means company made advances
and loans to the employees in huge amounts than it decrease in 2013 by 78% and in 2014 again
increase by 80% and also increase in 2015 by 156%.deposits and prepayment showing
decreasing trend from 2012 to 2015 by 32%, 16%, 33% and 59% by respective years. Other
receivables also showing decreasing trend from 2013 to 2015 just increased in 2012 from 2011
by 22%. Cash and bank balance first decreased in 2012 by 53% from 2011 than it showing
increasing trend from 2013 to 2014 by 310% and 325% from respective years and then again it
decreased in 2015 54% from 2014.
73
Over all current assets showing increasing from 2011 to 2014 by 17%, 34% and 56% from
respective years and it decrease in 2015 by 19% from 2014 which means current assets are
decreased in 2015.
3) EQUITY AND LIABILITIES:
Share capital show an increasing trend it increases in 2011 by 42% ,2012 in 62% and 5% in 2013
and 2014 respectively and 18% in 2015 which means that issued subscribed and paid up
capital increased throughout all the years. Reserves have decreased in year 2012 by 118% and
increased in 2013 by 847%, after that it decreased in next two years in 2014 and 2015 by 43%
and 22% respectively which shows that company has utilized all its reserves for expansion of
project. Due to expansion of project company has not sufficient reserves and company has
not paid any dividend after 2011.
4) NON-CURRENT LIABILITIES:
Non-current liabilities have also shown an increasing trend from 2011 to 2013 by 32.8%, 9% and
12% and decreased in 2014 and 2015 by 3% and 25% from respective years. Capital showing
decreasing trend in 2012 and 2013 by 8% and 100%. Long term loans secured increase by 3% in
2012 and then it decreased 8% in 2013 it again increased in 2014 by 27% and decreased in 2015
by 26%. Liabilities against assets subject to finance lease increased from 2012 to 2014 by
2870%, 65% and 7% respectively and it decreased by 51% in 2015 from 2014. Long term
deposits increased 187% in 2012 and then it decreased in 2013 to 2015 by 15%, 7% and 65%
from respective years. Deferred liabilities decreased in 2012 and 2013 by 21% and 12% and
increased 17% in 2014 and decreased 10% in 2015 from respective years.
5) CURRENT LIABILITIES:
Total current liabilities have also shown an increasing trend. This is also in line with increase in
current assets of the company. Short term financing is taken to meet the working capital
requirements. Company is meeting its obligation on regular basis which is evident from an
74
increase in the current portion of long term debts under current liabilities head of the balance
sheet.
Trade payables decreased in 2012 by 251% which is at higher side and increased 27%, 7%, and
120% in 2013, 2014 and 2015 where as 10.98% in 2011 which is unfavorable for the company.
Interest and mark up accrued decrease in 2012 by 25% and 44% in 2013 and increase in 2014
and 2015 by 40% and 54% respectively. Sales tax payable increase 340% in 2012 from 2011
which is huge change in 2013 it also increases 62% from 2012 and decrease 100% in 2014.
Finally, size of the company has increased during the last five years. More investment is made in
capital assets. Company is in expansion phase since the base year. Investment in new expansion
project and technology is being made in order to keep pace with changing business environment.
75
4.2.3 VERTICAL ANALYSIS OF INCOME STATEMENT
2.11.1
Five Year Position Of Income Statement
For the year ended June 30 2015 2014 2013 2012 2011
Sales- Net -2697% -3349% 455% 616% 312%
Cost of goods sold -2412% -3009% 273% 413% 221%
Gross Profit -285% -340% 182% 203% 91%
Administrative And Selling expenses -309% -151% 17% 40% 20%
Operating Operating/Loss 24% -189% 165% 162% 71%
Other operating expenses 83% 8% -9% -16% -5%
Other operating income -17% -13% 11% 8% 19%
Profit/loss from operations 89% -194% 167% 155% 84%
Financial & Other
Voluntary separation scheme charges
230% 391% 29% 36% 28%
Profit/loss before taxation 319% 197% 138% 119% 56%
Taxation 219% 97% 38% 19% -44%
Profit/loss after taxation 100% 100% 100% 100% 100%
Vertical Analysis of Pioneer Cement Company Limited
76
ANALYSIS:
As we can see from the vertical income statement the sales revenue increased from 2011 to 2013
by 312%, 6165 and 455% respectively and decreased by 3349% and 2697% in 2014 and 2015
respectively. Cost of sales also increased in 2011 by 221% in 2012 by 413% and in 2013 by
273% and in next two years it decrease in 2014 by 3009% and in 2015 by 2412%. Gross
profit increase in 2011 by 91% 203% increase in 2012, 182% increase in 2013 and in 2014 and
2015 it decreased 340% and 285% respectively.
Administrative and Selling expense also increase in 2011 to 2013 by 20%, 40% and 17%
respectively and it decreases in 2014 by 151% and in 2015 by 309% from respective years. Other
operating expense decreases from 2011 to 2013 by 5% in 2011, 16% in 2012 and 9% in 2013; it
increased in 2014 by 8% from 2013 and increase in 2015 by 83% from 2014. Other operating
income increased from 2011 to 2013 by 19%, 8% and 11% and decreased in 2014 by 13% and
17% in 2015. Financial and other voluntary separation charges showing increasing trend all five
years it increased by 28% in 2011 36% in 2012, 29% in 2013, 391% in 2014 and 230% in 2015
from their respective years. .Profit before taxation has increased by 56% in 2011 119% in 2012,
138% in 2013, 197% in 2014 and 219% in 2015.
Profit after taxation the company recorded loss in 2014 and in 2015 from their respective years.
Finally the company is improving with the passage of time. Although the profits are not
very adequate but the management is very confident that they are working hard and the
company will prosper in coming years as most of the capital work has been completed.
77
4.2.5. VERTICAL ANALYSIS OF BALANCE SHEET
VERTICAL ANALYSIS
FOR LAST FIVE YEARS
BALANCE SHEET
As at June 30 2015 2014 2013 2012 2011
EQUITY AND LIABILITIES
SHARE CAPITAL AND RESERVE
Authorized Share Capital 0% 0% 0% 0% 0%
Issue Subscribed & Paid Up Capital 19% 20% 19% 22% 22%
Reserves 3% 5% 8% 1% -10%
22% 24% 28% 24% 13%
Surplus on Revaluation of fixed assets-
net of tax
26% 7% 9% 15% 0%
NON-CURRENT LIABILITIES
Redeemable capital 0% 0% 0% 2% 4%
Long term financing-secured 1% 1% 5% 0% 0%
Long term loans-secured 16% 27% 22% 29% 45%
Long term Musharaka finance 0% 1% 1% 1% 0%
Liabilities against assets subject to
finance lease
2% 6% 5% 4% 0%
Long term deposits 0% 0% 0% 0% 0%
Long term creditor-unsecured 0% 0% 0% 0% 0%
VERTICAL ANALYSIS FOR PAST FIVE YEARS OF PIONEER CEMENT
78
Deferred liabilities 9% 12% 10% 14% 29%
Deferred tax liabilities 0% 0% 5% 3% 0%
28% 46% 49% 53% 78%
CURRENT LIABILITIES
Creditors against expansion project 0% 3% 4% 7% 0%
Trade and other payables 8% 5% 4% 4% 2%
Interest/ Mark up accrued 1% 1% 1% 1% 2%
Short term Murabah-secured 0% 1% 0% 0% 0%
Short term Musharaka secured 0% 0% 0% 0% 0%
Short term finances 3% 0% 0% 0% 0%
Short term borrowings 0% 0% 0% 0% 0%
Current maturity of redeemable capital 0% 0% 0% 0% 0%
Current maturity of long term loan 0% 0% 0% 1% 4%
Current portion of long term loan 0% 0% 4% 0% 0%
Current portion of liabilities against
assets subject to finance lease
15% 13% 2% 0% 0%
Current portion of deferred liability 0% 0% 2% 0% 0%
Sales tax payable 0% 0% 0% 0% 0%
29% 23% 17% 14% 9%
105% 100% 102% 106% 100%
ASSETS
79
NON CURRENT ASSETS
Property, plant and equipment 91% 87% 91% 93% 86%
Long term loans 0% 0% 0% 0% 0%
Long term deposits 1% 1% 1% 1% 1%
Deferred tax assets 0% 0% 0% 0% 5%
92% 89% 93% 93% 91%
CURRENT ASSETS
Stock in trade 1% 2% 1% 1% 1%
Store, spare and loose tools 4% 5% 4% 4% 6%
Assets held for disposal 0% 0% 0% 0% 0%
Trade Debts 0% 0% 0% 0% 1%
Loan & advances 1% 0% 0% 1% 0%
Deposits & prepayments 0% 0% 0% 0% 0%
Other receivables 0% 0% 0% 0% 0%
Current portion of long term deposits 0% 0% 0% 0% 0%
Sales tax net 0% 0% 0% 0% 0%
Taxation-net 0% 0% 0% 0% 0%
Cash & bank balance 1% 4% 1% 0% 1%
8% 11% 7% 7% 9%
100% 100% 100% 100% 100%
80
ANALYSIS:
NON-CURRENT ASSETS:
As we can see from the vertical balance sheet of the company total fixed assets are constant in
relation to total assets with little variations. The management is more focusing on working
capital management than on fixed asset in last two years as shown by the vertical balance
sheet.
Property, plant and equipment have shown an increasing trend it increased in 2011 by 86% in
2012 by 93% in 2013 by 91% 87% in 2014 and 91% in 2015.
CURRENT ASSETS:
Total current assets have shown an increasing trend over the last five year period. Stores and
spares decreased in year 2015, 2012 and 2013 by 4% and increased in 2011 by 6% and 2014 by
5%.Stock in trade has shown an increasing with a same sequence at the rate of 1% all the years
except 2014 which is 2%. Stock in trade is about 1% of the total current assets in 2011, 2012,
2013 and 2015 and it was 2% of total assets in 2014. Stores and spares have the largest portion
than stock of the total current assets.
Trade debts 1% of total assets in 2011 and then no other year has significant effect on total
current Asset affected by trade debts. Cash and bank balance were 1% in 2012, 1% in 2013 and
2015 and 4% in 2014. This trend shows that more funds are tied in receivable, inventories and in
stores & spares.
EQUITY AND LIABILITIES:
Issued Subscribed and paid up capital showing mix trend in increase 22% in 2011 and 2012
contribute in total liabilities and then it decrease in 2013 by 19% contribution and in 2014 by
20% and in 2015 19% in total liabilities. Currently company is not paying dividends to
shareholders. Reserves also decreased in 2011 by 10% and no major contribution in total
liabilities in coming years.
81
NON-CURRENT LIABILITIES:
Total long-term liabilities of the company have shown decreasing trend in relation to total
liabilities. It contributes in total liabilities by 78% in 2011, 53% in 2012, 49% in 2013, 46% in
2014 and 28% in 2015.
CURRENT LIABILITIES:
Current liabilities have shown an increasing trend during the last five years from 2011 to 2015 as
shown in the vertical balance sheet of the company they contribute in total liabilities by 9% in
2011, 14% in 2012, 17% in 2013, 23% in 2014 and 29% in 2015 which is maximum and
company got loss in 2014 and 2015. Trade and other payables have shown an increasing trend
with a marginal increase in last five years. Trade and other payables increase in 2015 by 8% and
2014 by 5% than their respective years, in 2013 and 2012 they were 4% and 2%in 2011.
TREND ANALYSIS
Trend Analysis is a comparative analysis of a company's financial ratios over time.
SIGNIFICANCE:
It is an aspect of technical analysis that tries to predict the future movement of a stock based on
past data. Trend analysis is based on the idea that what has happened in the past gives traders an
idea of what will happen in the future.
BALANCE SHEET
As at June 30 2015 2014 2013 2012 2011
EQUITY AND LIABILITIES
SHARE CAPITAL AND RESERVE
Authorized Share Capital 100% 100% 100% 100% 100%
Issue Subscribed & Paid Up Capital 209% 177.9% 170.3% 162.1% 100%
BALANCE SHEET
82
Reserves -75.8% -97.3% -170.4% -17.9% 100%
422.8% 384.5% 425.9% 297.3% 100%
Surplus on Revaluation of fixed assets-net
of tax
0% 0% 0% 0% 0%
NON-CURRENT LIABILITIES
Redeemable capital 0% 0% 0% 92.1% 100%
Long term financing-secured 0% 39.1% 231.6% 0% 0%
Long term loans-secured 89.02% 0% 0% 0% 0%
Long term Musharaka finance 0% 0% 0% 0% 0%
Liabilities against assets subject to finance
lease
2493.6% 5102.5% 165.3% 2880.07% 100%
Long term deposits 79.4% 226.1% 242.5% 286.5% 100%
Long term creditor-unsecured 0% 0% 0% 0% 0%
Deferred liabilities 73.2% 81.7% 69.8% 78.87% 100%
Deferred tax liabilities 0% 0% 0% 0% 0%
87.8% 108.01% 121.9% 109.01% 100%
CURRENT LIABILITIES
Creditors against expansion project 0% 0% 0% 0% 0%
Trade and other payables 1046.2% 476.1% 446.5% 351.04% 100%
Interest/ Mark up accrued 109.7% 71.38% 41.9% 75% 100%
Short term Murabah-secured 0% 0% 0% 0% 0%
Short term Musharaka secured 0% 0% 0% 0% 0%
Short term finances 0% 0% 0% 0% 100%
Short term borrowings 0% 0% 0% 0% 0%
Current maturity of redeemable capital 0% 0% 0% 192.9% 0%
83
Current maturity of long term loan 0% 0% 0% 35.6%
100%
Current portion of long term loan 0% 0% 0% 0% 0%
Current portion of liabilities against assets
subject to finance lease
0% 0% 2158.4% 211.9%
100%
Current portion of deferred liability 0% 0% 0% 0% 0%
Sales tax payable 0% 0% 710.9% 440.2% 0%
779.8% 521.9% 287.1% 130.7% 100%
- - 364.9% 258.3% 100%
ASSETS
NON CURRENT ASSETS
FIXED CAPITAL EXPENDITURE
Property, plant and equipment 261.6% 205.3% 210.1% 174.5% 100%
Long term loans 107.7% 121.7% 75.37% 112.8% 100%
Long term deposits 456.5% 343.4% 268.6% 155.4% 100%
Deferred tax assets - - - - -
249.6% 197.03% 121.2% 165.6% 100%
CURRENT ASSETS
Stock in trade 135.2% 295.8% 170.3% 111.8% 100%
Store, spare and loose tools 167.6% 163.4% 130.9% 112.6% 100%
Assets held for disposal - - - - -
Trade Debts 162.3% 120% 50.5% 76.7% 100%
Loan & advances 1062.1% 414.9% 230.3% 1038.6% 100%
84
Deposits & prepayments 15.9% 38.8% 57.8% 68.4% 100%
Other receivables 366.1% 4.27% 65.5% 121.8%
100%
Current portion of long term deposits - - - - -
Sales tax net - - - - -
Taxation-net 80.8% 0% 82.16% 92.3% 100%
Cash & bank balance 372.4% 817.4% 192.4% 46.9% 100%
199.3% 244.6% 156.4% 117.1% 100%
244.9% 201.4% 196.6% 161.1% 100%
ANALYSIS:
NON-CURRENT ASSETS:
As we can see from the balance sheet of the company total fixed assets are constant in relation
to total assets with little deviations. The management is more focusing on fixed asset in past
years. As property, plant and equipment have shown an increasing trend.
CURRENT ASSETS:
Total current assets have shown an increasing trend over the last five year period. Stores and
spares increased consistently over the years. Stock in trade has shown an increasing with a same
sequence. Loans and advances have the largest portion than stock of the total current assets. This
trend shows that more funds are needed.
EQUITY AND LIABILITIES:
Issued Subscribed and paid up capital showing mix trend in increase that there is increase in
2012 andin2013 where as there is a decrease in 2014 and in increase in 2015 in total liabilities as
currently company is not paying dividends to shareholders
85
NON-CURRENT LIABILITIES:
Total long-term liabilities of the company have shown decreasing trend in relation to total
liabilities.
CURRENT LIABILITIES:
Current liabilities have shown an substantially mix trend during the last five years from 2011 to 2015 as
shown in the balance sheet of the company they contribute in total liabilities.
INCOME STATEMENT
PIONEER CEMENT COMPANY LIMITED
FIVE YEAR POSITION OF INCOME STATEMENT
For the year ended June 30 2015 2014 2013 2012 2011
Gross Turnover 337.4% 237.3% 212.0% 142.9% 100%
Excise Duty 288.8% 238.6% 210.9% 115.6% 100%
Sales Tax 261.8% 218.9% 192.2% 125.03% 100%
Commission 226.2% 227.1% 104.8% 98.18% 100%
275.9% 23.78% 169.5% 118.78% 100%
Net turnover 367% 236.7% 232.5% 154.6% 100%
Cost of sales 463.6% 300.5% 197.1% 146.57% 100%
Gross Profit 132.8% 82.3% 318.2% 174.08% 100%
Distribution Cost 1649.1% 192.7% 138.8% 241.90% 100%
Administrative And Selling
expenses
155.2% 149.8% 127.6% 112.69% 100%
- - 131.2% 155.03% 100%
Other operating income-net 39% 14.8% 90.63% 34.63% 100%
- - 313.65% 149.5% 100%
86
ANALYSIS:
As we can see from the income statement the gross turnover has increased from 2011 to 2015 as
excise duty and sales tax has increased in these years where as there is a 1%decrease in
commission in 2015.There is a substantial increase in net turnover as trend of cost of sales has
increased. There was a increase in 2012 and 2013 in gross profit then company start facing losses
in 2014 and 2015 because there distribution cost and administrative expenses increases which
was due to the flaw in the management of the company. The finance cost and other charges have
also increased which assist the losses of the company. Finally the company is improving with the
passage of time. Although the profits are not very adequate but the management is very confident
that they are working hard and the company will prosper in coming years as most of the capital
work has been completed.
4.3. RATIO ANALYSIS
Finance Cost 351.8% 311.5% 167.7% 102.8% 100%
Other Charges 639.3% 30.49% 25.12% 222.8% 100%
- - 181.55% 122.7% 100%
Profit before taxation -240.9% -77.4% 391.6% 165.3% 100%
Taxation -211.7% -48.8% -138.18% -33.23% 100%
Profit after taxation -42.41% 22.03% 159.3% 78.27% 100%
87
4.3.1. LIQUIDITY RATIOS
Liquidity ratios are the ratios for testing short term solvency or financial position of a business. These are
designed to test the ability of the business to meet its short term obligation promptly, a class of financial
metrics that IS used to determine a company's ability to pay off its short-terms debts obligations.
Generally, the higher the value of the ratio, the larger the margin of safety that the company possesses to
cover its short-term debts
4.3.2. CURRENT RATIO:
Current ratio may be defined as the relationship between current assets and current liabilities. This ratio is
also known as "working capital ratio". It is a measure of general liquidity and is most widely used to
make the analysis for short term financial position or liquidity of a firm. It is calculated by dividing the
total of the current assets by total of the current liabilities.
COMPONENTS:
The two basic components of this ratio are current assets and current liabilities. Current assets include
cash and those assets which can be easily converted into cash within a short period of time, generally, one
year, such as marketable securities or readily realizable investments, bills receivables, sundry debtors,
(excluding bad debts or provisions), inventories, work in progress, etc. Prepaid paid expenses should also
be included in current assets because they represent payments made in advance which will not have to be
paid in near future. Current liabilities are those obligations which are payable within a short period of tie
generally one year and include outstanding expenses, bills payable, sundry creditors, bank overdraft,
accrued expenses, short term advances, income tax payable, dividend payable, etc. However, sometimes a
controversy arises that whether overdraft should be regarded as current liability or not. Often an
arrangement with a bank may be regarded as permanent and therefore, it may be treated as long term
liability. At the same time the fact remains that the overdraft facility may be cancelled at any time.
Accordingly, because of this reason and the need for conversion in interpreting a situation, it seems
advisable to include overdrafts in current liabilities.
88
LIMITATIONS OF CURRENT RATIO:
This ratio is measure of liquidity and should be used very carefully because it suffers from many
limitations. It is, therefore, suggested that it should not be used as the sole index of short term solvency
1. It is crude ratio because it measures only the quantity and not the quality of the current assets.
2. Even if the ratio is favorable, the firm may be in financial trouble, because of more stock and
work in process which is not easily convertible into cash, and, therefore firm may have less
cash to pay off current liabilities.
3. Valuation of current assets and window dressing is another problem. This ratio can be very
easily manipulated by overvaluing the current assets. An equal increase in both current assets
and current liabilities would decrease the ratio and similarly equal decrease in current assets
and current liabilities would increase current ratio.
SIGNIFICANCE:
This ratio is a general and quick measure of liquidity of a firm. It represents the margin of safety or
cushion available to the creditors. It is an index of the firm‟s financial stability. It is also an index of
technical solvency and an index of the strength of working capital.
A relatively high current ratio is an indication that the firm is liquid and has the ability to pay its current
obligations in time and when they become due. On the other hand, a relatively low current ratio represents
that the liquidity position of the firm is not good and the firm shall not be able to pay its current liabilities
in time without facing difficulties. An increase in the current ratio represents improvement in the liquidity
position of the firm while a decrease in the current ratio represents that there has been deterioration in the
liquidity position of the firm. A ratio equal to or near 2: 1 is considered as a standard or normal or
satisfactory. The idea of having double current assets as compared to current liabilities is to provide for
the delays and losses in the realization of current assets. However, the rule of 2:1 should not be blindly
used while making interpretation of the ratio. Firms having less than 2 : 1 ratio may be having a better
liquidity than even firms having more than 2 : 1 ratio. This is because of the reason that current ratio
measures the quantity of the current assets and not the quality of the current assets. If a firm's current
assets include debtors which are not recoverable or stocks which are slow-moving or obsolete, the current
ratio may be high but it does not represent a good liquidity position.
89
Current Ratio.
Formula Current Assets/Current Liabilities
Years 2015 2014 2013 2012 2011
Pioneer Cement 0.26 0.48 0.56 0.92 1.03
Cherat Cement 1.07 2.28 2.45 3.07 2.47
Kohat Cement 0.66 1.00 2.56 1.47 1.24
ANALYSIS:
Current Ratio clears the extent to which the claim of short term creditors can be met by assets
that are to become cash within a year. The best standard ratio is 2:1 so, the Pioneer Cement has
current ratio below standard. There is a decrease in 2011 to 2015. Current Ratio of Kohat
Cement is more than Pioneer and Cherat cement.
Current ratio shows that how many times current assets are available to meet its current
liabilities. Pioneer cement current ratio shows decreasing trend and it has less than 1:1 but only
0
0.5
1
1.5
2
2.5
3
3.5
2015 2014 2013 2012 2011
Pioneer Cement
Cherat Cement
Kohat Cement
4.3.2. CURRENT RATIO
90
in 2011 it is more than 1:1. Cherat cement also shows decreasing trend in current ratio. Kohat
cement current ratio shows increasing trend in 2011, 2012 and in 2013 but decreases in 2014 and
2015 which shows that it has less current assets or current liabilities increases.
4.3.3. QUICK RATIO:
Liquid ratio is also termed as "Liquidity Ratio”,” Acid Test Ratio" or "Quick Ratio". It is the
ratio of liquid assets to current liabilities. The true liquidity refers to the ability of a firm to pay
its short term obligations as and when they become due
COMPONENTS:
The two components of liquid ratio (acid test ratio or quick ratio) are liquid assets and liquid
liabilities. Liquid assets normally include cash, bank, sundry debtors, bills receivable and
marketable securities or temporary investments. In other words they are current assets minus
inventories (stock) and prepaid expenses. Inventories cannot be termed as liquid assets because it
cannot be converted into cash immediately without a loss of value. In the same manner, prepaid
expenses are also excluded from the list of liquid assets because they are not expected to be
converted into cash. Similarly, Liquid liabilities means current liabilities i.e., sundry creditors,
bills payable, outstanding expenses, short term advances, income tax payable, dividends payable,
and bank overdraft (only if payable on demand). Some time bank overdraft is not included in
current liabilities, on the argument that bank overdraft is generally permanent way of financing
and is not subject to be called on demand. In such cases overdraft will be excluded from current
liabilities
SIGNIFICANCE:
The quick ratio/acid test ratio is very useful in measuring the liquidity position of a firm. It
measures the firm's capacity to pay off current obligations immediately and is more rigorous test
of liquidity than the current ratio. It is used as a complementary ratio to the current ratio. Liquid
ratio is more rigorous test of liquidity than the current ratio because it eliminates inventories and
prepaid expenses as a part of current assets. Usually a high liquid ratio an indication that the firm
91
is liquid and has the ability to meet its current or liquid liabilities in time and on the other hand a
low liquidity ratio represents that the firm's liquidity position is not good. As a convention,
generally, a quick ratio of "one to one" (1:1) is considered to be satisfactory.
Although liquidity ratio is more rigorous test of liquidity than the current ratio, yet it should be
used cautiously and 1:1 standard should not be used blindly. A liquid ratio of 1:1 does not
necessarily mean satisfactory liquidity position of the firm if all the debtors cannot be realized
and cash is needed immediately to meet the current obligations. In the same manner, a low liquid
ratio does not necessarily mean a bad liquidity position as inventories are not absolutely non-
liquid. Hence, a firm having a high liquidity ratio may not have a satisfactory liquidity position if
it has slow-paying debtors. On the other hand, a firm having a low liquid ratio may have a good
liquidity position if it has a fast moving inventory. Though this ratio is definitely an
improvement over current ratio, the interpretation of this ratio also suffers from the same
limitations as of current ratio
Quick Ratio
Formula Current Asset-stock/current liabilities
Years 2015 2014 2013 2012 2011
Pioneer Cement 0.24 0.41 0.47 0.81 0.9
Cherat cement 0.94 2.07 2.17 2.88 2.25
Kohat Cement 0.57 0.78 2.34 1.41 1.18
92
ANALYSIS:
The acid test ratio is also below standard due to heavy short term borrowings. Pioneer acid test
ratio decreased in year 2012, 2013, 2014 and in 2015. The quick ratio of Kohat cement shows
that sufficient liquid asset is available to discharge and settle its current obligation. The rise in
current liabilities is due to the expansion of project and short and long term financing. Pioneer
Cement liquidity is less than standard. Kohat and Cherat cement liquidity is on considerable
point. Kohat cement liquid ratio is more than pioneer and Cherat which shows that it has more
liquidity. Cherat liquidity position is considerable because it is near to 1 which shows that it has
liquid assets to meet its current liabilities. Pioneer position is not at considerable point. It shows
decreasing trend and less than 1:1.
0
0.5
1
1.5
2
2.5
3
3.5
2015 2014 2013 2012 2011
Pioneer Cement
Cherat cement
Kohat Cement
93
4.3.4. TURNOVER/ACTIVITY RATIOS:
Activity ratios are measures of how well assets are used. Activity ratios -- which are, for the
most part, turnover ratios can be used to evaluate the benefits produced by specific assets, such
as inventory or accounts receivable. Or they can be use to evaluate the benefits produced by all a
company's assets collectively.
These measures help us gauge how effectively the company is at putting its investment to work.
A company will invest in assets – e.g., inventory or plant and equipment – and then use these
assets to generate revenues. The greater the turnover, the more effectively the company is at
producing a benefit from its investment in assets
INVENTORY DAYS:
The number of day‟s inventory is also known as average inventory period and inventory holding
period. A high number of days inventory indicates that there is a lack of demand for the product
being sold. A low days inventory ratio (inventory holding period) may indicate that the company
is not keeping enough stock on hand to meet demands.
The number of day‟s inventory and inventory turnover ratios are included in the financial
statement ratio analysis spreadsheets highlighted in the left column, which provide formulas,
definitions, calculation, charts and explanations of each ratio.
94
ANALYSIS:
Pioneer inventory days decreased in 2012 as compare to 2011 and increased in 2013 and in 2014
and show decreasing in 2015 which shows that management is efficient for managing inventory
period.
0
10
20
30
40
50
60
2015 2014 2013 2012 2011
Pioneer Cement
Cherat Cement
Kohat Cement
Inventory Days
Formula Inventory Days = Inventory / Cost of Sales*365
Years 2015 2014 2013 2012 2011
Pioneer Cement 6 20 19 15 20
Cherat Cement 24 40 21 23 6.67
Kohat Cement 49 38 28 8 6
INVENTORY DAYS
95
The above diagram shows that in 2011 and 2012 Kohat cement has less inventory days required
to convert stock in sale which shows that Kohat management is efficient but it decreases with the
passage of times and Pioneer trend is opposite to Kohat. It was low in beginning and it increases
in 2015, but Cherat Cement shows mixed trend.
4.3.5. DEBTORS TURNOVER RATIO OR RECEIVABLES TURNOVER RATIO:
Debtor‟s turnover ratio indicates the velocity of debt collection of a firm. In simple words it
indicates the number of times average debtors (receivable) are turned over during a year.
SIGNIFICANCE OF THE RATIO:
This ratio indicates the number of times the debtors are turned over a year. The higher the value
of debtors, turnover the more efficient is the management of debtors or more liquid the debtors
are. Similarly, low debtors turnover ratio implies inefficient management of debtors or less liquid
debtors. It is the reliable measure of the time of cash flow from credit sales. There is no rule of
thumb which may be used as a norm to interpret the ratio as it may be different from firm to
firm.
96
0
5
10
15
20
25
30
35
40
2015 2014 2013 2012 2011
Pioneer Cement
Cherat Cement
Kohat Cement
Debtor days.
Formula Trade debtors/Credit sales*365
Years 2015 2014 2013 2012 2011
Pioneer Cement 3 3 1 3 7
Cherat Cement 35 19 10 8 9
Kohat Cement 4 5 3 5 7
DEBTOR DAYS
97
ANALYSIS:
Graph shows that Pioneer cement has good debtor management to receive the debt or collect the
receivables and shows positive trend and debtor‟s collection period is less than creditor‟s period.
Kohat position is also considerable but Cherat management has more time to collect their
receivables whish shows inefficient debtor management and in 2015 it is at highest point which
indicates unfavorable situation regarding to debtor collection period.
4.3.6. TOTAL ASSETS TURNOVER RATIO:
The total assets turnover ratio measures the use of all assets in terms of sales, by comparing sales
with net total assets. This interactive tutorial walks you through the calculations as well as where
on the financial statements to find the numbers.
Total Asset Turnover
Formula Sales/ Total Assets
Years 2015 2014 2013 2012 2011
Pioneer Cement 0.46 0.36 0.37 0.30 0.31
Cherat Cement 0.68 0.74 0.67 0.74 0.95
Kohat Cement 0.18 0.26 0.76 1.04 1.10
TOTAL ASSET TURNOVER
98
ANALYSIS:
In the above graph we can see that total asset turnover ratio of Pioneer cement company showing
mix trend in the year 2015 total asset total asset turnover ratio is at highest level and as it
compare it with Cherat and Kohat cement it is better in the last two year 2014,2015 so we can
say it is using its assets for generating the revenue in a better way than Kohat and Cherat cement
in 2011,2012 and 2013 Kohat cement total asset turnover ratio at top so they use much of it for
generating revenue.
But pioneer overall situation regarding to total asset turnover ratio is better than other two
competitors.
4.3.7. FIXED ASSETS TURNOVER RATIO:
Fixed assets turnover ratio is also known as sales to fixed assets ratio. This ratio measures the
efficiency and profit earning capacity of the concern. Higher the ratio, greater is the intensive
utilization of fixed assets. Lower ratio means under-utilization of fixed assets
0
0.2
0.4
0.6
0.8
1
1.2
2015 2014 2013 2012 2011
Pioneer Cement
Cherat Cement
Kohat Cement
99
0
0.5
1
1.5
2
2.5
3
3.5
2015 2014 2013 2012 2011
Pioneer Cement
Cherat Cement
Kohat Cement
Fixed Asset Turnover Ratio
Formula Cost of sales / Fixed Assets
Years 2015 2014 2013 2012 2011
Pioneer Cement 0.51 0.42 0.41 0.32 0.36
Cherat Cement 0.39 0.2 0.35 0.51 0.61
Kohat Cement 1.46 1.52 2.12 2.95 2.32
FIXED ASSETS TURNOVER RATIO
100
ANALYSIS:
It shows the utilization of fixed assets, Pioneer increasing the utilization of its fixed assets but it
has lower times
than Kohat cement which has more utilization of fixed assets and at highest level in 2012. Cherat
Cement shows the mixed trend and has less utilization than Kohat and Pioneer cement.
4.4.1. PROFITABLITY RATIOS:
Profitability ratios (also referred to as profit margin ratios) compare components of income with
sales. They give us an idea of what makes up a company's income and are usually expressed as a
portion of each dollar of sales. The profit margin ratios we discuss here differ only by the
numerator. It's in the numerator that we reflect and thus evaluate performance for different
aspects of the business: The gross profit margin is the ratio of gross income or profit to sales.
This ratio indicates how much of every dollar of sales is left after costs of goods sold.
4.4.2. GROSS PROFIT (GP) RATIO:
Gross profit ratio (GP ratio) is the ratio of gross profit to net sales expressed as a percentage. It
expresses the relationship between gross profit and sales.
COMPONENTS:
The basic components of the calculation of gross profit ratio are gross profit and net sales. Net
sales means sales minus sales returns. Gross profit would be the difference between net sales and
101
cost of goods sold. Cost of goods sold in the case of a trading concern would be equal to opening
stock plus purchases, minus closing stock plus all direct expenses relating to purchases. In the
case of manufacturing concern, it would be equal to the sum of the cost of raw materials, wages,
direct expenses and all manufacturing expenses. In other words, generally the expenses charged
to profit and loss account or operating expenses are excluded from the calculation of cost of
goods sold.
SIGNIFICANCE:
Gross profit ratio may be indicated to what extent the selling prices of goods per unit may be
reduced without incurring losses on operations. It reflects efficiency with which a firm produces
its products. As the gross profit is found by deducting cost of goods sold from net sales, higher
the gross profit better it is. There is no standard GP ratio for evaluation. It may vary from
business to business. However, the gross profit earned should be sufficient to recover all
operating expenses and to build up reserves after paying all fixed interest charges and dividends.
Gross profit to Sales:
Formula Gross profit/Sales*100
Years 2015 2014 2013 2012 2011
Pioneer Cement 10.58% 10.16% 40.00% 32.91% 29.23%
Cherat Cement 5.95% 14.41% 40.68% 35.67% 34.33%
Kohat Cement 6.35% 22.09% 51.55% 38.72% 35.45%
GROSS PROFIT TO SALES
102
Analysis:
Gross profit of Pioneer cement company increasing in 2011 to 2013 but decrease in 2014 to
2015. Due to inflation and economic instability in Pakistan and irregular power supply of
WAPDA in 2014 and 2015. Gross Profit ratio of three competitors show increasing trend in 2011
to 2013 due to good economic and financial situation of world and good market situation in
Pakistan. Kohat position is more considerable up to 2013 but shows decreasing trend in 2014 and
2015, and Cherat Cement also has same situation.
4.4.3. OPERATING PROFIT RATIO:
Operating ratio is the ratio of cost of goods sold plus operating expenses to net sales. It is
generally expressed in percentage. It measures the cost of operations per dollar of sales. This is
closely related to the ratio of operating profit to net sales.
COMPONENTS:
The two basic components for the calculation of operating ratio are operating cost (cost of goods
sold plus operating expenses) and net sales. Operating expenses normally include (a)
0.00%
10.00%
20.00%
30.00%
40.00%
50.00%
60.00%
2015 2014 2013 2012 2011
Pioneer Cement
Cherat Cement
Kohat Cement
103
administrative and office expenses and (b) selling and distribution expenses. Financial charges
such as interest, provision for taxation etc. are generally excluded from operating expenses.
SIGNIFICANCE:
Operating ratio shows the operational efficiency of the business. Lower operating ratio shows
higher operating profit and vice versa. An operating ratio ranging between 75% and 80% is
generally considered as standard for manufacturing concerns. This ratio is considered to be a
yardstick of operating efficiency but it should be used cautiously because it may be affected by a
number of uncontrollable factors beyond the control of the firm. Moreover, in some firms, non-
operating expenses from a substantial part of the total expenses and in such cases operating ratio
may give misleading results
Operating Profit Margin
Formula Operating Profit Margin = Operating profit /Sale*100
Years 2015 2014 2013 2012 2011
Pioneer Cement -3.13% 5.79% 36.74% 25.16% 26.89%
Cherat Cement 4.38% 4.18% 34.14% 29.57% 32.31%
Kohat Cement 1.57% 17.91% 49.24% 35.86% 32.25%
OPERATING PROFIT RATIO
104
ANALYSIS:
Pioneer cement company operating profit increasing in 2011 to 2013 and decreasing in 2014 and
2015 and in 2015 they suffer loss by 3.13% due to increase in prices of coal, diesel and empty
bag in 2014-2015 Operating profit of all three organization show increasing trend in 2011, 2012,
and 2013 but decreases in 2014 and 2015due to increase in operating expenses.
4.4.4. RETURN ON ASSETS:
Where asset turnover tells an investor the total sales for each $1 of assets, return on assets tells
an investor how much profit a company generated for each $1 in assets. The return on assets
figure is also a sure-fire way to gauge the asset intensity of a business. Companies such as
telecommunication providers, car manufacturers, and railroads are very asset-intensive, meaning
they require big, expensive machinery or equipment to generate a profit. Advertising agencies
and software companies, on the other hand, are generally very asset-light.
-10.00%
0.00%
10.00%
20.00%
30.00%
40.00%
50.00%
60.00%
2015 2014 2013 2012 2011
Pioneer Cement
Cherat Cement
Kohat Cement
105
Return on Assets:
Formula Net Income / Total Assets*100
Years 2015 2014 2013 2012 2011
Pioneer Cement -1.72% -1.10% 8.00% 4.80% 9.90%
Cherat Cement 0.23% 5.21% 14.88% 15.99% 19.50%
Kohat Cement -2.92% 0.83% 25.68% 23.40% 22.97%
ANALYSIS:
This ratio measures the return of total investment of the business. Pioneer cement company show
mix trend in 2011 it is at maximum point than decrease in 2012 and again increase in 2013 and
then become negative in 2014 and 2015. Kohat cement company return on asset is much better
than Cherat and pioneer it decreases in 2011 to 2013 and then decrease in 2014 and becomes
negative in 2015, it is at highest point in 2013, Cherat also increase in 2011 to 2012 and then it
little decrease in 2013 and at goes down in 2014 and becomes negative in 2015.
-5.00%
0.00%
5.00%
10.00%
15.00%
20.00%
25.00%
30.00%
2015 2014 2013 2012 2011
Pioneer Cement
Cherat Cement
Kohat Cement
RETURN ON ASSETS
106
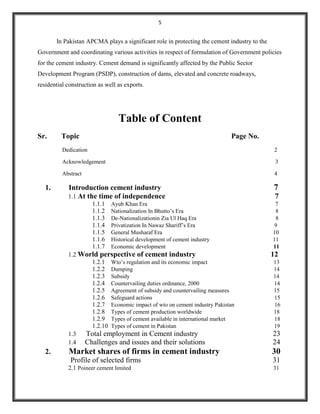
4.4.5. RETURN ON EQUITY (ROE) RATIO:
In real sense, ordinarily shareholders are the real owners of the company. They assume the
highest risk in the company. (Preference share holders have a preference over ordinary
shareholders in the payment of dividend as well as capital. Preference share holders get a fixed
rate of dividend irrespective of the quantum of profits of the company). The rate of dividends
varies with the availability of profits in case of ordinary shares only. Thus ordinary shareholders
are more interested in the profitability of a company and the performance of a company should
be judged on the basis of return on equity capital of the company. Return on equity capital which
is the relationship between profits of a company and its equity, can be calculated as follows.
COMPONENTS:
Equity share capital should be the total called-up value of equity shares. As the profit used for
the calculations are the final profits available to equity shareholders as dividend, therefore the
preference dividend and taxes are deducted in order to arrive at such profits.
SIGNIFICANCE:
This ratio is more meaningful to the equity shareholders who are interested to know profits
earned by the company and those profits which can be made available to pay dividends to them.
Interpretation of the ratio is similar to the interpretation of return on shareholder's investments
and higher the ratio better is.
RETURN ON EQUITY RATIO (ROE)
Formula
[(Net profit after tax − Preference dividend) / Equity share capital] ×
100
Years 2015 2014 2013 2012 2011
Pioneer Cement -7.80% -4.46% 29.11% 20.48% 77.81%
Cherat Cement 1.08% 29.77% 54.70% 77.04% 80.08%
Kohat Cement -9.55% 2.09% 34.58% 35.73% 42.09%
107
ANALYSIS:
In 2011 Pioneer cement company return on equity ratio is at highest point and better, in 2012 it
decreases and in 2013 it is better than 2012 but in 2014 and 2015 it goes down and become
negative. Kohat Cement Company also shows decreasing trend it is highest point in 2011 and
then decrease in 2012 to 2014 and it becomes negative in 2015. Cherat cement company return
on equity ratio has mix trend in 2011 it is at lower side and then it increase in 2012 and it
decrease in 2013 and it goes down and become negative in 2014 and 2015.
-20.00%
-10.00%
0.00%
10.00%
20.00%
30.00%
40.00%
50.00%
60.00%
70.00%
80.00%
90.00%
2015 2014 2013 2012 2011
Pioneer Cement
Cherat Cement
Kohat Cement
108
4.4.6. DEBT RATIOS:
A company can finance its assets either with equity or debt. Financing through debt involves risk
because debt legally obligates the company to pay interest and to repay the principal as
promised. Equity financing does not obligate the company to pay anything -- dividends are paid
at the discretion of the board of directors. There is always some risk, which we refer to as
business risk, inherent in any operating segment of a business. Financial leverage ratios are used
to assess how much financial risk the company has taken on. There are two types of financial
leverage ratios: component percentages and coverage ratios. Component percentages compare a
company's debt with either its total capital (debt plus equity) or its equity capital. Coverage ratios
reflect a company's ability to satisfy fixed obligations, such as interest, principal repayment, or
lease payments.
Debt to Equity Ratio:
Debt-to-Equity ratio indicates the relationship between the external equities or outsiders funds
and the internal equities or shareholders funds. It is also known as external internal equity ratio.
It is determined to ascertain soundness of the long term financial policies of the company.
Debt to Equity Ratio:
Formula
Total Long Term Debts / Shareholders Funds
Years 2015 2014 2013 2012 2011
Pioneer Cement 31:69 52:48 48:52 52:48 86:14
Cherat Cement 13:20 39:50 1:9:50 1:51:100 37:50
Kohat Cement 67:33 55:45 10:90 10:90 22:78
109
ANALYSIS:
Pioneer cement debt to equity ratio is higher point in 2011 and after that it has improved its
situation in next coming years and decreases, but Kohat shows increasing trend from 2011 to
2015 which shows that they increasing their debts for expansion of project and their short and
long term debts increased. Cherat computation of the ratio brings to life the fact that Cherat
cement has not been able to feed its financing through equity as its ratios are considerable higher
than the favorable“ 1 or less”. The initial year shows that there was less dependency of debt but
there has been a visible increase in the ratio ever since, the last year shows a phenomenal
increase and highly unfavorable. The firm must by all means try and reduce its portions as the
dependency on debt causes the firm to lose its control and will over the organization as it is then
driven to feed the debt.
0
0.5
1
1.5
2
2.5
3
3.5
4
2015 2014 2013 2012 2011
Pioneer Cement
Cherat Cement
Kohat Cement
110
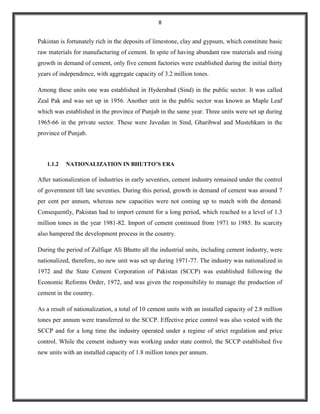
4.4.7. DEBT SERVICE RATIO OR INTEREST COVERAGE RATIO:
Interest coverage ratio is also known as debt service ratio or debt service coverage ratio. This
ratio relates the fixed interest charges to the income earned by the business. It indicates whether
the business has earned sufficient profits to pay periodically the interest charges.
SIGNIFICANCE OF DEBT SERVICE RATIO:The interest coverage ratio is very important from the
lender's point of view. It indicates the number of times interest is covered by the profits available to pay
interest charges.
Formula Net Profit Before Interest and Tax / Fixed Interest Charges]
Years 2015 2014 2013 2012 2011
Pioneer cement 0.39 0.31 5.73 4.26 3.03
Cherat 0.30 4.27 9.94 21.10 30.96
Kohat Cement -4.71 1.23 20.21 25.17 17.22
INTEREST COVERAGE RATIO
111
ANALYSIS:
Interest Cover Ratio shows that how many times interest is earned by the company. Pioneer
cement company shows increasing trend from 2011 to 2013 which indicates positive sign and
beneficial for the company and it has availability of the funds to pay interest expense. In 2014
and 2015 it goes down which means it is not good sign for the company to pay the interest
expense. Kohat Cement Company and Cherat Cement is in better position to Cherat and pioneer
cement, In year 2012 Kohat Cement earned 17.22 times interest which is higher among all year
and easy to pay the interest expense. In 2014 and 2015 Interest cover ration of all the company is
not very healthy and it shows that the financial costs are very high and earnings are very low.
Management must look into the matter and should improve this ratio. Cherat cement was able to
very comfortably cover this cost in the early years but by its growth the inabilities started to
show although revenues are rising but the interest charges to be paid by the enterprise are also
rising as the revenues are only resulting due to the rising financing through debt. The debt,
especially the short term financing, needs to be curtailed as they will not result in Cherat
Cement‟s well being.
-10
-5
0
5
10
15
20
25
30
35
2015 2014 2013 2012 2011
Pioneer cement
Cherat
Kohat Cement
112
4.5. GENERAL RATIO ANALYSIS
4.5.1. PROFITABILITY ANALYSIS:
According to the scenario, the cement sector is experiencing strong growth in cement dispatches,
but at the same time, is facing decline in profitability during 2015. Although the sales volume in
the sector increased, the net sales revenue did not increase as much due to decrease in net
retention. Over the years all cement manufacturers undertook huge capacity expansion plans
which have now created a situation of excess supply in the local market. Companies resorted to
price wars and this led to a fall in prices. As per the industry trend of declining profitability,
Pioneer Cement also posted an overall loss of 179 million in 2015. The Profitability ratios of
Pioneer Cement indicate that Pioneer, like many other companies in the cement sector, has been
plagued by lower earnings. The gross profit margin fell drastically in 2014 and fell slightly in
2015 as well. Pioneer's rising operating expenses and finance costs have led negative net profit
margin. Similarly return on assets and return on equity have also fallen. The prices of imported
coal had shot up during the last fiscal year and caused a major rise in the cost of production.
Crude oil prices had also seen an extraordinary rise last fiscal year. As fuel costs are the largest
portion of production costs of the Pioneer Cement, the price increase had deeply hit the
profitability of the company in 2015. For Pioneer Cement, the prices of packaging material went
up and formed 14% to total production costs. Fuel and electricity costs form 60% of the cost of
sales and higher electricity tariffs and fuel costs affected the earnings of the company in
2015.The cost of production went up due to rise in the prices of imported coal. Company had an
impact of Rs 149 million on earnings due to devaluation of rupee against the US dollar and
Japanese yen in the form of exchange losses. Financial cost also increased due to higher interest
rates in the economy. The profitability ratios indicate that Pioneer Cement, like many other
companies in the cement sector, has been weighed down by lower earnings. Pioneer's rising
operating expenses and financial costs have led to negative impact on the net profit margins.
Similarly, return on assets and return on equity have also fallen.
113
4.5.2. LIQUIDITY ANALYSIS:
The liquidity position of the company has been weakening over the years, due to substantial rise
in the current liabilities. Pioneer felt a liquidity crunch, like many other companies in the cement
sector due to the price war and losses caused by that in 2015. The current liabilities of Pioneer
have also increased to Rs 2.987 billion during 2015, backed mainly by increased short-term
borrowings by the company. To solve the liquidity problem, Pioneer has initiated a process of
restructuring its debt by issuing Sukuk of Rs 2.5 billion in 2015.
This will help the company to liquidate its excessive current liabilities. It will also help to control
company's finance costs. Also, Pioneer will issue shares to the National Bank of Pakistan due to
its inability to pay its loans. This restructuring would give a breather to the company whose
current ratio was steadily moving downhill.
During 2015, the composition of current assets changed such that the most liquid assets: cash and
bank balances constituted 18%, trade debts 5% and inventory 9% of total current assets. Stores,
spares and tools are highly illiquid assets and they form a major portion of the company's current
assets. Industry‟s position, though not ideal, is at least much better than the Pioneer Cement. In
fact, it is the only company in the cement sector, which has the liquidity ratio of below 0.5.
4.5.3. DEBT ANALYSIS:
The debt to assets ratio depicts how Pioneer Cement financed. Each year, the company is being
increasingly financed by equity rather than debt. In 2011, debt financed 87% of assets while in
2015 debt only contributed to 56% of the total assets. The company's debt to asset ratio has not
fluctuated much because over the years because assets and liabilities have grown more or less in
the same proportions.
The debt to equity ratio fell during 2012 and 2013 indicating that the company was financing its
growth by equity. In 2012, the equity of the company rose by 197% while liabilities increased
only by 11%. In 2014 the equity fell as the reserves fell owing to the loss made during that fiscal
year. This caused a slight increase in Debt to Equity ratio in 2014. In 2015 the debt to equity
ratio has declined owing largely to a fall in the debt. The company is trying to restructure its
financing composition in favor of equity by issuing Sukuk financing and convertible loan into
114
equity. This will reduce the current liabilities in the future. In the wake of rising interest rates in
the economy, this strategy will prove to be beneficial for Pioneer in the future. The average
price/share fell during 2014 to Rs 31.78 and in 2015, it remained around Rs 31.84. The share
prices declined due to the losses incurred during both the fiscal years.
4.5.4. ASSETS:
The asset management of the company seems to be quite effective during 2015 as the operating
cycle of Pioneer decreased to 9 days from 23 days in 2014. The operating cycle, however, has
reduced due to faster sales turnover while days to collect trade debt remained the same in 2015.
The days to sell the average inventory were 19 days in 2014 whereas in 2015 it took the
company only 6 days to sell its inventory.
115
5 SWOT ANALYSIS OF CEMENT INDUSTRY
5.1 STRENGTHS
ORGANIZED SECTOR:
Cement industry is a highly organized sector. The total number of cement plants in Pakistan is
25. The industry is highly capital intensive. The capital cost of 2000tons/day plant ranges
between Rs.3 billion to Rs.4 Billion. Thus only experienced and big players enter this industry.
HIGH QUALITY:
Cement produced in main companies is of good quality. It is of attraction for export, and for
high-importance projects.
116
EXPANSION:
Currently almost all of the cement plants are undergoing conversion and expansion plans.
Capacity expansion of 13million tons will go online between FY05-FY09. Most of the
companies are going to benefit from economies of scale after expansion.
CAPACITY UTILIZATION:
The capacity utilization for the sector also improved to 91.32 per cent from 89 per cent last year.
Cement exports during the said period have increased by 40 per cent while the local cement
dispatches have grown by 18 per cent.
GOVERNMENT POLICIES:
Financial sector reform, increase in worker remittance, higher government infrastructure
spending and fiscal incentive for the housing sector will serve as catalyst for higher growth.
During the last two years, the Public Sector Development Programme has been considerably
enhanced and this has coincided with greater demand for cement from the private sector largely
for construction activities in the housing sector.
PUBLIC SECTOR DEVELOPMENT PROGRAM:
During the last two years, the Public Sector Development Program has been considerably
enhanced and this has coincided with greater demand for cement from the private sector largely
for construction activities in the Housing sector.
LOW TRANSPORTATION COSTS AND ENERGY EFFICIENCY:
Pakistan is having competitive edge of low transportation costs and energy efficient plants.
117
ECONOMIC GROWTH:
Cement industry has a direct link to the economic growth of the industry. Better roads, airports,
proper canal lining and sea ports form major infrastructure for every industry.
5.2 WEAKNESSES
ECONOMIES OF SCALE:
In the Gulf countries, the average plant size is 1.6m mtpa while in Egypt, it is over 3m mtpa. The
relatively small size of individual cement factories in Pakistan suggests that a significant
capacity is currently unable to benefit from the economy of scales.
HIGHER MAINTAINANCE COST:
Majority of the companies have plants of Chinese origin. They have a higher long-term
maintenance costs, as compared to western plants.
FULL-CAPACITY UTILIZATION:
Almost all the companies are already running at full capacity. Therefore, any hike in demand in
form of construction of dams or infrastructure will not be met. Thus resulting in major shortfall.
CONCENTRATION OF PLANTS IN NORTH:
Majority of the plants are located in the northern region, mainly in NWFP. Thus any
development in the southern region is mainly augmented by northern region plants. This results
in higher transportation costs.
118
NON-COOPERATION OF GOVERNMENT:
There is non-cooperative gesture of the government.
CEMENT PRICES:
Cement prices in the international market are very tight, looking at the prevailing demand.
EXCISE DUTY:
The government has not taken any step for abolishing excise duty on cement items, which is
clearly negating of the achievement of lowering prices for the public and for development
activities.
UNLIMITED IMPORTS:
It is quite contrary to APCMA‟s recommendations of allowing import of cement up to 500,000
metric tons on confessional basis as a buffer stock. The government has permitted unlimited
imports, which can provide roots for damaging the domestic industry if neighboring countries
start dumping the commodity into our markets
5.3 OPPORTUNITIES
INFRASTRUCTURE DEVELOPMENT IN PAKISTAN:
According to the “Medium Term Development Framework”, the government will gradually
increase its allocation for the Public Sector Development Program from Rs272b to Rs597b in
FY'10, which is likely to generate further demand in coming years.
119
Construction of large dams, mainly KALABAGH, BASHA-DIAMER, MUNDA, AKHORI,
KURRAM TANGI, NAI GAJ, and SKARDU, is going to require huge amounts of cement. It is
estimated that these dams will require around 15 to 20 mn MT of cement.
PER CAPITA CONSUMPTION:
Pakistan‟s per capita cement consumption is amongst the lowest in the region. The government
has started massive spending on infrastructure development- road construction and water
management measures etc., which was the neglected area in late 1990s due to deteriorated
balance of payment conditions of the country. The country used to spend a major part of the
budget on debt servicing that left no room for development expenditures. The situation has
almost reversed now. The per capita consumption is expected to increase phenomenally in
coming years, as a result.
POTENTIAL IN SOUTHERN REGION:
At present, 80% of the consumption is at the Northern Region. There lies a huge potential for the
cement companies in the Southern region, specially in Karachi and Gawadar.
EXPORTS; PRESENT AND POTENTIAL:
There is lies a huge potential for export of cement. Can export to Middle-East on large scale
through Karachi sea port, after construction of cement export terminal, expected to be offered on
BOT by GOP.
120
India is also a huge market for Pakistani cement. A lot of expansion is going on in India. With
relationships getting better, it is anticipated that Pakistani Cement companies will be able to gain
a huge market in the shape of India. Presently some of the cement companies from Pakistan are
exporting cement to Afghanistan, Iraq and UAE only to maintain their presence in these markers.
After completion of major expansion plans in Pakistan in 2014, there would be surplus to export
in these markets.
5.4 THREATS
CLYNICAL NATURE OF BUSINESS:
Cement being a pure commodity business, the industry is prone to cyclical nature of demand of
cement.
DELAY IN CONSTRUCTION OF DAMS:
Dams are a major source for the cement industry. Due to political instability and inconsistency of
policies, the construction of dams is being delayed. This will dent demand of cement in short
run.
POLITICAL INSTABILITY:
This threat is true for all the industries. Political instability has harmed industry for over two
decades, and it seems as if this will continue for some time.
121
MONOPOLY CONTROL AUTHORITY:
A big threat to cement industry is the onging tussle between the cement manufacturers and the
Monopoly Control Authority. The Authority is being given increased regulatory powers, and it is
exercising more aggressive price controls.
IRANIAN CEMENT INDUSTRY:
Currently Pakistan is a major exporter to Afghanistan, and it is also aiming at exporting to
Middle-Eastern countries. However, it should be noted that Iran is going to enter these markets
soon. Its cement industries, which are currently focusing on internal development, will soon
compete in international market.
6 CONCLUSION
The company underwent many expansion plans due to which its capacity was increased to 2350
tons per day in 2012 and in 2013 a new production line of 4300 tons per day clinker capacity
started production. Its shares are quoted on all the three stock exchanges of the country. It is a
part of the Noon group, which holds the majority stake of 60% in the company, followed by a
leading brokerage house, First National Equity Limited (FNE) 9% shareholding. Financial
institutions, insurance companies and the general public, hold the rest of the shareholding.
Pioneer is involved in the manufacturing and marketing of cement. Its products include ordinary
Portland cement, suitable for concrete construction and sulphate resistant cement, ideal for
construction in or near sea. Thus, the company's sulphate resistant cement is highly preferred in
important projects such as the Thai Greater Canal project. PIOC's products are sold under the
brand name of 'Pioneer Cement' and it was the winner of "Brand of the Year Awards 2013" in
cement sector in the national category.
122
Pioneer Cement is ISO 9001:2000 QMS and ISO: 14001:2011 certified. It meets local as well as
international quality standards. Pioneer Cement produces and sells used coal and cement
domestically and internationally.
The cement sector had shown an impressive growth of 24.3% in the cement dispatches during
2015, owing to a strong demand in the local market and supply deficits in the regional markets.
The major boost had come from the export sales (a growth of 142%) while local cement
dispatches grew nominally by 6.5%.exports showed a growth of 59.5% and export market share
rose from 21.5% in 2015 to 34.1% .
However, there is no reflective true performance of Cherat against its competitors; EPS remained
above the industry average. Lower value of outstanding number of shares rather than a high net
income is mainly responsible for the mentioned trend. The same argument holds true for the
higher than average book value per share as well. It has a declining trend. This again can be
attributed to shareholder pattern of the company. The outlook for local demand growth for
Cherat remains positive as a number of mega housing projects are in their initial stages whereas
the government has also started a lot of infrastructure developments projects and might even go
for mega water reservoir projects in the future. This would keep the demand upbeat. Earthquake
reconstruction in the Northern Areas further strengthens the demand growth.
Whereas for the Kohat Cement Company, by going forward, with additional capacities coming
on line, the gross margins are likely to decline. However, they are expected to sustain at a
reasonable level, allowing a comfortable profitability and cash flow levels for the industry, even
at low capacity utilization levels. As Kohat Cement Company is going under sustainable capacity
expansion, relative to its existing size, its market share in the production sharing arrangement is
expected to increase, signifying ability to achieve higher sales volumes even at low capacity
utilization. They should increase the overall profitability of the company as compare to its
competitors.
123
7 RECOMMENDATIONS
These are the recommendations that can be implemented in the cement industry to reinforce its
success:
GOVERNMENT’S ROLE:
There are many players in the industry that are not functioning efficiently. There needs to be
certain minimum requirements that should be fulfilled by the manufacturers. The government
can give deadlines to the manufacturers for implementing those measures, which if not
implemented, will lead to the closure of the companies. These minimum requirements can be
conversion to low-cost coal powered plants.
The government can initiate more infrastructure projects to develop the country and, in turn,
developing the industry.
The government should strengthen its regulatory framework and regulatory body Monopoly
Control Authority (MCA) to look into malpractices of cartel-forming as is the case with the All
Pakistan Cement Manufacturers Association (APCMA). The government has to get costing data
on cement industry from independent sources and strictly implement its anti-trust law.
There should be more reductions in the government levies to make the industry more competitive
in the export market.
Government should take any step for abolishing excise duty on cement items, which is clearly
negating of the achievement of lowering prices for the public and for development activities. It is
124
incomprehensible that excise duty has been imposed on cement, which is being produced in the
country in abundance.
TECHNOLOGY:
The industry is dominated by a few giants along with relatively smaller players. Thus, these
giants need to get involved into more research and development to come up with new varieties of
cements, different production methods and other such innovations.
Material sciences are developing rapidly the world over, and advanced construction materials are
being produced, in particular, for enhancing quality, strength and efficiency in the concrete
construction. The industry should, therefore, make investment in advanced cement technologies,
over short and long term horizons, in the wake of recent destruction due to earthquake
TRANSPORT SECTOR
Just as the transport sector of China uses cement in road construction rather than asphalt,
Pakistan can also implement the same. With more and more road development, the industry
would also benefit.
FUEL COST
Cement industry is highly energy intensive and fuel cost constitutes about 30 per cent of the total
cost of cement manufacturing. If all the cement plants switchover to coal and capacity utilization
remains the same, the industry will be able to save over Rs 5 billion annually.
125
EXPORTS
It takes around three days for a single ship to be loaded with cement for export. If this ship
loading/unloading time could be reduced, we would be better able to handle the exports more
quickly.
There should be easy and quick procedures at the ports to facilitate the cement exporters with the
process.
VISION
The industry needs to have a long-term vision. It is essentially important for it also to adopt
measures to reduce its present production cost further by improving production efficiency,
conserving energy and employing advanced techniques, such as installation of advanced process
controls and developing bulk handling system.
PRICING
In order to be competitive, the industry is required to arrest the price increase trend, as cement
production cost would reduce as a result of economical expansions of various existing units.
A schedule for maintenance should be prepared. In house dust emission measurement i.e.
intensive monitoring of Bag-House-Filters should be carried out to gain more information about
its effectiveness.
BAG FILTERS
High temperature resistant fabric material like Nomex should be used in filters of Clinker Bucket
Conveyor to prevent the burning of bag fabric from hot Clinker particles, which results in small
holes in bag fabric. The cost of Nomex fabric is approximately two times higher than polyester
needle filter.
126
WASTE MANAGEMENT
Improvement in maintenance is to prevent spillage and leakage- by making an inventory for the
leakage/spillage, and investigating the cause of leakage and accordingly planning the
maintenance. Improved recycling of the collected spillage – e.g. through implementing a chute
system, collecting dust at a special recycling point, removing metal scrap with a magnetic
separator. Re-cycling of Cr-containing refractory bricks in cement production instead of selling
them to the downstream use – after crushing the Chromium-bricks in the Crusher it should be
used as raw material, this will prevent the dispersion of toxic waste.
PERSONAL PROTECTION EQUIPMENT
To control and minimize the risks at the workplace, it‟s necessary that structural attention be
paid to safety. Although some system exists with regard to Occupational Health & Safety (OHS)
in most of the cement plants, it requires refinement with identification of reasons of
the accident and suggesting measures to avoid such happenings in future. Following steps should
be specially looked into.
Exposure to Health Risks:
The health risks of working in a cement plant are associated with working with rotary
equipment, the inhalation of dust, exposure to noise and vibration. Besides these risks, the people
working in the quarry are exposed to the risks of working with explosives. The management
should define procedures on explosive handling and other precautions during blasting. Following
measures are recommended to the Management of cement plants for prevention of production
area accidents in the factory.
127
REGULATORY FRAMEWORK
Sector is not regulated properly and environmentally harmful practices such as using cheap coal
as fuel go unchecked. Vested interests are the reason for inconsistent policies; government tends
to ignore any social agitation. For the cement sector, a proper regulatory framework for pricing
as well as keeping a check on environmentally harmful practices should be adopted .Government
should take care of not allowing low grade cement to be imported, which if used could endanger
the stability of load bearing structures in view of its lower strength.
EXPLORING NEW MARKETS
Major buyers of cement had been Afghanistan and Middle Eastern countries. If government
takes pro-industry steps, the volume of cement exports can increase substantially besides
capturing various new markets
TRANSPORTATION COSTS
There is an increase in transportation and energy costs which has impact on the cost of
production of cement. And the hike in truck rates for carriage of coal from Karachi to the
upcountry and for general distribution of cement to the various urban markets from the plants
mostly located in the rural areas. So it is recommended that the ministry of railways to provide
wagons on priority to cement units so that pressure on the truck and road network may be
reduced.
128
8 BIBLIOGRAPHY
REFERENCE & SOURCES USED
 Pioneer Cement Company limited (PCCL) website (www.pioneercement.com). Retrieved: June,
03, 2010: 08:52 PM

 Kohat Cement Company (KCC) website (www.kohatcement.com): Retrieved: June, 04, 2010:
09:36 PM

 All Pakistan Cement Manufacturing Association (APCMA). www.apcma.com: Retrieved: June,
04, 2010: 10:22 PM
 Earthtrends (2003), „„Climate and atmosphere – Nigeria‟‟, available at: http://earthtrends.wri.org
(accessed 13 June 2011).
 Fleishman-Hillard (2013), Rethinking CSR: A Fleishman-Hillard/National Consumers League
Study, Fleishman-Hillard, St Louis, MO.
 Frederick, W. (1994), „„From CSR1 to CSR2‟‟, Business and Society, Vol. 32 No. 2, pp. 150-64.
 Frooman, J. (1999), „„Stakeholder influence strategies‟‟, Academy of Management Review, Vol.
24 No. 2, pp. 191-245.
 Hassanein, A., Lundholm, G., Willis, G. and Young, C. (2014), CSR and the Canadian
International Extractive Sector: A Survey, The Canadian Centre for the Study of Resource
Conflict, Revelstoke.
 Hess, D., Rogovsky, N. and Dunfee, T.W. (2002), „„The next wave of corporate community
involvement‟‟, California Management Review, Vol. 44 No. 2, pp. 110-25.
129
 Ite, U.E. (2011), „„Multinationals and corporate social responsibility in developing countries; a
case study of Shell in Nigeria‟‟, Corporate Social Responsibility and Environmental
Management, Vol. 11 No. 1, pp. 1-11.
 Ite, U.E. (2014), „„Changing times and strategies: shell contribution to sustainable development in
the Niger Delta, Nigeria‟‟, Sustainable Development, Vol. 15, pp. 1-14.
 Iyawe, V.I., Ebomoyi, M.I.E., Chiwuzie, J.C. and Alakija,W. (2000), „„Some factors which may
affect blood pressure in Nigerian cement factory workers‟‟, African Journal of Biomedical
Research, Vol. 3 No. 2, pp. 117-21.
 Ahuja, I.P.S. and Khamba, J.S. (2015), “An evaluation of TPM initiatives in Indian industry for
enhanced manufacturing performance”, International Journal of Quality & Reliability
 Management, Vol. 25 No. 2, pp. 147-72.
 Ahuja, I.P.S. and Kumar, P. (2009), “Reviews and case studies a case study of total productive
 maintenance implementation at precision tube mills”, Internal of Quality in Maintenance
 Engineeing, Vol. 15 No. 3, pp. 241-58.
 Al-Habaibeh, A. and Parkin, R.M. (2012), “An evaluation of a heat transfer process using sensor
fusion of thermocouples and infrared thermography”, Proceedings of the International
 Conference on ConditionMonitoring 2012, KingsCollege,Cambridge,UK, pp. 229-33.
 Al-Habaibeh, A., Cai, R., Jackson, M.R. and Parkin, R.M. (2011), “Modern development in
sensor technology and its applications in condition monitoring”, Invited Keynote Paper, abstract
accepted for the 7th International Conference on Monitoring and Automatic Supervision in
Manufacturing, Zakopane, 19-21 August.
 Al-Habaibeh, A., Parkin, R.M., Jackson, M.R., Whitby, D.R., Mansi, M. and Coy, J. (2002), “The
application of an autonomous low cost infra-red thermal imager for condition based
 maintenance of machinery”, Proceedings of the Mechatronics 2002 Conference, Enschede,
 The Netherlands, June.
130
 Al-Muhaisen, M. and Santarisi, N. (2002), “Auditing of the maintenance system of Fuhais
 plant/Jordan Cement Factories Co”, Journal of Quality in Maintenance Engineering, Vol. 8
 No. 1, pp. 62-76.
 Alsyouf, I. (2009), “Maintenance practices in Swedish industries: survey results”, International
 Journal of Production Economics, Vol. 121, pp. 212-23.
 Bamber, C.J., Sharp, J.M. and Hides, M.T. (1999), “Factors affecting successful implementation
of total productive maintenance – a UK manufacturing case study perspective”, Journal of
Quality in Maintenance Engineering, Vol. 5 No. 3, pp. 162-81
 www.dailytimes.com.pk
 http://www.cpp.org.pk/etpibrchr/cement-brochure.pdf.
 www.nation.com.pk
 www.businessplus.tv/Programme/pdf/Pioneer%20Cement%20Report.pdf.
 AKD Research report on Cement sector (February 2014)
 Ismail Iqbal securities (Pvt) Ltd report on Cement sector
 www.pakistan.gov.pk/ministries/yearbook0506.pdf
 www.wikipedia.com
 www.dawn.com
 http://www.jang.com.pk/thenews/investors/aug2011/if.htm
 http://www.researchandmarkets.com/reportinfo.asp?report_id=300358
 http://www.dawn.com/2012/10/24/ebr8.htm

Final project Report on cement industry

  • 1.
    1 Subject Project Topic Financial Analysis OfCement Industry Submitted To, Sir Umer Iqbal Siddiqi Submitted By, Muhammad Imran (3009) Mudassar Nazar (3015) Muhammad Asif (3021) Group Leader, Mudassar Nazar (3015) Class B.B.A 8th (Evening)
  • 2.
    2 Dedication Dedicated to Our dearand near, those who always help us when we need them and give us the lesson of encouragement to say that, “A winner is one who accepts his failures and mistakes, picks up the pieces, and continues striving to reach his goals”. We are very thankful to our respected teacher and also dedicate our this project to our teacher,
  • 3.
    3 Sir Umer Siddiqi 2.Acknowledgement Firstly we would like to pay our deep thanks to Allah Almighty who gave us the strength and ability to make this project report. Next we owe our bottomless thanks to our respected teacher SIR UMER IQBAL SIDDIQI who directed us well and was always available to clear our doubts and misunderstanding. We wish to thanks to our friends for suggestions and critical review of the manuscript. Thank You
  • 4.
    4 3. ABSTRACT The purposeof this research report is to evaluate, analyze and compare the financial statements of Pioneer Cement Comparison with Kohat & Cherat Cement comparative analysis. We have chosen these three companies on the basis of their financial performance, they are also listed on all major stock exchanges of the country. After researching, surveying, observing, collection of data, we have arrived at the written analysis follows hereafter. As the requirement of the report, We have conducted a detailed study of the analysis the financial statements and ratios. On the basis of above information, We have arrived on specific recommendations from strategic management‟s viewpoint. We have supported suggestions through strategic theories, matrices and exhibits, present in the report. The report includes the whole financial status of both the companies through which a reader can get the financial strengths & weakness of both the organizations. The fundamentals of the research is to build the reader‟s capability to evaluate the financial data & information into projective manner as to compare the financial stability & growth with each other in consequence either for enhancement & for decrement. Pakistan currently has a per capita consumption of 120kg of cement, which is comparable to that for India at 135kg per capita but substantially below the World Average 270kg and the regional average of over 400kg for peers in Asia and over 600kg in the Middle East. Over the years a number of tax policy and administrative measures have been introduced to attract investment and facilitate growth of the cement industry. The Government has reduced central excise duty (CED) on cement in the budget for 2011-12 in order to boost construction activity.
  • 5.
    5 In Pakistan APCMAplays a significant role in protecting the cement industry to the Government and coordinating various activities in respect of formulation of Government policies for the cement industry. Cement demand is significantly affected by the Public Sector Development Program (PSDP), construction of dams, elevated and concrete roadways, residential construction as well as exports. Table of Content Sr. Topic Page No. Dedication 2 Acknowledgement 3 Abstract 4 1. Introduction cement industry 7 1.1 At the time of independence 7 1.1.1 Ayub Khan Era 7 1.1.2 Nationalization In Bhutto‟s Era 8 1.1.3 De-Nationalizationin Zia Ul Haq Era 8 1.1.4 Privatization In Nawaz Shariff‟s Era 9 1.1.5 General Musharaf Era 10 1.1.6 Historical development of cement industry 11 1.1.7 Economic development 11 1.2 World perspective of cement industry 12 1.2.1 Wto‟s regulation and its economic impact 13 1.2.2 Dumping 14 1.2.3 Subsidy 14 1.2.4 Countervailing duties ordinance, 2000 14 1.2.5 Agreement of subsidy and countervailing measures 15 1.2.6 Safeguard actions 15 1.2.7 Economic impact of wto on cement industry Pakistan 16 1.2.8 Types of cement production worldwide 18 1.2.9 Types of cement available in international market 18 1.2.10 Types of cement in Pakistan 19 1.3 Total employment in Cement industry 23 1.4 Challenges and issues and their solutions 24 2. Market shares of firms in cement industry 30 Profile of selected firms 31 2.1 Poineer cement limited 31
  • 6.
    6 2.2 Cherat cementlimited 33 2.3 Kohat cement limited 35 2.4 Trade of union of cement industry 39 3. Financial analysis 41 3.1 Data collection 45 3.2 Ratio analysis 47 3.3 Data collection procedures 48 3.4 Analysis procedures 48 3.5 Tool of analysis 50 4. Data analysis, Result/Findind and discussion 51 4.1 Kohat cement company 51 4.1.1 Balance sheet (horizontal analysis) 51 4.1.2 Balance sheet (vertical analysis) 55 4.1.3 Income statement (horizontal analysis) 59 4.1.4 Income statement (vertical analysis) 62 4.2 Pioneer cement limited 65 4.2.1 Balance sheet (horizontal analysis) 68 4.2.2 Balance sheet (vertical analysis) 74 4.2.3 Income statement (vertical analysis) 76 4.2.4 Income statement (horizontal analysis) 82 4.3 Ratio analysis 86 4.3.1 Liquidity ratio 86 4.3.2 Current ratio 86 4.3.3 Quick ratio 89 4.3.4 Turnover ratio 92 4.3.5 Debtors turnover ratio 94 4.3.6 Total assets turnover ratio 96 4.3.7 Fixed turnover ratio 97 4.4.1 Profitability ratio 99 4.4.2 Gross profit ratio 99 4.4.3 Operating Profit Ratio 101 4.4.4 Return On assets 103 4.4.5 Return on equity ratio 105 4.4.6 Debt ratio 107 4.4.7 Debt service ratio 109 4.5 General ratio analysis 111 4.5.1 Probitability analysis 111 4.5.2 Liquidity analysis 112 4.5.3 Debt analysis 112 4.5.4 Assets 113 5 SWOT Analysis of Cement industry 114 5.1 Strengths 114 5.2 Weakness 116 5.3 Opportunities 117
  • 7.
    7 5.4 Threats 119 6Conclusion 120 7 Recommodations 122 8 Referances 127 1. HISTORY OF THE CEMENT INDUSTRY 1.1 AT THE TIME OF INDEPENDENCE The development of cement sector has made rapid strides, both in public and private sectors during last two decades. The history of cement industry in Pakistan dates back to 1921 when the first plant was established at Wah. Pakistan has come a long way since independence in 1947 when the country https://www.youtube.com/watch?v=Eh4yK1yQXcUy had inherited four cement plants having total installed capacity of 0.5 million tons, all of which were controlled from India. These units were located at Karachi, Rohri, Dandot and Wah. During the decade of 1948-58, the number of cement units increased to six. 1.1.1 AYUB KHAN’S ERA During the Ayub era the economy started to grow and the construction activities underwent a boom. In 1956 Pakistan Industrial Development Corporation (PIDC) established two plants at Daudkel and Hyderabad and subsequently more plants were established in the private sector. However these expansions that took place in 1956–66 could not keep pace with the economic development and the country had to resort to imports of cement in 1976-77 and continued to do so till 1994-95.
  • 8.
    8 Pakistan is fortunatelyrich in the deposits of limestone, clay and gypsum, which constitute basic raw materials for manufacturing of cement. In spite of having abundant raw materials and rising growth in demand of cement, only five cement factories were established during the initial thirty years of independence, with aggregate capacity of 3.2 million tones. Among these units one was established in Hyderabad (Sind) in the public sector. It was called Zeal Pak and was set up in 1956. Another unit in the public sector was known as Maple Leaf which was established in the province of Punjab in the same year. Three units were set up during 1965-66 in the private sector. These were Javedan in Sind, Gharibwal and Mustehkam in the province of Punjab. 1.1.2 NATIONALIZATION IN BHUTTO’S ERA After nationalization of industries in early seventies, cement industry remained under the control of government till late seventies. During this period, growth in demand of cement was around 7 per cent per annum, whereas new capacities were not coming up to match with the demand. Consequently, Pakistan had to import cement for a long period, which reached to a level of 1.3 million tones in the year 1981-82. Import of cement continued from 1971 to 1985. Its scarcity also hampered the development process in the country. During the period of Zulfiqar Ali Bhutto all the industrial units, including cement industry, were nationalized, therefore, no new unit was set up during 1971-77. The industry was nationalized in 1972 and the State Cement Corporation of Pakistan (SCCP) was established following the Economic Reforms Order, 1972, and was given the responsibility to manage the production of cement in the country. As a result of nationalization, a total of 10 cement units with an installed capacity of 2.8 million tones per annum were transferred to the SCCP. Effective price control was also vested with the SCCP and for a long time the industry operated under a regime of strict regulation and price control. While the cement industry was working under state control, the SCCP established five new units with an installed capacity of 1.8 million tones per annum.
  • 9.
    9 1.1.3 DE-NATIONALIZATION INZIA-UL-HAQ’S ERA During the period of General Zia-ul-Haq, 1977-88, denationalization of industrial units boosted the investments. Housing and construction industries picked up and the demand for cement increased. Thus, the number of cement units increased from 9 to 23 and finally 24. After the change in government in 1977, private sector was allowed to establish cement plants. As a result, seven projects having a capacity of 2.54 million tons were installed in private sector and simultaneously, State Cement Corporation of Pakistan also put four projects having a capacity of 1.6 million tons, enhancing the total capacity of the country to over 8.5 million tons by the end of 1990. 1.1.4 PRIVATIZATION IN NAWAZ SHARIFF’S ERA During the regime of Nawaz Sharif the industry went through major transformation. The industry was privatized in 1990 which led to setting up of new plants. The government embarked upon an ambitious privatization programme and eight units were privatized. The units working under the SCCP control are old and inefficient using 'wet process' whereas the units established in the private sector are new, efficient and use 'dry process'. With the privatization of cement units after 1990, The SCCP lost its control over the supply of cement and controlled less than 25% of the total installed capacity in the country which was shrinking with the establishment of more plants in the private sector and expansion in the privatized units. At that time there was an acute shortage of cement in the Northern areas of the country. In the first half of nineties, Pakistan had to import cement which led to the increase in cement prices exorbitantly making cement companies to earn very high profits. This tempted some of the existing units like Cherat, Pakland, Dadabhoy, Ac Wah, D.G. Khan, Maple Leaf and Kohat to go for expansion in their plants. Simultaneously, 5 more new projects with aggregated capacity of 5 million tons came on the stream. As such, production capacity went up to 16 million tons by the end of 2000. The five new units in the private sector were Pioneer (Punjab) 1994, Lucky (NWFP) 1996, Askari (NWFP) 1997, Kohat (Punjab) 1997 and Best Way (NWFP) 1998. Privatization and effective
  • 10.
    10 price decontrol in1991-92 heralded a new era in which the industry has reached a level where surplus production after meeting local demand is expected in 1997. 1.1.5 GENERAL MUSHARRAF’S ERA In the year 1999-2000 the cement industry survived from its earlier crisis of excess production and low demand and resultant under cutting and unhealthy competition. It came out of red because of joint strategy to tailor production to the market requirements. This helped the industry to achieve a price level which not only covered the cost of production but also left some margin of profit to the manufacturers. This agreed sale price was also accepted by the consumers. The industry is again on the war-path against its own members. The dispute arose in Sept. 2000 when the government levied sales tax on the cement industry. Immediately after, however, the government allowed 4 cement units established in the NWFP and Baluchistan extension from payment of sales tax till June 2001. The remaining 19 cement plants operating in Punjab and Sind who were bound to pay sale tax amounting to about Rs. 20 per bag, could not compete with the four privileged one. These four units Best Way, AWT Cement, Lucky Cement were allowed sales tax exemption under an SR0 issued between 1992 and 96 allowing tax exemption to all industrial units set up in NWFP & Baluchistan. The present government allowed this exemption to only cement industries located in these areas till June 2001.
  • 11.
    11 1.1.6 HISTORICAL DEVELOPMENTOF CEMENT INDUSTRY  1947(Bad era): Only four units were producing grey cement in the country.  1948-58: The number of cement units increased to six  1958-68(Boom era/Ayub era): The cement units increased from 6-9  1971-77(Nationalization/Bhutto era): No new units were setup  1977-78(Denationalization): Cement units increased from 9 to 23  90‟s(Dark era /Cement sector had to bear massive losses): 24 units  Current scenario: 29 players are operating Table: 1 Historical development of cement industry 1.1.7 ECONOMIC DEVELOPMENT The contribution of cement industry in the economic development can be measured by the value addition of the cement industry to Gross Domestic Product of the country, creation of employment opportunities, receipts from exports, tax payments, and the entire revenue generated by the cement industry. The cement industry of Pakistan is one of the major industries of Pakistan which have an enormous impact on the economic development of the country. The contribution of cement industry is very effective not for only the manufacturing sector but also for the entire economic development of Pakistan. The cement industry of Pakistan was once a very small industry but it rapidly grew with the passage of time and finally it entered in the export market. The cement industry contributes in the Gross Domestic Product (GDP), it creates employment opportunities for thousands of people and it creates huge revenue for the government in the form of taxes. It directly and indirectly contributes in the economic development of Pakistan. It also makes contribution in the development of its allies industries
  • 12.
    12 especially the transportationsector is largely benefitted by it. The cement industry of Pakistan attracted not only domestic investors but also foreign investors. Figure 1 1.2 WORLD PERSPECTIVE OF CEMENT INDUSTRY The international cement market is one of the least regulated markets on an international scale whereas international cement trade has been growing intensively in recent decades. While the amount of cement traded has increased, the percentage of internationally traded cement to total cement production remains in single percent digits (5% to 7%). This means that most of cement production exists to satisfy local consumption. The problem this research will explore is identifying the most critical factors required to regulate the growing market for international cement. Initial fact finding suggests that cement production has recently been concentrating in the developing world (Miller, 2009). Such increasing production of a capital-intensive (labor-saving) industry means that the impact the cement market is having on the local labor markets is low compared to the impact it is having on the capital market. Even though economic rents are considerable, cement is one of the most polluting industries: 5% of the world‟s total emission of greenhouse gases is caused by cement production (Loreti, 2015). This means that the developing world is increasingly baring the environmental burden.
  • 13.
    13 Any solution suggestedto the problems caused by the cement industry has to be composed of three crucial elements. First, it must be implemented on an international scale. Local solutions cannot solve the problem. The environmental impact of burning fuel necessary to produce cement in China, if uncontrolled, will lead to global warming because of the emission of greenhouse gases caused by the burning. The impact of global warming however is not limited to China alone but may have an extended impact on countries even as far away as South Africa. Second, the developed world has to create an incentives system that does not shift all production to areas that are less regulated. While it is desirable for European and North American countries to achieve green economies by closing down cement factories or enacting strict environmental regulations, it is a major problem when such cement production is only shifted to countries with looser environmental regulations (Miller, 2009). Third, corruption and hidden transaction costs within developing nations exacerbate the problem. Whether it is the lack of strong environmental regulations or weakly implemented competition laws, developing countries can be a haven for poor environmental control and strong cartels especially in a very high fixed cost industry such as cement (Mishkin, 2014 and Selim, 2009). Any solution that does not contain these three elements should be considered lacking. The growing production of cement calls on all countries and NGOs to begin seriously considering a global policy to solve the problems posed by this industry. An effective global policy can only be found if different actors cooperate. Being a capital-intensive industry that utilizes scarce resources to operate (such as fuel) means that governments need to keep some sort of an eye on production. Even though cement is locally produced the impact of the production is global and the presence of lucrative opportunities to shift production sites makes the industry an attractive one for governmental regulation. It is this interaction between the economic (efficiency) and the political (institutional) that calls for finding a framework for evaluating solutions that takes into account both ends. 1.2.1 WTO’S REGULATIONS AND ITS ECONOMIC IMPACT Pakistan was one of the WTO‟s members when it was established in 1995. There is a considerable impact of WTO on all sectors of Pakistan's economy. Pakistan‟s domestic industry faces problems of increased imports and unfair practices under the global trade regime. Pakistan through national legislation has come up with anti-dumping laws against dumping,
  • 14.
    14 countervailing duties lawsagainst subsidies and safeguard action laws against surge of imports in order to protect its domestic industry. 1.2.2 DUMPING A product is considered dumped if the export price is less than the price charged for the like product in the exporting country. Thus, one identifies dumping simply by comparing prices in two markets. Anti-Dumping Duties Ordinance 2000 Pakistan through Anti-dumping Ordinance, 2000 has repealed the Import of Goods Ordinance, 1983 and has given effect to WTO provisions relating to imposition of anti-dumping duties in order to offset dumping. This Ordinance has also provided a framework for investigation and determination of dumping and injury in respect of goods imported into Pakistan. The rules made by Pakistan in this regard are Anti-Dumping Duties Rules, 2001. Agreement on Anti-Dumping The Agreement on Anti-dumping elaborates the provisions of Article VI of GATT 1994. The GATT provides the right to the contracting parties to apply anti-dumping measures i.e. measures against imports of a product at an export price below its “normal value”, if such dumped imports caused injury to a domestic industry in the territory of the import contracting party. 1.2.3 SUBSIDY Subsidy contains three basic elements:  A financial contribution  By a government or any public body within territory of a WTO Member  Which confers a benefit? All three of these elements must be satisfied in order for a subsidy to exist 1.2.4 COUNTERVAILING DUTIES ORDINANCES, 2000
  • 15.
    15 The basic aimof these provisions is either to prohibit or to restrain the use of subsidies by a WTO Member that affects the interests of other Members. However, the rules permit the importing country to take remedial measures, which could take the form of countervailing duties on subsidized imports. Pakistan through Countervailing Duties Ordinance, 2000 has given effect to WTO provisions relating to imposition of countervailing duties to offset such subsidies. This has been done by providing a framework for investigation and determination of such subsidies and injury in respect of goods imported into Pakistan. The rules made by Pakistan in this regard are Countervailing Duties Rules, 2002. 1.2.5 AGREEMENT ON SUBSIDIES AND COUNTERVAILING MEASURES The Uruguay Round Agreement on Subsidies and Countervailing Measures (SCM) lays down rules on the subsidies for industrial products and on countervailing duties to counteract the effects of subsidies. Subsidies are divided into three categories; prohibited subsidies, actionable subsidies and non-actionable subsidies. Export subsidies and those contingents on the use of domestic as opposed to imported products are categorized as prohibited subsidies. However, least developed countries (LDC‟s) and developing countries with per capita income of less than $ 1,000 are exempt from this restriction and may use prohibited subsidies. Non-actionable subsidies include those for research and development, for backward regions and for environmental regions. All the remaining subsidies are actionable subsidies. 1.2.6 SAFEGUARD ACTIONS Safeguard measures are defined as "emergency" actions with respect to increased imports of particular products, where such imports have caused or threaten to cause serious injury to the importing Member's domestic industry. Safeguard Measures Ordinance of 2002  Pakistan through Safeguard Measures Ordinance, 2002 has given effect to the provisions of Article XIX of the General Agreement on Tariffs and Trade, 1994, and to the WTO Agreement on Safeguards for the imposition of safeguard measures. This has been done by providing a framework for investigation and determination of serious injury or threat
  • 16.
    16 of serious injurycaused by products imported into Pakistan. The rules made by Pakistan in this regard are Safeguard Measures Rules, 2003. Agreement on Safeguards  Whereas the agreements on anti-dumping and SCM provide remedies for domestic producers if they are hurt by unfair imports, the Agreement on Safeguards provides remedies for domestic producers injured by fairly traded imports. It allows the use of temporary protective measures but sets rules to guard against the abuse of such measures. Regulations of the other international treaties  There was increasing pressure from international governing bodies, such as the ILO and WTO and other organizations like the International Confederation of Free Trade Unions (ICFTU), with regard to the issues of labour rights, the role of unions and labour standards involving the Therefore, it is crucial for both the international community and the Pakistanis people to seek a more informed perspective on the current situation and the future engagement of the Pakistanis economy into the global economic system, as well as Pakistan‟s future economic and political reforms. 1.2.7 ECONOMIC IMPACT OF WTO ON CEMENT INDUSTRY PAKISTAN Pakistan follow must follow the role of WTO. Before WTO agreement there was a serious disconnect between the needs of the industry and the availability of special skills suited to the needs of the industry. There was no data available so that the industry could match the needs and the skills available in the domestic manpower market. It was also pointed out that the existing number of technical and vocational centers had been languishing for the past several years. These were usually run and managed by the Provincial the Governments while the provincial the Governments do not.
  • 17.
    17 Industries that haverecently developed and have become capable of competing with foreign firms are more likely to meet the challenge of increased Changing patterns of HRM in Pakistan trade and undergo restructuring to consolidate their businesses and become more competitive. The demand of Pakistani cement is expected to continue to grow at the rate of 20 per cent for about Four years to come. It may then follow traditional growth rate of seven per cent per year. Announcement of major dams will dramatically increase this demand. Deregulation after accession of Pakistan to WTO is expected to open the window of competition from cheaper markets. There may be no tariff after this deregulation on import of cement allowing its entry into Pakistan from cheaper market at lower rate. Cement from cheaper markets may also block Pakistan‟s export of cement to its neighboring countries. WTO regime will have no negative impact on the operation of the cement sector. On the other hand it is felt that WTO might offer opportunities for exporting cement/clinker to the neighboring countries. Pakistan is a signatory to the WTO and cannot keep its eyes shut to the realities. What Pakistan needs to do is to make the best of a given situation and try and develop a strategy to get maximum benefit from globalization and WTO. • The local industry now cannot be protected with the use of quotas or very high tariffs. The government needs to build a very strong network of Anti-dumping and countervailing duties to protect the local industry against the onslaught of unfair foreign competition. • The developing countries including Pakistan face problems in hiring law firms to advice on WTO related issues, which is a constraining factor in seeking relief from Dispute Settlement Body (DSU). This underscores the need to train local lawyers with WTO expertise. • Our survival lies in enhancing credibility through adoption of international quality standards, but Pakistan has a long way to go in obtaining certification of ISO‟s and other
  • 18.
    18 standards. A properpolicy is required in this direction which should involve both public and private quarters to address this issue. • Special policies are needed for sectors which are working under deletion program such as automobiles and engineering goods so that they could become efficient in shortest possible time. 1.2.8 TYPES OF CEMENT PRODUCED WORLDWIDE Cements that are used for construction are divided into two main categories based on cement properties, hydraulic or non-hydraulic. Although only certain types of cement are commonly utilized today, there are several different types of cement that can be created. Various types of cement are possible by blending different proportions of gypsum, clinker, and other additives together. Non-Hydraulic Cement Non-hydraulic cement is cement which cannot harden while in contact with water, as compared to hydraulic cement which can. When non-hydraulic cement is utilized in construction, it must be kept dry so that it will hold the structure. Due to the difficulties related with waiting long periods for drying, non-hydraulic cement is rarely used in current market. Hydraulic Cement Hydraulic cements are cements that have the ability to set and harden after being combined with water. Hydraulic cement is made mainly from limestone, certain clay minerals, and gypsum, which are burned together in a high temperature. Hydraulic cement is the main cement utilized in modern day construction. 1.3 TYPES OF CEMENT AVAILABLE IN INTERNATIONAL MARKET 1. Portland cement 2. Portland cement blend 3. Portland Blast furnace Cement 4. Portland Fly ash Cement 5. Portland Pozzolan Cement 6. Portland Silica Fume cement
  • 19.
    19 7. Masonry Cement 8.Expansive Cement 9. White blended cement 10. Colored cement 11. Very finely ground cement 12. Pozzolan-lime cement 13. Slag-lime cement 14. Super sulfated cements 15. Calcium aluminate cements 16. Calcium sulfoaluminate cements 17. Natural Cements 18. Geopolymer cements 19. Sulphate resistance cement 1.2.8.1 TYPES OF CEMENT PRODUCED IN PAKISTAN Cement industry is indeed a highly important segment of industrial sector that plays a vital role in the socio-economic development. Since cement is a specialized product, requiring sophisticated infrastructure and production location. Mostly of the cement companies in Pakistan are located near mountainous regions that are rich in clay, iron and mineral capacity. Cement industries in Pakistan are currently operating at their maximum capacity due to the boom in commercial and industrial construction within Pakistan. Although a large number of cement varieties are produced in different countries of the world, Pakistan has been producing following types of cement. 1. Ordinary Portland cement 2. Portland Blast Furnace Slag Cement 3. Sulphate Resisting Cement 4. White Cement
  • 20.
    20 1. Portland cement Itis the most popular type of cement, formerly known as Ordinary Portland Cement (OPC), CEM I. It is the cement that has been most commonly used throughout the world in building works. Figure 2: OPC 2. Portland blast furnace slag cement The Slag Cement of the Portland Blast Furnace is a type of cement that is hydraulic and is manufactured in a blast furnace. The manufacture of Portland Blast Furnace Slag Cement requires 75% less energy than that for the production of the Portland cement. The low cost of production of Portland Blast Furnace Slag Cement makes it cheaper than Portland cement. It is for this reason that in recent years, the sales of Portland Blast Furnace Slag Cement have increased. Figure 3: Slag Cement 3. Sulphate Resistance SRPC is a special type of CEM I cement. However, it is not the only sulphate-resisting cement available; various factory-made composite cements are also sulphate-resisting. SRC is specially used in sea and coastal areas as it offers greater resistance to chemical attack from sulphate and dissolved salts and alkalies present in sea and saline waters. Figure 4: SRPC 4. White Cement
  • 21.
    21 White Portland cementis a unique kind of Portland cement. It is different from ordinary Portland cement. It is of white color, instead of a dull grey one. White cement is frequently chosen by architects for use in white, off-white or coloured concretes that will be exposed, inside or outside buildings, to the public's gaze. Figure 5: White Cement CEMENT INDUSTRY CONTRIBUTION IN GDP  Cement contribution in GDP is 3.5%  Exported last year 700 million USD (47% increaed)  Pakistan has ranked 5th position in world exporter of cement  Total companies 23, 4 forigen and 3 controlled by armed forces 19 are listed in stock exchange Comparison of the industrial sector with other countries Demands Growth VS GDP Growth:  GDP growth is used as yardstick for measuring demand growth of cement. In its simplest form, the theory suggests, a strong positive correlation between GDP 0% 10% 20% 30% contribution of industries GDP growth Pakistan India Bandladesh srilanka
  • 22.
    22 growth rate andCement demand growth. High GDP growth leads to high cement consumption. The reverse is true when GDP growth declines. It is believed that cement consumption increases along with the rise in per capita income. Cement consumption is also reflective of the economic development achieved by a country. Developments in the sector: Expansion of existing capacities is in the shape of plant up gradation or setting up new production lines, is talk of the town these days. With its roots fixed on the ground of prospective demand growth in the years to come, expansion is what almost all cement manufacturers are pursuing. Annual production capacity has reached 25 million tons by June 2013 against capacity of 18.6m tons per annum in June 2012. If all the expansion plans are materializes, capacity is likely to touch 28m tons by the June 2014 & subsequently it would reach 35.7m tons in 2015. Most of the new projects or expansions are concentrated in northern region, which already captures around 77% capacity in total industry. Against 14.3m tons per annum current capacity out of total capacity, northern region‟s capacity may jump sharply to 20.7m tons per annum by 2013. While, capacity of south region is expected to reach 7.0 tons per annum against current capacity which is 4.25m tons per annum.
  • 23.
    23 The bothersome factlies on the other side of coin, that is, demand. A Big question that kills all the joy of expansion is “Will there be enough demand in the country to absorb the excess supply?” or putting it in other words “Will the recent spurt in cement demand will be sustained over the period of time?” Current stance of the cement sector: After completion of major expansion plans in Pakistan in 2014, there would be a surplus to export in regional markets particularly to China, India and Afghanistan, however in the same period Iran would also be able to approach vigorously these markets as its most of the cement plant will start to come online. Iran would get benefit in terms of price as cement prices in Iran is among the cheapest in the world as the price of cement in Iran remained in range of $20-$25 per ton. On the other hand it is expected that being the US ally, Pakistan would get most of the favor in order to keep its market share in these markets given the fact that all the construction activities in Iraq and Afghanistan would be taken by US. 1.3 TOTAL EMPLOYMENT
  • 24.
    24 The company incement sector takes their people as one of the most valuable assets, they view their human resource as the competitive advantage therefore they ensure that they employ only those people who are self-motivated and professionally qualified. They also take into consideration that their business goal are realized through such diverse work force providing equal opportunities without any discrimination on the basis of cast, creed, gender and religion. Cement industry is also serving the nation by providing job opportunities and presently more than 150,000 persons are employed directly or indirectly by the industry. 1.4 CHALLENGES AND ISSUES AND THEIR SOLUTIONS Key issues in the economy that impact cement industry  The Pakistani currency has been depreciating. This has caused a greater problem to the industries who have taken loans in the foreign exchange currencies.
  • 25.
    25  According tothe federal bureau of statistics, Pakistan hit record inflation during 2015. The SBP, in order to control the inflation, tightened the monetary policies by increasing the interest rates. The increase in the interest rates made the industries pay more interest against the long term loans that they had borrowed at lower interest rates.  The investors in the cement sector are well aware of the importance of technology in the present day and they realize the returns they can get using advance technologies. The cement factories such as D.G. cement, lucky cement and may other factories is using latest technologies. However, the old cement industries such as maple leaf are now shifting towards the new technology as well.  Main component of the cost is fuel. Pakistan's cement industry has converted their plants to coal considering it to be the cheapest fuel, but its price in international markets has gone up by more than 300 percent in the last one year, which directly relate increasing the cost of Production. Certain factors that affect the growth of cement industry are as follows:  Slow construction activities in the country badly upsets domestic sale of cement.  Higher GDP growth has positive impact on cement demand.  Reconstruction work in result of earthquake boosts construction material demand  Four large Dams (Bhasha Daimer Dam, Munda Dam, Akhori Dam and Neelum Jhelum) are announced by government. Construction of these dams will generate demand of 3.7 million tons. Proposed solution  Federal Excise Duty and GST over Cement industry should be reduced. It‟s being treated as a luxury item for the purpose of taxes and duties.  The local cement industry faces high fuel costs. The government has given incentives in order to facilitate their conversion to coal, which is widely available in the country.  High Freight charges should be reduced as it‟s affecting negatively the domestic demand of cement.  Government of Pakistan should stress on factors that increase the GDP  Government of Pakistan should do its upmost to control the instability in the country.
  • 26.
    26  Government ofPakistan should provide infrastructure to the cement industry to setup new factories  Government of Pakistan should provide incentives to the cement industry so that they can import new plants. Impact of political parties on the cement industry  Low domestic cement demand in the country is due to the political uncertainty.  The political stability in pakistan is at unrest. Due to this, the cement factories are facing problems regarding the investments they have made.  The stock market has shown sheer down fall since the political unrest. Although the market share index showed improvement after the resignation of pervez musharraf on 18th of august. But still the failure to restore the judges on time and many other issues has made the share index to slope downward once again. Key hurdles in marketing  Since cement is a specialized product, requiring sophisticated infrastructure and production location. So, most of the cement industries in Pakistan are located near/within mountainous regions that are rich in clay, iron and mineral capacity. Structure of Cement industry in Pakistan is as such that there is not much substitutability to buyers. Which shows that the Cross elasticity of demand is negligible.  Consumers face a tough decision with regards to prefer which brand over which because of the similar pricing of cement industry.  A price war was witnessed which ended up with no conqueror. Similar apprehensions exist for the future. Any hurdle in the growth of cement demand may force the sector into the price war. Yet, we expect cement manufacturers to act wise and learn lesson from the history. Any mistake, similar to the one made in the last decade, will again drive the sector into the era where all are losers with no winner.
  • 27.
    27  Containers areused for transportation purposes and even trains when cement is required urgently from north to south or vice versa. As for exports, ships are launched from ports but the cost of transportation faced by firms is so high that at maximum they can reach till South Africa for exports and the price gets out of budget when the ship reaches USA  Not much of innovation is possible in this industry. Intense rivalry can make it difficult for smaller firms to survive.  Firms cannot compromise much on the prices. It is hardly possible for any firm to get an edge due to price. Proposed solution  Measures should be taken to insure that the customers are not exploited by the cement industry.  Cement industry should enter into long term contracts with cement transporters to gain discounts and seek reduced transport prices.  Cement industry can enter in to contracts with international logistics transportation companies such as Mersk to export cement to USA in huge volumes at low cost  When the big companies are forming an association, small manufactures should be also considered as otherwise they would go out of business. Availability of finance Cement plant is a highly capital intensive business which requires a lot of investment which only a Giant company or Group can afford. In old times, when cement plants were established, comparatively less investment was required. There were also banks, banker‟s equity etc that provided loans easily. Now only self financing exists which a bank provides and they sees the feasibility of the project. A new plant should be established after wide market research in an industry where the capacity is already in surplus. This could be possible only if production cost is targeted. The old cement plants were not established keeping in mind the production cost. Nowadays about 70% cost constitutes the energy cost. If a company focuses on lowering the energy cost, making efficient
  • 28.
    28 use of technologicallyadvanced machinery then the production cost would apparently be low. There is always a potential for such plants. Types of loans provided to the industry Short term loans: Short term loans are obtained against the current assets of the company. When the company requires a short term loan it sends a request for the loan to the bank. The banks or other financiers put down their facilities in a term sheet against which they can provide the loan to the company. Long term Loans: The long term loans are obtained against the fixed assets of the company. These assets must be insured by the insurance company. This is the basic requirement for the bank. When the company requires a huge amount of loan it contacts to the bank for the loan. The bank than forms a group with other banks in order to arrange the amount. A finance agreement is signed by both the parties and the loan is given under the agreed terms and conditions. Trade issues  Import policy regarding construction equipment is not reorganized.  Trade policy does not facilitate contractors.  Regulatory framework discourages international contractors/consultants.  Shortage of Electricity or power break down is a major constraint as the frequent restoring to load shedding is causing an adverse effect on the trade and industry.  Duties on import of Fuel  Strict procedures for registration of contractors by Pakistan Engineering Council (PEC).
  • 29.
    29  Audit shouldplay a positive role. Proposed solutions  Custom duty over the import of pet coke should be withdrawn as its‟ negatively affects the cement industry. Key human resource issues in cement industry  Shortage of qualified and skilled manpower at all levels is an important issue.  Another issue is lack of training facilities for the development of required human resources.  Human resource policies of clients, contractors and consultants need improvement.  Fully skilled and semi skilled workers in search of opportunities have gone to the Middle East and other foreign countries.  Some contractors and consultants lack professional management.  Inadequate research and development.  Limit use of IT in industry. Proposed solutions  Availability of qualified and skilled manpower should be given priority by government  The training facilities should be developed at fast track.  Foreign and local experts should be hired to do the research and development.  Proper workshops that are held under the supervision of experts so that the practical knowledge is properly imparted to the labor.  The cement industry can use reward and bonuses to increase the motivational and performance level of the labor force.  Better machinery and management should be used to become cost efficient and become competitive.
  • 30.
    30 2. MARKET SHAREOF THE FIRMS IN CEMENT INDUSTRY The market share of the cement company‟s in Pakistan is as follows: Figure 6: market share of cement in Pakistan Cement Company Market Share (%) Kohat cement 6 Maple leaf 7 Askari cement 11 DG cement 13 Bestway cement 12 Lucky cement 16
  • 31.
    31 Chart 1: marketshares of firms in cement industry PROFILES OF SELECTED CEMENT COMPANIES There are three major players in the Cement industry of Pakistan Lucky Cement, D.G. Khan Cement and best way cement. According to the market share of 2015 lucky Cement occupy 18%, D.G. Khan 13% and Best way Cement 12% 2.1 PIONEER CEMENT LIMITED PHILOSOPHY: The Management of Pioneer Cement Limited is committed to maintaining this quality policy at all levels of the company. For this, as well as to achieve our corporate objectives, we all shall work as a team and pursue continuous improvement. INCORPORATION: Others 35
  • 32.
    32 Pioneer Cement Limited(PCL) was incorporated in Pakistan as a public company limited by shares on February 09, 1986. Its shares are quoted on all stock exchanges in Pakistan. The principal activity of the Company is manufacturing and sale of cement. PAID-UP CAPITAL/EQUITY Paid up Capital 199.5 million shares of Rs. 10/= each 1,995 Shareholders’ Equity 2,401 VISION AND MISSION Pioneer Cement Limited is committed to make sustained efforts towards optimum utilization of its resources through good corporate governance for serving the interests of all its stakeholders. CORPORATE INFORMATION Company Name PIONEER CEMENT COMPANY LIMITED. Legal Status Public Limited Company
  • 33.
    33 COMPANY’S PROFILE BOARD OFDIRECTORS Chairman Mr. Manzoor Hayat Noon Managing Director & CEO Mr. Javed Ali Khan Directors Mr. Aly Khan Mr. Nadir Rahman Mr. William Gordon Rodgers Mr. Wajahat A. Baqai (NBP) Mr. Rafique Dawood (FDIB) Mr. Cevdet DAL Mr. Etrat Hussain Rizvi Mr. Saleem Shahzada AUDIT COMMITTEE Chairman Mr. Rafique Dawood (FDIB) Members Mr. Aly Khan Mr. William Gordon Rodgers Mr. Etrat Hussain Rizvi Mr. Wajahat A. Baqai (NBP) CHIEF FINANCIAL OFFICER Mr. Muhammad Saleem COMPANY SECRETARY Syed Anwar Ali CHIEF INTERNAL AUDITOR Mr. Muhammad Zafar Qidwai STATUTORY AUDITORS Ford Rhodes Sidat Hyder & Co. COST AUDITORS Siddiqui & Co. LEGAL ADVISORS Hassan & Hassan Sayeed & Sayeed BANKS The Bank of Punjab National Bank of Pakistan Bank Islami Pakistan Limited Meezan Bank Limited The Royal Bank of Scotland Askari Commercial Bank Limited Bank Al-Habib Limited Habib Bank Limited United Bank Limited
  • 34.
    34 2.2 CHERAT CEMENT History: Before1981 there was an association who created MONOPOLY in the cement sector because of no close competitor in such industry. So to break that association and to offer cement to The public Cherat Cement factory was founded. Cherat cement is not only one of the best qualities cements in Pakistan, but in the entire region because of its natural favor "the limestone" which is one of the best quality reserve in the world. Cherat Cement Company limited is one of the largest companies of Ghulam Faruque group. Cherat Cement Company was incorporated at Karachi on May 25, 1981 as a public limited company and the certificate of commencement of business was obtained from the register of joint stock companies Karachi on July 8, 1998. Land of about 2219 canals and 4 Marias were obtained on lease from the government of NWFP. Mining concession over an area of 10378.54 acres was obtained from the government of NWFP. The foundation stone of Cherat Cement Company was laid on 1st January 1982 by the then president of Pakistan General Zia Ul Haq. It is situated at the foothills of Cherat cement near Lakarai village at distance of about 40 kilometer from Peshawar city. It started its production on 10n January 1985 after its inauguration by the governor of NWFP Lt. Gen. Fazl-e-Haq. The plant was built by a French firm named Creuot Loire to enterprises abbreviated as CLE. It was the first cement factory in private sector. Due to its importance the government of NWFP built road and power lines for the factory. The factory had the capacity to produce 1460 tons of cement per day but after plant expansion in 1993-94 its production capacity has increased to 2400 tons per day. The plant expansion was completed in October 1994. But the recent production of the factory is 3300 tons per day.
  • 35.
    35 Quality Policy: We wantCherat Cement Company to be regarded by our customer and our employees as the best and the most profitable organization in the market we serve. We seek innovation and improvement in every part of our business, through a system of ideas, suggestions, feedback and application. Every member of Cherat Cement Company Limited continuously perceives quality improvement through procedures, designed to provide the knowledge and skills needed to achieve the goal of our quality policy in line with customer requirements and by adhering to applicable statutory and regulatory requirements related to product. The Company Slogan: "BIND YOUR BRICKS" ISO 9002 Certification: SO 9002 is a quality assurance model made up of quality system requirements. This model applies to the organizations that produce, install, and service products. ISO expects organizations to apply this model, ad to meet these requirements by developing a quality system. Cherat Cement Company is an ISO 9002 certified company and follows sections on management and contract review requirements etc. Expansion of the Plant: The factory had the capacity to produce 1460 tons of cement per day but after plant expansion in 1993-94 its production capacity has increased to 2500 tons per day. The plant expansion was completed in October 1994. Now the plant produces 3400 tons per day. And lucky cement is the market leader because it produces 6000 tons per day.
  • 36.
    36 Board of Directors: MuhammadFaruque Chairman Mr. Azam Faruque Chief Executive Mr. Akbarali Peshni Director Mr. Muhammad Nawaz Tishni (NIT) Nominee Director Mr. Iftikhar Ahmad Bashir (NIT) Nominee Director Mr. Javid Anwar (NIT) Nominee Director 2.3 KOHAT CEMENT COMPANT LIMITED HISTORY OF KCCL KCCL was incorporated as a State Cement unit with an installed capacity of 800- 900 tons/day and the cost of installation was about 718,900 million. At start there were 250 officers and 1000 workers for the operation of business. It is situated in the southwest of the Kohat city near Babri Banda on the Rawalpindi road. Its distance from the Kohat city is about 12 kms (Kilometers) and its distance from the other cities of Pakistan is i.e. 64 kms from Peshawar, 142 kms from Bannu, 165 kms from Rawalpindi and Islamabad etc. Its total height above the sea level is about 450 meters. The total area bound by the KCCL is about 164 acres i.e. 656 kanals and this enclosed area consists of the factory plant, hill, colony, hospital, school, mosque, playground, hostel for single workers, club and community hall for the refreshment of employees, railway siding and also the leading road to the main road.
  • 37.
    37 For the operationof business the first machinery was imported from Romania in the month of April 1978 and in Pakistan only KCCL has the Romanian machinery. KCCL was incorporated on 30th April 1980 under the companies‟ act 1913 and now the act has changed to Companies Ordinance 1984. Lt. Gen. Saeed Qadir, minister of production, on 30th June 1983, performed the opening ceremony. The first commercial production of the KCCL was started on 1st October 1984. As the total outlay of the company was 718,900 million and its registered authorized capital was 200 million. In the early stages, the shares of worth 188 million were floated in the capital market. The first Board of Directors of the KCCL were; MR. Zaheer Sajjad (Chairman), MR.M. Saleem (Director/ GM), MR. Mushtaq Hussain (Director), MR. Ghulam Murtaza (Director) and MR. Fida Hussain (Director). The first Secretary of the company was MR. Fazal Karim (GM Finance). During the first year of inauguration KCCL earned a net profit of 3 million. In early days, company faced the problems like: delay in the supply of equipment, defective supply of equipment as well as problems with the technical services but the Pakistani engineers and the management of those days overcome the problems efficiently. a- Privatization of KCCL Being working under the State Cement Corporation of Pakistan, KCCL was privatizing by the Privatization Commission of Pakistan after nine years i.e. it was privatized on October 31st 1992 in the Government of Main Muhammad Nawaz Sharif. Privatization was followed through an open auction. Atta Muhammad Sheikh, who has a prominent name in the business society, made the highest bid and purchased the 90 percent shares of the company,. The partial amount of the bid was 520 million and 300 million were paid to the State Cement Corporation of Pakistan and hence, the total amount of the bid was 820 million.
  • 38.
    38 The company startedits operation under the new management team and showed a great efficiency. However, company suffered the loss in 1993 because of large amount deducted as taxes but the new management made the tremendous efforts to overcome the loss. b- KCCL Achievements after Privatization After Privatization, the new management team performed a vital role in the growth of the company. In present the authorized capital of the company has been extended up to 1000 million and plans to increase the authorized capital to 1500 million by changing the Memorandum and Articles of Association of the company to reflect the increase in the authorized share capital of the company. c- Mission Statement  Our customer with quality cement at competitive pricing  Our share holders with good returns and sustainable growth  Our employee with care and career development opportunities. d- Vision Statement  Be the best in the eyes of all stake holders e- Company Background Kohat Cement Company Limited (incorporated in 1980) is an ISO 9001-2015 certified company, listed on Stock Exchanges of Pakistan and engaged in manufacturing of Grey and White Cements. Quality of our products is better than approved British and Pakistan Standards. Company Registration Number & National Tax Number 1: Company Registration Number CUIN: 0007693
  • 39.
    39 2: National TaxNumber 1758919-3 Board of Directors Mr. Aizaz Mansoor Sheikh Chief Executive Mr. Nadeem Atta Sheikh Director Mrs. Ghazala Amjad Director Mr. Omer Aizaz Sheikh Director Mr. Muhammad Atta Tanseer Sheikh Director Membership of industry associations and trade bodies 1. APCMA (All Pakistan Cement Manufacturer Association) 2. LCCI (Lahore Chamber of Commerce and Industry) 3. KPCCI (Khyber Pakhtunkhwa Chamber of Commerce and Industry) 6. Employers Federation of Pakistan 2.3 TRADE UNION OF CEMENT INDUSTRY All PAKISTAN CEMENT MANUFACTURERS ASSOCIATION (APCMA) YEAR OF FORMATION APCMA is the collective voice of all the cement manufacturers of Pakistan. It is registered under Trade Organization Ordinance 2014. It was established on 14th of September 1992 under the Companies Ordinance 1984. Figure 7 LOCATION OF HEAD OFFICE AND PRINCIPAL OFFICES OF APCMA location of head office and other office of APCMA Offices  Lahore (Head office)  Karachi Figure 8
  • 40.
    40 KEY RESPONSIBILITIES OFAPCMA 1. To create an understanding amongst the private sector cement manufacturers of Pakistan for the following purpose : a. To increase the production of cement b. To improve the quality of cement produced and to increase exports c. To avoid undercutting in the sales price d. To create healthy circumstances for production and sales of cement. 2. To protect, safeguard and promote the interest of its members 3. To help coordination and ensuring co-operation amongst its members to attain primary objectives. 4. To identify and strengthen industry‟s role in the economic development of the country 5. To help and solve all the problems either faced by the cement manufacturers as a whole or by individual cement manufacturers 6. Provides up-to-date statistical data/information to the industry and other agencies 7. To make representations to the government or other authorities for and on the behalf of cement manufacturers in general and the trade in particular 8. To convene when necessary conferences and seminars at such times and such places as may be determined for the promotion of cement industry in Pakistan. 9. Focuses infrastructural problems (Rail, Coal, Power, etc) and suggests suitable measures for their solution. 10. Interacts for Industry's problems with the Government and co-ordinates various activities with other bodies. REGULAR EVENTS OF APCMA  Annual elections The elections for the management and President are held every year in which 80% participation of the members is mandatory.  Annual General Meeting
  • 41.
    41 The General Meetingof the association is held annually at the head office of APCMA in Karachi. The meeting is presided by the Chairman APCMA and upcoming issues , yearly progress, The Announcement of final result of election of members of executive committee and office bearers and Approval of annual audited accounts of APCMA. FAILURE OF APCMA Price war was started in 2013 which was resulted due to market saturation by major cement plant expansion. DGKK was the first player to destabilize the established industry, set prices in order to transfer its excess production capacity On 21st Feb, 2014 the govt. has given one week deadline to APCMA to bring down the unjustified cement prices or face action including ban on export. The government of Pakistan held a detailed inquiry and ordered All-Pakistan Cement Manufacturers Association (APCMA) to increase production and reduce the price of cement to its original level. APCMA Expected the yearly sale to grow by five per cent however total dispatches had increased by an insufficient two per cent in 2015-09. Competition authorities in Pakistan fined about $77 million on 20 cement companies found guilty of operating as a cartel and raising prices under mutual agreement. ACHIEVEMENTS OF APCMA  Took measures to bring prices to normal levels on in 2013  Suspend export of cement from the 6th April 2013 to 30th April 2013, which resulted in the availability of additional 200,000 tons of cement in the domestic market  Increased the capacity utilization from 86% to 92 % of total installed capacity, which brought an additional 91,000 tons of cement every month. Reduction in excise duty by Rs 10 per bag which enabled stability in cement prices this year (2009) 3 FINANCIAL ANALYSIS Financial Analysis is the summary of all transactions that have occurred over a particular period.
  • 42.
    42 Financial Analysis refersto the assessment of a business to deal with the planning, budgeting, monitoring, forecasting, and improving of all financial details within an organization. These indicate a firm's financial health and stability. Two key financial statements are: BALANCE SHEET  A balance sheet or statement of financial position is a summary of the financial balances of a sole proprietorship, a business partnership or a company. Assets, liabilities and ownership equity are listed as of a specific date, such as the end of its financial year. A balance sheet is often described as a "snapshot of a company's financial condition”. Of the four basic financial statements, the balance sheet is the only statement which applies to a single point in time of a business' calendar year.  A standard company balance sheet has three parts: assets, liabilities and ownership equity. The main categories of assets are usually listed first and typically in order of liquidity. Assets are followed by the liabilities. The difference between the assets and the liabilities is known as equity or the net assets or the net worth or capital of the company and according to the accounting equation, net worth must equal assets minus liabilities. INCOME STATEMENT Income statement (also referred as profit and loss statement (P&L), statement of financial performance, earnings statement, operating statement or statement of operations)  Is a company's financial statement that indicates how the revenue (money received from the sale of products and services before expenses are taken out, also known as the "top line") is transformed into the net income (the result after all revenues and expenses have been accounted for, also known as the "bottom line"). It displays the revenues recognized for a specific period, and the cost and expenses charged against these revenues, including write-offs (e.g., depreciation and amortization of various assets) and taxes.
  • 43.
    43  The purposeof the income statement is to show managers and investors whether the company made or lost money during the period being reported.  The important thing to remember about an income statement is that it represents a period of time. This contrasts with the balance sheet, which represents a single moment in time Horizontal Analysis The analysis is based on a year-to-year comparison of a firm's ratios, Vertical Analysis The comparison of Balance Sheet accounts either using ratios or not, to get useful information and draw useful conclusions RATIO ANALYSIS: A comparison of relationship among account balances. FINANCIAL RATIOS Financial Ratios are helpful in analyzing the actual performance of the company compared to its financial objectives. They also provide insights into the firm‟s performance compared to other firms in the industry. Ratio simply means one number expressed in term of another. A ratio is a statistical yardstick by means of which relationship between two or various figures can be compared or measured. The term accounting ratio is used to describe significant relationship between figures shown on a balance sheet, profit and loss account or in any other part of accounting organization. Accounting ratio thus shows the relationship between the accounting data. ACCOUNTING RATIOS The term "accounting ratios" is used to describe significant relationship between figures shown on a balance sheet, in a profit and loss account, in a budgetary control system or in any other part of accounting organization. Accounting ratios thus shows the relationship between accounting
  • 44.
    44 data. Ratios canbe found out by dividing one number by another number. Ratios show how one number is related to another. It may be expressed in the form of co-efficient, percentage, proportion, or rate. ADVANTAGES OF RATIOS ANALYSIS Ratio analysis is an important and age-old technique of financial analysis. The following are some of the advantages of ratio analysis: SIMPLIFIES FINANCIAL STATEMENTS It simplifies the comprehension of financial statements. Ratios tell the whole story of changes in the financial condition of the business. INTER PERIOD COMPARISON It provide data for inter period comparison. FACILITATES INTER-FIRM COMPARISON It provides data for inter-firm comparison. Ratios highlight the factors associated with successful and unsuccessful firm. They also reveal strong firms and weak firms, overvalued and undervalued firms. HELPS IN PLANNING It helps in planning and forecasting. Ratios can assist management, in its basic functions of forecasting. Planning, co-ordination, control and communications.
  • 45.
    45 MAKES INTER-FIRM COMPARISONPOSSIBLE Ratios analysis also makes possible comparison of the performance of different divisions of the firm. The ratios are helpful in deciding about their efficiency or otherwise in the past and likely performance in the future. HELP IN INVESTMENT DECISIONS It helps in investment decisions in the case of investors and lending decisions in the case of bankers etc 3.1 DATA. Three cement industries for their comparative financial analysis (Inter firm & inter period Analysis). We have collected the annual reports of our respective companies for five years (2011-2015) .The companies are as follows:  Pioneer Cement Ltd.  Kohat Cement Ltd.  Cherat Cement Ltd. PROBLEM STATEMENT Analysis will be made for Balance Sheet and Profit & loss A/c .the following financial statement analysis and ratio analysis will also be analyzed. Trend analysis (Horizontal Analysis). Common size statement (Vertical Analysis) RATIO ANALYSIS  Liquidity ratios.  Long term Liquidity / Long term Debt paying ability.  Activity ratios / Asset turnover ratios / Efficiency ratios.
  • 46.
    46  Profitability ratios. Financial leverage ratios.  Dividend policy ratios  Comparison will be made on the entire above ratio to find how good the business of the company is going. PURPOSE OF STUDY The purpose of the this research report is to extract the most out of the financial performance of the Cement Industry by comparing the performance of the surveying units (Pioneer Cement Co. Ltd.Comparison with Kohat & Cherat). Pioneer Cement comparative analysis will be made by both inter period and inter firm analysis is comparison with kohat Cement & Cherat Cement. The main objective of this research is to find out the financially analysis of cement Industry of Pakistan and also the current position of the cement industry in comparison of highly developed and automated cement industry of the world and suggest the improvements needed to reach at the same level, in term of trading process, trading volume and automation as well in term of recognition as other the cement Industry have. Financial literacy for the business students is the secondary purpose of this report especially for those students who don‟t select course related to the finance. RESEARCH OBJECTIVES The objective of this study is to analyze the financial performance of the companies based on the financial ratio during the period of 2011 to 2015. Other objectives of this research report is to give the better investment opportunities to the investors as well as to give the opportunity to the students to learn and have some knowledge about the financial & comparative analysis of the industries.
  • 47.
    47 LIMITATIONS OF REPORT Thereare many performance measurements using financial ratio analysis. There might be difficult to use all the measure. This study will select a certain financial ratio only. So, different performance measurement will give different result. This study based on the data collected through annual report, there could be some error in the data sources, which could make the result not accurate. This study limited to Five years research period from 2011 to 2015 for the ratio analysis in order to determine the analysis and conclusion. This research report is only the comparison of financial performance of two units of the Cement Industry (i.e. Pioneer Cement compare with Kohat & Cherat.) and not the analysis of Cement Industry as a whole. METHODOLOGY: This study used a comparative analysis (horizontal analysis) as a methodology because it is most suitable and easy to interpret and compare the performance of this companion‟s. I will begin by looking at the comparative ratios of the company for a Five -Years period by using trend analysis. Trend Analysis (Horizental) & ( Common size statement or Vertical) Ratio Analysis. 3.2 RATIO ANALYSIS A comparison of relationship among account balances. The term accounting ratio is used to describe significant relationship between figures shown on a balance sheet, profit and loss account or in any other part of accounting organization. 1. Profitability
  • 48.
    48 It is abilityto earn income and sustain growth in both short-term and long-term. A company's degree of profitability is usually based on the income statement, which reports on the company's results of operations; 2. Solvency Its ability to pay its obligation to creditors and other third parties in the long-term; 3. Liquidity Its ability to maintain positive cash flow, while satisfying immediate obligations; 4. Stability The firm's ability to remain in business in the long run, without having to sustain significant losses in the conduct of its business. Assessing a company's stability requires the use of both the income statement and the balance sheet, as well as other financial and non-financial indicators 3.3. DATA COLLECTION PROCEDURES The data has been collected from the annual report of selected company from the web site of the respective company. Financial statement in the annual report will be used as a main source for financial ratio analysis. For this study, the financial statement for three years (2011 to 2015) will be used to get the result. I choose Pioneer Cement comparative analysis with kohat & Cherat Cement. Data has been collected from annual report (Balance Sheet & Income Statement) of five years 2011 to 2015 will be used to get the result. 3.4. ANALYSIS PROCEDURES The financial ratio will be used in the analysis of the performance for the companies. The selected company will be tested on the Trend Analysis / Vertical Analysis , profitability, liquidity and solvency; certain financial ratio will be used such as;
  • 49.
    49 Test of profitability Returnon Assets (ROA) Return on Equity (ROE) Profit margin Earnings per share (EPS) The test profitability ratios as its self described which include that how a company or an organization can get its profitability factor enhance which influenced by its return on assets; equity; margin & earning per share. The whole mechanism directly proportional to the capability of firm or organization. Test of liquidity Current ratio Quick/ acid test ratio The test liquidity ratio defines that how quickly a firm or an organization transform its assets i.e. cash securities; inventory & others into the form of cash its also enable the decision maker to make corrective & proactive decisions which impact as increment in profitability of the organization or firm. Assets Turnover Ratio / Efficiency Ratio Receivable Turn Over Inventory Turn Over
  • 50.
    50 The asset turnoverratio also known as efficiency ratio, the main emphasize in both the ratio on the capability of how the company receivable convert quickly from the suppliers & the inventory in similar way. Financial Leverage Ratio Debt-equity ratio Debt-assets ratio Times Interest Earned The financial leverage ratios including debt-equity to asset & to time interest earned as a part from those it‟s essential to conclude the financial stability of the organization which might be essential for the company‟s whole structure including production, overhauling; forecasting & utilizing the parameters into growth & corrective measures. Dividend Policy Ratio Dividend Yield Payout Ratio 3.5 TOOLS OF ANALYSIS PERCENTAGE ANALYSIS Tools Of Analysis Percentage Analysis Ratio Analysis
  • 51.
    51 RATIO ANALYSIS 4 DATAANALYSIS , RESULTS / FINDINGS AND DISCUSSIONS. 4.1 KOHAT CEMENT COMPANY LTD A longtime leader in the cement manufacturing industry, Kohat Cement Company, headquartered in Islamabad, operates a cement plant at Jhang Bahtar, Tehsil Fateh Jang, District Attock in the province of Punjab. The Company has a strong and longstanding tradition of service, reliability, and quality that reaches back more than 11 years. Sponsored by Kohat Foundation, the Company was incorporated in Rawalpindi in 1992. Horizontal Analysis Trend Analysis Vertical Analysis Profitablility Ratios • Gross Profit Ratio • Operating Profit Ratio • Return On Equity • Return On Assets Liquidity Ratios • Current Ratio • Quick(Acid- Test) Ratio Efficiency Ratios • Recievable Turnover Ratio • Turnover Days • Total Asset Turnover Ratio Debt Ratios • Debt-To-Equity Ratio • Interest Coverage Ratio
  • 52.
    52 4.1.1 BALANCE SHEET(HORIZONTAL ANALYSIS) Formula Trend Analysis (Horizontally)= 100X BaseYear rCurrentYea Trend Analysis (Horizontally= %15.204100 574460 1172765 X Kohat Cement Company Limited Balance Sheet (Trend Analysis) As on December….. RS(000) 2011 2012 2013 2014 2015 CURRENT ASSETS 100.00% 204.15% 274.93% 340.06% 921.58% Cash and bank balances 100.00% 306.01% 430.06% 214.69% 1919.91% Deposit accounts 100.00% 407.60% 580.74% 293.17% 2733.41% Current accounts 100.00% 121.17% 230.95% 94.01% 126.79% Collection accounts 100.00% 43.97% 0.00% 0.00% 0.00% Cash in hand 100.00% 485.19% 398.15% 329.63% 479.63% Advances, Deposits, prepayments and other receivables: 100.00% 62.57% 95.59% 1167.06% 469.63% To suppliers 100.00% 53.31% 92.59% 2395.69% 45.59% To employees 100.00% 174.39% 365.03% 138.31% 550.78% Due from associated undertaking – unsecured 100.00% 99.82% 283.05% 0.00% 0.00% Deposits 100.00% 113.18% 142.04% 136.71% 436.94% Prepayments 100.00% 40.68% 93.69% 29.46% 37.39%
  • 53.
    53 Excise duty 100.00%30.84% 0.00% 0.00% 0.00% Advance tax –net 100.00% 175.82% 166.06% 295.30% Sales tax refundable –net 100.00% 0.00% 0.00% 0.00% 2191.81% Derivative foreign currency options used as hedging instrument 100.00% Interest accrued 100.00% 46.07% 251.77% 233.43% 681.75% Prepaid arrangement fee for loans 100.00% 678.82% Margin on letters of credit 100.00% Other receivables- Considered goods 100.00% 1276.74% 439.69% 323.10% 1113.02% Others 100.00% 0.00% 0.00% 66.72% 15.09% TRADE DEBTS 100.00% 239.41% 56.88% 43.67% 60.12% Unsecured 100.00% 104.98% 113.46% 67.62% 20.34% Considered goods 100.00% 105.34% 114.41% 34.89% 0.00% Considered doubtful 100.00% 100.00% 100.00% 532.74% 309.38% Secure-considered goods 100.00% 371.96% 0.00% 52.34% 119.55% Less: Provision for doubtful debts 100.00% 100.00% 100.00% 532.74% 309.38% STOCK IN TRADE 100.00% 90.80% 235.54% 297.58% 373.52% Raw and packing material 100.00% 121.32% 184.00% 157.19% 205.41% Work in process 100.00% 41.87% 337.42% 415.05% 549.44% Finished goods 100.00% 138.80% 125.74% 237.21% 248.67% STORES, SPARES AND LOOSE TOOLS 100.00% 182.60% 248.68% 237.47% 459.77% Stores 100.00% 149.83% 276.30% 86.30% 578.20% Spares 100.00% 206.65% 236.79% 333.02% 404.46% Loose tools 100.00% 114.73% 168.79% 175.80% 188.62% DEFERRED TAX ASSETS – NET 100.00% 59.14% 0.00% 0.00% 0.00%
  • 54.
    54 LONG TERM DEPOSITS100.00% 127.35% 127.35% 127.35% 127.35% Islamabad Electric Supply Company Limited 100.00% 100.00% 100.00% 100.00% 100.00% Sui Northern Gas Pipelines Limited 100.00% 166.74% 166.74% 166.74% 166.74% LONG TERM ADVANCES – Considered goods 100.00% 100.00% 90.00% 80.00% Sui Northern Gas Pipelines Limited 100.00% 90.00% Less: Amount receivables within 12 months shown under current assets 100.00% 100.00% FIXED ASSETS – Tangible: 100.00% 98.50% 96.49% 92.88% 150.27% Property, Plant and equipment 100.00% 98.50% 96.49% 92.88% 150.27% Total Assets 100.00% 105.30% 104.87% 108.30% 210.72% CURRENT LIABILITIES 100.00% 324.35% 340.54% 387.59% 659.68% Current portion of long term financing: 100.00% 639.24% 635.78% 635.78% 635.78% Short term borrowings – secured: 100.00% 76.52% 121.57% 446.25% Markup accrued: 100.00% 528.15% 455.16% 368.03% 252.71% Trade and other payables: 100.00% 101.19% 154.54% 171.92% 181.01% Creditors 100.00% 100.70% 130.91% 179.11% 144.57% Accrued liabilities 100.00% 105.82% 100.07% 187.35% 275.43% Retention money 100.00% 97.36% 118.71% 110.79% 143.42% Security deposits 100.00% 113.82% 149.19% 153.37% 144.98% Advances from customers 100.00% 183.57% 254.07% 293.11% 178.82% Workers‟ (Profit) Participation Fund 100.00% 234.20% 103.84% 61.11% Workers‟ Welfare fund 100.00% 157.67% Sales tax payable- net 100.00% 140.33% 175.91% 146.16% 0.00%
  • 55.
    55 Excise duty payable100.00% 6098.28% 17696.55% 14796.55% 99360.34% Other liabilities 100.00% 7.21% 11.09% 49.87% 55.52% Compensated absences 100.00% 10.67% 10.84% Unclaimed dividend 100.00% 275.43% 107.67% NON – CURRENT LIABILITIES 100.00% 71.33% 45.80% 33.99% 19.89% Retention money payables: 100.00% Deferred tax liability – net: 100.00% 157.82% 168.61% Deferred liability 100.00% 112.29% 19.65% 20.56% 23.51% Long term financing: 100.00% 70.87% 40.04% 24.59% 9.13% Loans from banking companies – Secured: Habib Bank Limited 100.00% 65.29% 47.11% 28.93% MCB Bank Limited 100.00% 65.29% 47.11% 28.93% United Bank Limited 100.00% 65.29% 47.11% 28.93% Bank Al Falah Limited 100.00% 65.29% 47.11% 28.93% NIB Bank Limited 100.00% 61.40% PICIC Commercial Bank Limited 100.00% 65.29% 0.00% 0.00% Loan from related party: Kohat Foundation- Unsecured 100.00% 0.00% 0.00% 0.00% Less: amount payable within 12 months shown under current liabilities 100.00% 99.46% 99.46% 99.46% SHARE CAPITAL AND RESERVES 100.00% 126.33% 169.28% 192.62% 478.77% Reserves: 100.00% -405.93% Accumulated loss 100.00% 77.36% 40.43% 0.00% 0.00% Share capital: 100.00% 100.00% 100.00% 100.00% 176.90%
  • 56.
    56 Total Liabilities +Owner’s Equity 100.00% 105.30% 104.87% 108.30% 210.72% 4.1.2 BALANCE SHEET (VERTICAL ANALYSIS) Formula Common Size Statement (Vertically)= 100 . X TotalAsset Item Example:- Vertical Analysis = %72.9100 5910353 574460 X Kohat Cement Company Limited Balance Sheet (Vertical Analysis) As on December….. RS(000) 2011 2012 2013 2014 2015 CURRENT ASSETS 9.72% 18.84% 25.48% 30.52% 42.51% Cash and bank balances 3.33% 9.69% 13.67% 6.61% 30.38% Deposit accounts 2.33% 9.00% 12.88% 6.29% 30.16% Current accounts 0.36% 0.42% 0.79% 0.31% 0.22% Collection accounts 0.65% 0.27% 0.00% 0.00% 0.00% Cash in hand 0.00% 0.00% 0.00% 0.00% 0.00% Advances, Deposits, prepayments and other receivables: 1.24% 0.74% 1.13% 13.42% 2.77% To suppliers 0.58% 0.29% 0.51% 12.74% 0.12% To employees 0.01% 0.01% 0.03% 0.01% 0.02% Due from associated undertaking – unsecured 0.02% 0.02% 0.05% 0.00% 0.00%
  • 57.
    57 Deposits 0.02% 0.02%0.03% 0.03% 0.05% Prepayments 0.18% 0.07% 0.16% 0.05% 0.03% Excise duty 0.17% 0.05% 0.00% 0.00% 0.00% Advance tax –net 0.00% 0.13% 0.22% 0.20% 0.19% Sales tax refundable -net 0.06% 0.00% 0.00% 0.00% 0.66% Derivative foreign currency options used as hedging instrument 0.00% 0.00% 0.00% 0.00% 0.68% Interest accrued 0.04% 0.02% 0.09% 0.08% 0.12% Prepaid arrangement fee for loans 0.00% 0.00% 0.00% 0.17% 0.60% Margin on letters of credit 0.00% 0.00% 0.00% 0.00% 0.24% Other receivables- Considered goods 0.01% 0.13% 0.05% 0.03% 0.06% Others 0.16% 0.00% 0.00% 0.10% 0.01% TRADE DEBTS 0.76% 1.72% 0.41% 0.31% 0.22% Unsecured 0.40% 0.40% 0.44% 0.25% 0.04% Considered goods 0.38% 0.38% 0.41% 0.12% 0.00% Considered doubtful 0.03% 0.03% 0.03% 0.13% 0.04% Secure-considered goods 0.38% 1.35% 0.00% 0.18% 0.22% Less: Provision for doubtful debts -0.03% -0.03% -0.03% -0.13% -0.04% STOCK IN TRADE 1.04% 0.90% 2.34% 2.86% 1.85% Raw and packing material 0.26% 0.30% 0.45% 0.37% 0.25% Work in process 0.47% 0.19% 1.51% 1.80% 1.22% Finished goods 0.31% 0.42% 0.38% 0.69% 0.37% STORES, SPARES AND LOOSE TOOLS 3.34% 5.79% 7.92% 7.32% 7.29% Stores 1.22% 1.73% 3.20% 0.97% 3.34% Spares 2.00% 3.93% 4.52% 6.16% 3.84%
  • 58.
    58 Loose tools 0.12%0.13% 0.20% 0.20% 0.11% DEFERRED TAX ASSETS - NET 9.64% 5.42% 0.00% 0.00% 0.00% LONG TERM DEPOSITS 0.62% 0.75% 0.75% 0.73% 0.37% Islamabad Electric Supply Company Limited 0.37% 0.35% 0.35% 0.34% 0.17% Sui Northern Gas Pipelines Limited 0.25% 0.40% 0.40% 0.39% 0.20% LONG TERM ADVANCES - Considered goods 0.00% 0.14% 0.15% 0.13% 0.06% Sui Northern Gas Pipelines Limited 0.00% 0.00% 0.00% 0.14% 0.07% Less: Amount receivables within 12 months shown under current assets 0.00% 0.00% 0.00% -0.01% -0.01% FIXED ASSETS - Tangible: 80.02% 74.85% 73.62% 68.62% 57.06% Property, Plant and equipment 80.02% 74.85% 73.62% 68.62% 57.06% Total Assets 100.00% 100.00% 100.00% 100.00% 100.00% CURRENT LIABILITIES 6.30% 19.39% 20.44% 22.53% 19.71% Current portion of long term financing: 1.46% 8.89% 8.87% 8.59% 4.42% Short term borrowings - secured: 0.00% 4.96% 3.81% 5.87% 11.07% Markup accrued: 0.22% 1.11% 0.96% 0.76% 0.27% Trade and other payables: 4.61% 4.43% 6.79% 7.32% 3.96% Creditors 0.77% 0.74% 0.96% 1.28% 0.53% Accrued liabilities 1.07% 1.08% 1.02% 1.86% 1.40% Retention money 0.18% 0.17% 0.21% 0.19% 0.12% Security deposits 0.43% 0.47% 0.61% 0.61% 0.30% Advances from customers 0.39% 0.68% 0.95% 1.06% 0.33% Workers' (Profit) Participation Fund 0.00% 0.64% 1.51% 0.65% 0.20%
  • 59.
    59 Workers' Welfare fund0.00% 0.00% 0.00% 0.25% 0.20% Sales tax payable- net 0.38% 0.50% 0.63% 0.51% 0.00% Excise duty payable 0.00% 0.06% 0.17% 0.13% 0.46% Other liabilities 1.38% 0.09% 0.15% 0.64% 0.36% Compensated absences 0.00% 0.00% 0.55% 0.06% 0.03% Unclaimed dividend 0.00% 0.00% 0.03% 0.09% 0.02% NON - CURRENT LIABILITIES 60.89% 41.25% 26.59% 19.11% 5.75% Retention money payables: 0.00% 0.00% 0.00% 0.00% 0.15% Deferred tax liability - net: 0.00% 0.00% 3.47% 5.31% 2.92% Deferred liability 0.68% 0.73% 0.13% 0.13% 0.08% Long term financing: 60.21% 40.52% 22.99% 13.67% 2.61% Loans from banking companies - Secured: Habib Bank Limited 0.00% 14.73% 9.66% 6.75% 2.13% MCB Bank Limited 0.00% 14.73% 9.66% 6.75% 2.13% United Bank Limited 0.00% 7.36% 4.83% 3.37% 1.06% Bank Al Falah Limited 0.00% 7.36% 4.83% 3.37% 1.06% NIB Bank Limited 0.00% 0.00% 0.00% 2.02% 0.64% PICIC Commercial Bank Limited 0.00% 4.42% 2.90% 0.00% 0.00% Loan from related party: Kohat Foundation- Unsecured 0.00% 0.80% 0.00% 0.00% 0.00% Less: amount payable within 12 months shown under current liabilities 0.00% -8.89% -8.87% -8.59% -4.42% SHARE CAPITAL AND RESERVES 32.81% 39.36% 52.96% 58.36% 74.54% Reserves: 0.00% 0.00% 0.00% -7.17% 14.97% Accumulated loss -38.16% -28.03% -14.71% 0.00% 0.00%
  • 60.
    60 Share capital: 70.97%67.39% 67.67% 65.53% 59.58% Total Liabilities + Owner's Equity 100.00% 100.00% 100.00% 100.00% 100.00% 4.1.3 INCOME STATEMENT (TREND ANALYSIS) Kohat Cement Company Limited Income Statement (Trend Analysis) For the Year Ended June…… RS(000) 2011 2012 2013 2014 2015 Sales 100.00% 120.76% 175.02% 147.20% 146.25% Less: Government Levies 100.00% 113.16% 146.93% 138.46% 126.53% Net Sales 100.00% 123.90% 186.66% 150.82% 154.42% Cost of sales 100.00% 113.38% 134.69% 152.49% 185.66% Raw material Consumed 100.00% 118.80% 178.66% 204.39% 197.47% Packing material consumed 100.00% 95.18% 117.61% 142.21% 181.31% Stores and spares consumed 100.00% 124.37% 114.51% 211.37% 206.51% Spares written off 100.00% 5.02% 0.00% Salaries, wages and benefits 100.00% 95.40% 155.63% 146.55% 146.19% Rent, rates and taxes 100.00% 144.75% 269.12% 232.46% 555.04% Insurance 100.00% 121.17% 85.05% 82.86% 81.91% Fuel consumed 100.00% 123.95% 149.47% 173.41% 255.39%
  • 61.
    61 Power consumed 100.00%107.21% 127.01% 139.21% 145.60% Depreciation 100.00% 103.67% 107.62% 113.65% 119.51% Others 100.00% 114.80% 165.96% 174.47% 135.68% 100.00% 112.19% 139.05% 154.36% 188.03% Add: Opening work-in-process 100.00% 477.24% 199.83% 1610.30% 1980.76% Less: Closing work-in-process 100.00% 41.87% 337.42% 415.05% 549.44% Cost of goods manufactured 100.00% 114.84% 135.70% 155.16% 188.29% Add: Opening finished goods 100.00% 58.18% 80.75% 73.16% 138.01% Less: Closing finished goods 100.00% 138.80% 125.75% 237.21% 248.67% 100.00% 113.38% 134.69% 152.49% 186.53% Less: Own consumption capitalized 100.00% 100.00% 113.38% 134.69% 152.49% 185.66% Gross profit 100.00% 146.00% 295.77% 147.34% 88.84% Other income 100.00% 26.24% 101.35% 172.74% 251.67% Distribution cost: 100.00% 104.49% 155.24% 199.08% 261.48% Salaries, wages and benefits 100.00% 92.29% 178.07% 171.93% 156.45% Export freight and other charges 100.00% Traveling and entertainment 100.00% 179.59% 143.91% 68.18% 108.99% Vehicle running and maintenance expenses 100.00% 59.78% Rent, rates and taxes 100.00% 102.45% 97.20% 118.27% 128.32% Repairs and maintenance 100.00% 212.17% 152.07% 42.09% 70.07% Printing and stationery 100.00% 125.74% 79.17% 81.73% 107.07% Depreciation 100.00% 93.98% 138.67% 223.56% 346.22% Others 100.00% 109.88% 123.62% 284.05% 51.63%
  • 62.
    62 Administrative expenses: 100.00%106.97% 168.53% 180.35% 193.49% Salaries, wages and benefits 100.00% 100.08% 163.46% 194.52% 188.63% Traveling and entertainment 100.00% 161.67% 232.29% 169.85% 364.49% Vehicle running and maintenance expenses 100.00% 89.94% Insurance 100.00% 114.10% 170.51% 190.38% 192.95% Rent, rates and taxes 100.00% 117.48% 404.32% 557.71% 607.61% Repairs and maintenance 100.00% 156.12% 324.05% 135.02% 82.98% Printing and stationery 100.00% 101.40% 170.91% 226.75% 153.97% Depreciation 100.00% 181.21% 197.21% 277.50% 481.21% Others 100.00% 92.87% 127.51% 75.31% 67.55% Other Operating expenses: 100.00% 7597.19% 17659.85% 10900.19% 6433.40% Audits' remuneration 100.00% 102.06% 106.00% 99.44% 112.57% Workers' (Profit) Participation Fund 100.00% 234.20% 103.84% 61.11% Workers' Welfare Fund 100.00% 57.67% Finance Cost: 100.00% 112.44% 129.42% 101.41% 71.96% Fee and charges on loans 100.00% 90.95% 4.30% 4.30% 4.30% Interest/mark-up on long term finance 100.00% 306.65% 443.15% 350.01% 226.66% Interest/mark-up on long term loan from related party 100.00% 364.83% 52.23% 0.00% 0.00% Interest on short term borrowings and other charges 100.00% 25.16% 17.90% 266.75% Interest on Workers' Profit Participation Fund 100.00% 3.13% 0.00% Guarantee commission 100.00% 28.76% 0.43% 0.87% 0.59% Bank charges and commission 100.00% 77.84% 104.45% 90.39% 93.31% Foreign exchange risk 100.00% 0.00% 0.00% 0.00% 0.00%
  • 63.
    63 insurance(FERI) contract Amortization ofdeferred cost 100.00% 0.00% 0.00% 0.00% 0.00% Net profit before taxation 100.00% -311.99% -730.69% -323.97% -186.84% Less: Taxation 100.00% -44.59% -102.96% -25.45% -7.35% Net profit after taxation 100.00% 162.50% 383.17% 205.74% 131.66% 4.1.4 INCOME STATEMENT (VERTICAL ANALYSIS) Kohat Cement Company Limited Income Statement (Vertical Analysis) For the Year Ended June…… RS(000) 2011 2012 2013 2014 2015 Sales 100.00% 100.00% 100.00% 100.00% 100.00% Less: Government Levies -29.29% -27.45% -24.59% -27.55% -25.34% Net Sales 70.71% 72.55% 75.41% 72.45% 74.66% Less: Cost of sales 47.90% 44.97% 36.86% 49.62% 60.81% Raw material Consumed 3.55% 3.49% 3.62% 4.92% 4.79% Packing material consumed 4.79% 3.77% 3.22% 4.63% 5.94% Stores and spares consumed 0.16% 0.17% 0.11% 0.23% 0.23% Spares written off 0.00% 0.00% 0.33% 0.02% 0.00% Salaries, wages and benefits 2.81% 2.22% 2.50% 2.80% 2.81% Rent, rates and taxes 0.03% 0.04% 0.05% 0.05% 0.11%
  • 64.
    64 Insurance 0.46% 0.46%0.22% 0.26% 0.26% Fuel consumed 17.39% 17.85% 14.85% 20.48% 30.36% Power consumed 9.55% 8.48% 6.93% 9.03% 9.51% Depreciation 7.48% 6.43% 4.60% 5.78% 6.12% Others 1.95% 1.85% 1.84% 2.31% 1.81% 48.16% 44.75% 38.26% 50.50% 61.92% Add: Opening work-in-process 0.18% 0.71% 0.20% 1.96% 2.43% Less: Closing work-in-process -0.85% -0.30% -1.65% -2.41% -3.21% Cost of goods manufactured 47.49% 45.16% 36.82% 50.05% 61.14% Add: Opening finished goods 0.99% 0.47% 0.45% 0.49% 0.93% Less: Closing finished goods -0.57% -0.66% -0.41% -0.92% -0.97% 47.90% 44.97% 36.86% 49.62% 61.09% Less: Own consumption capitalized 0.00% 0.00% 0.00% 0.00% -0.28% 47.90% 44.97% 36.86% 49.62% 60.81% Gross profit 22.81% 27.58% 38.55% 22.83% 13.86% Other income 1.32% 0.29% 0.76% 1.54% 2.27% Distribution cost: 0.63% 0.54% 0.56% 0.85% 1.12% Salaries, wages and benefits 0.37% 0.28% 0.38% 0.43% 0.40% Export freight and other charges 0.00% 0.00% 0.00% 0.00% 0.52% Traveling and entertainment 0.03% 0.05% 0.03% 0.01% 0.02% Vehicle running and maintenance expenses 0.00% 0.00% 0.00% 0.06% 0.03% Rent, rates and taxes 0.04% 0.03% 0.02% 0.03% 0.03% Repairs and maintenance 0.01% 0.02% 0.01% 0.00% 0.01% Printing and stationery 0.02% 0.02% 0.01% 0.01% 0.01%
  • 65.
    65 Depreciation 0.02% 0.02%0.02% 0.04% 0.06% Others 0.14% 0.13% 0.10% 0.27% 0.05% Administrative expenses: 1.22% 1.08% 1.17% 1.49% 1.61% Salaries, wages and benefits 0.67% 0.56% 0.63% 0.89% 0.87% Traveling and entertainment 0.06% 0.08% 0.08% 0.07% 0.16% Vehicle running and maintenance expenses 0.00% 0.00% 0.00% 0.05% 0.05% Insurance 0.01% 0.01% 0.01% 0.01% 0.01% Rent, rates and taxes 0.03% 0.03% 0.08% 0.12% 0.14% Repairs and maintenance 0.02% 0.03% 0.04% 0.02% 0.01% Printing and stationery 0.03% 0.02% 0.03% 0.04% 0.03% Depreciation 0.06% 0.09% 0.07% 0.11% 0.20% Others 0.33% 0.25% 0.24% 0.17% 0.15% Other Operating expenses: 0.02% 1.03% 1.66% 1.22% 0.72% Audits' remuneration 0.02% 0.01% 0.01% 0.01% 0.01% Workers' (Profit) Participation Fund 0.00% 1.02% 1.65% 0.87% 0.51% Workers' Welfare Fund 0.00% 0.00% 0.00% 0.34% 0.20% Finance Cost: 6.29% 5.86% 4.65% 4.33% 3.09% Fee and charges on loans 0.36% 0.27% 0.01% 0.01% 0.01% Interest/mark-up on long term finance 1.77% 4.48% 4.47% 4.20% 2.74% Interest/mark-up on long term loan from related party 0.03% 0.08% 0.01% 0.00% 0.00% Interest on short term borrowings and other charges 0.00% 0.11% 0.02% 0.02% 0.24% Interest on Workers' Profit Participation Fund 0.00% 0.00% 0.05% 0.00% 0.00% Guarantee commission 3.45% 0.82% 0.01% 0.02% 0.01%
  • 66.
    66 Bank charges andcommission 0.14% 0.09% 0.08% 0.09% 0.09% Foreign exchange risk insurance(FERI) contract 0.55% 0.00% 0.00% 0.00% 0.00% Amortization of deferred cost 23.47% 0.00% 0.00% 0.00% 0.00% Net profit before taxation -7.49% 19.36% 31.28% 16.49% 9.57% Less: Taxation 17.17% -6.34% -10.10% -2.97% -0.86% Net profit after taxation 9.67% 13.02% 21.18% 13.52% 8.71% 4.2 PIONEER CEMENT LIMITED FIVE YEARS HORIZONTAL ANALYSIS OF INCOME STATEMENT PIONEER CEMENT COMPANY LIMITED FIVE YEAR POSITION OF INCOME SATEMENT For the year ended June 30 2011 2012 2013 2014 2015 Net Sales 55% 2% 50% 55% 40% Cost of goods sold 54% 52% 34% 47% 31% Gross Profit 61% -74% 83% 74% 73% Administrative And Selling expenses 293% 25% -15% 55% 19% Operating Operating/Loss -124% -84% 107% 80% 91% Other operating expenses 1997% -88% 13% 123% -5% Other operating income 162% -84% 162% -65% 19%
  • 67.
    67 ANALYSIS: Sales of theCompany has shown increasing trend and has increased up to 40% in 2011,55% in 2012 and 50% in 2013 and 2% in 2014 and 55% in 2015 and respective from previous years Cost of sales has also shown an increasing trend. In 2011 it is 31%, 2012 it increased 47%, in 2013 in increased 34%, 52% increase in 2014 and 54% in 2015 from respective years cost of sale increase more than increase in sales which result there is loss in 2014. The major reason of this increase in cost was the plant shutdown due to irregular power supply of WAPDA and increase in prices of diesel and empty bags. Profit/loss from operations -189% -84% 120% 45% 84% Financial & Other Voluntary separation scheme charges 13% -286% 63% 3% 28% Profit/loss before taxation 211% -120% 137% 65% 56% Taxation 333% -135% 316% -133% -44% Profit/loss after taxation 92% -114% 104% -22% 87%
  • 68.
    68 Gross profit ofthe company has also shown a increasing trend in from 2011 to 2012 up to 2013 respectively and then decrease and got loss in 2014 and then gross profit increase 61% in 2015 company cost of sale increases but sale decrease, in 2014 gross profit decreases -74% and it was 61% in 2015.Selling and distribution expenses also increases in 2015 as 293% and 25% in 2014 respectively. This decrease in gross profit was due to the increase in cost of goods sold and also administrative and selling expenses which cause company got loss. Operating profit showing increasing trend from 2011 to 2013 as 91%, 80% and 107% respectively and then it decrease in 2014 and 2015 as -84% and -124% which show big loss in the year of 2015. Finance cost Decrease in 2014 as 286% and increased in 2015 as 13% which is not at higher side but it is at higher side in 2011 to 2013 as 63% for expansion of new grey and white cement plants. There is a great increase in 2015 which cause the loss of the company. Profit before tax shows decrease in 2014 as 120% and increase in 2015 as 211% and company got loss in 2015. Profit after tax decreased in 2014 by 114% and it was increase 92% in 2015. Company management tries to expand its operations so it needs more finds that were got from short and long term financing. Due to economic crises and dispute with unionized permanent workers, company faces losses. Company is good for long term benefits, because it had declared bonus shares for last five years. It had a great capacity to produce cement and they are improving technology. They had implemented Enterprise Resource Planning software to increase the efficiency and for better management planning.
  • 69.
    69 4.2.2 HORIZONTAL ANALYSISOF BALANCE SHEET BALANCE SHEET As at June 30 2015 2014 2013 2012 2011 EQUITY AND LIABILITIES SHARE CAPITAL AND RESERVE Authorized Share Capital 0% 0% 0% 0% 0% Issue Subscribed & Paid Up Capital 18% 5% 5% 62% 26% Reserves -22% -43% 847% -118% -28% 10% -10% 43% 197% -2% Surplus on Revaluation of fixed assets-net of tax 290% -5% -4% - - NON-CURRENT LIABILITIES Redeemable capital - - -100% -8% 9.61% Long term financing-secured 6% -83% - - 10.44% Long term loans-secured -26% 27% -8% 3% - Long term Musharaka finance -100% - - - - Liabilities against assets subject to finance lease -51% 7% 65% 2780% 4.41% Long term deposits -65% -7% -15% 187% 0.145% Long term creditor-unsecured -30% -26% - - - Deferred liabilities -10% 17% -12% -21% 8.28% Deferred tax liabilities - -100% 122% - - -25% -3% 12% 9% 32.8% BALANCE SHEET
  • 70.
    70 CURRENT LIABILITIES Creditors againstexpansion project -90% -5% -39% - Trade and other payables 120% 7% 27% 251% 10.98% Interest/ Mark up accrued 54% 70% -44% -25% 0.11% Short term Murabah-secured -73% - - - Short term Musharaka secured - - - - Short term finances - - - - 4.90% Short term borrowings - - -100% - - Current maturity of redeemable capital - - -100% 93% - Current maturity of long term loan - -100% -36% -64% 3.24% Current portion of long term loan - -100% - - Current portion of liabilities against assets subject to finance lease 39% 761% 919% 112% 2.11% Current portion of deferred liability -100% -99% - - - - Sales tax payable - -100% 62% 340% - 49% 43% 41% 158% 21.34 % 22% 2% 22% 61% 11.46 % ASSETS NON CURRENT ASSETS FIXED CAPITAL EXPENDITURE Property, plant and equipment 27% -2% 20% 74% 52.31%
  • 71.
    71 Long term loans-11% 43% -25% 13% 0.10% Long term deposits -15% 28% 169% 55% 0.105% Deferred tax assets - - - -100% - 27% -2% 21% 66% 52.52 % CURRENT ASSETS Stock in trade -54% 55% 70% 12% 2.55% Store, spare and loose tools 3% 11% 31% 13% 8.01% Assets held for disposal -100% - - - - Trade Debts 35% 138% -34% -23% Loan & advances 156% 80% -78% 939% 0.21% Deposits & prepayments -59% -33% -16% -32% 1.03% Other receivables 8471% -87% -73% 22% - Current portion of long term deposits 838% - - - - Sales tax net -100% - - - - Taxation-net - -100% -11% -8% - Cash & bank balance -54% 325% 310% -53% 0.72% -19% 56% 34% 17% 12.52 % 22% 2% 22% 61% 23.83 % ANALYSIS: 1) NON-CURRENT ASSETS: As we can see from the horizontal balance sheet analysis of five years, the total non-current assets have shown increasing trend. In 2011 it is 52.52%, 2012 it is 66% than it increase 21% in
  • 72.
    72 2013, 21% in2013 and then it decrease in 2014 by 2% and then again increase in 2015 by 27% as compare to 2014. This shows heavy investment in fixed assets by the management. Operating fixed assets showed increasing trend in from 2011 to 2013 by 74%, 20% respectively it decreases 2% in 2014 and then again increase in 2015 from 2014 by 27%. Long term loans showing mix trend it increased by 13% in 2012 and then it decreased 25% in 2013 and increased by 43% in year 2014 and decrease 11% respectively. Lon-term deposit has shown an increasing trend from 2012 to 2014 by 55%, 169% and 28% from respective years, and it decrease in 2015 by 15% from 2014. Deferred tax assets just in 2012 than no more 2013, 2014, 2015 so it decrease almost 100% 2) CURRENT ASSETS: Store, spare and tools has shown increasing trend from 2011 to 2015 by 13%, 31%, 11%,and 3% from their respective years, which shows that company is in good position as liquidity point of view. Stock in trade shows increasing trend from 2012 to 2014 by 12% in 2012, 70% in 2013, 55% in 2014 and decrease 54% in 2015.This higher inventory is indication of weak inventory management. Trade debts has shown decreasing trend in 2012 from 2011 by 23% and then decrease by 34% from 2012 an it increased by 138% in 2014 which is at higher side and then it increase by 35% in 2015 from 2014.Receivable management is inefficient in 2014 and 2015 by showing increasing trend as compare it with 2012 and 2013.Loan and advances shown increasing trend in 2012 in huge amount it increase 939% from 2011 which means company made advances and loans to the employees in huge amounts than it decrease in 2013 by 78% and in 2014 again increase by 80% and also increase in 2015 by 156%.deposits and prepayment showing decreasing trend from 2012 to 2015 by 32%, 16%, 33% and 59% by respective years. Other receivables also showing decreasing trend from 2013 to 2015 just increased in 2012 from 2011 by 22%. Cash and bank balance first decreased in 2012 by 53% from 2011 than it showing increasing trend from 2013 to 2014 by 310% and 325% from respective years and then again it decreased in 2015 54% from 2014.
  • 73.
    73 Over all currentassets showing increasing from 2011 to 2014 by 17%, 34% and 56% from respective years and it decrease in 2015 by 19% from 2014 which means current assets are decreased in 2015. 3) EQUITY AND LIABILITIES: Share capital show an increasing trend it increases in 2011 by 42% ,2012 in 62% and 5% in 2013 and 2014 respectively and 18% in 2015 which means that issued subscribed and paid up capital increased throughout all the years. Reserves have decreased in year 2012 by 118% and increased in 2013 by 847%, after that it decreased in next two years in 2014 and 2015 by 43% and 22% respectively which shows that company has utilized all its reserves for expansion of project. Due to expansion of project company has not sufficient reserves and company has not paid any dividend after 2011. 4) NON-CURRENT LIABILITIES: Non-current liabilities have also shown an increasing trend from 2011 to 2013 by 32.8%, 9% and 12% and decreased in 2014 and 2015 by 3% and 25% from respective years. Capital showing decreasing trend in 2012 and 2013 by 8% and 100%. Long term loans secured increase by 3% in 2012 and then it decreased 8% in 2013 it again increased in 2014 by 27% and decreased in 2015 by 26%. Liabilities against assets subject to finance lease increased from 2012 to 2014 by 2870%, 65% and 7% respectively and it decreased by 51% in 2015 from 2014. Long term deposits increased 187% in 2012 and then it decreased in 2013 to 2015 by 15%, 7% and 65% from respective years. Deferred liabilities decreased in 2012 and 2013 by 21% and 12% and increased 17% in 2014 and decreased 10% in 2015 from respective years. 5) CURRENT LIABILITIES: Total current liabilities have also shown an increasing trend. This is also in line with increase in current assets of the company. Short term financing is taken to meet the working capital requirements. Company is meeting its obligation on regular basis which is evident from an
  • 74.
    74 increase in thecurrent portion of long term debts under current liabilities head of the balance sheet. Trade payables decreased in 2012 by 251% which is at higher side and increased 27%, 7%, and 120% in 2013, 2014 and 2015 where as 10.98% in 2011 which is unfavorable for the company. Interest and mark up accrued decrease in 2012 by 25% and 44% in 2013 and increase in 2014 and 2015 by 40% and 54% respectively. Sales tax payable increase 340% in 2012 from 2011 which is huge change in 2013 it also increases 62% from 2012 and decrease 100% in 2014. Finally, size of the company has increased during the last five years. More investment is made in capital assets. Company is in expansion phase since the base year. Investment in new expansion project and technology is being made in order to keep pace with changing business environment.
  • 75.
    75 4.2.3 VERTICAL ANALYSISOF INCOME STATEMENT 2.11.1 Five Year Position Of Income Statement For the year ended June 30 2015 2014 2013 2012 2011 Sales- Net -2697% -3349% 455% 616% 312% Cost of goods sold -2412% -3009% 273% 413% 221% Gross Profit -285% -340% 182% 203% 91% Administrative And Selling expenses -309% -151% 17% 40% 20% Operating Operating/Loss 24% -189% 165% 162% 71% Other operating expenses 83% 8% -9% -16% -5% Other operating income -17% -13% 11% 8% 19% Profit/loss from operations 89% -194% 167% 155% 84% Financial & Other Voluntary separation scheme charges 230% 391% 29% 36% 28% Profit/loss before taxation 319% 197% 138% 119% 56% Taxation 219% 97% 38% 19% -44% Profit/loss after taxation 100% 100% 100% 100% 100% Vertical Analysis of Pioneer Cement Company Limited
  • 76.
    76 ANALYSIS: As we cansee from the vertical income statement the sales revenue increased from 2011 to 2013 by 312%, 6165 and 455% respectively and decreased by 3349% and 2697% in 2014 and 2015 respectively. Cost of sales also increased in 2011 by 221% in 2012 by 413% and in 2013 by 273% and in next two years it decrease in 2014 by 3009% and in 2015 by 2412%. Gross profit increase in 2011 by 91% 203% increase in 2012, 182% increase in 2013 and in 2014 and 2015 it decreased 340% and 285% respectively. Administrative and Selling expense also increase in 2011 to 2013 by 20%, 40% and 17% respectively and it decreases in 2014 by 151% and in 2015 by 309% from respective years. Other operating expense decreases from 2011 to 2013 by 5% in 2011, 16% in 2012 and 9% in 2013; it increased in 2014 by 8% from 2013 and increase in 2015 by 83% from 2014. Other operating income increased from 2011 to 2013 by 19%, 8% and 11% and decreased in 2014 by 13% and 17% in 2015. Financial and other voluntary separation charges showing increasing trend all five years it increased by 28% in 2011 36% in 2012, 29% in 2013, 391% in 2014 and 230% in 2015 from their respective years. .Profit before taxation has increased by 56% in 2011 119% in 2012, 138% in 2013, 197% in 2014 and 219% in 2015. Profit after taxation the company recorded loss in 2014 and in 2015 from their respective years. Finally the company is improving with the passage of time. Although the profits are not very adequate but the management is very confident that they are working hard and the company will prosper in coming years as most of the capital work has been completed.
  • 77.
    77 4.2.5. VERTICAL ANALYSISOF BALANCE SHEET VERTICAL ANALYSIS FOR LAST FIVE YEARS BALANCE SHEET As at June 30 2015 2014 2013 2012 2011 EQUITY AND LIABILITIES SHARE CAPITAL AND RESERVE Authorized Share Capital 0% 0% 0% 0% 0% Issue Subscribed & Paid Up Capital 19% 20% 19% 22% 22% Reserves 3% 5% 8% 1% -10% 22% 24% 28% 24% 13% Surplus on Revaluation of fixed assets- net of tax 26% 7% 9% 15% 0% NON-CURRENT LIABILITIES Redeemable capital 0% 0% 0% 2% 4% Long term financing-secured 1% 1% 5% 0% 0% Long term loans-secured 16% 27% 22% 29% 45% Long term Musharaka finance 0% 1% 1% 1% 0% Liabilities against assets subject to finance lease 2% 6% 5% 4% 0% Long term deposits 0% 0% 0% 0% 0% Long term creditor-unsecured 0% 0% 0% 0% 0% VERTICAL ANALYSIS FOR PAST FIVE YEARS OF PIONEER CEMENT
  • 78.
    78 Deferred liabilities 9%12% 10% 14% 29% Deferred tax liabilities 0% 0% 5% 3% 0% 28% 46% 49% 53% 78% CURRENT LIABILITIES Creditors against expansion project 0% 3% 4% 7% 0% Trade and other payables 8% 5% 4% 4% 2% Interest/ Mark up accrued 1% 1% 1% 1% 2% Short term Murabah-secured 0% 1% 0% 0% 0% Short term Musharaka secured 0% 0% 0% 0% 0% Short term finances 3% 0% 0% 0% 0% Short term borrowings 0% 0% 0% 0% 0% Current maturity of redeemable capital 0% 0% 0% 0% 0% Current maturity of long term loan 0% 0% 0% 1% 4% Current portion of long term loan 0% 0% 4% 0% 0% Current portion of liabilities against assets subject to finance lease 15% 13% 2% 0% 0% Current portion of deferred liability 0% 0% 2% 0% 0% Sales tax payable 0% 0% 0% 0% 0% 29% 23% 17% 14% 9% 105% 100% 102% 106% 100% ASSETS
  • 79.
    79 NON CURRENT ASSETS Property,plant and equipment 91% 87% 91% 93% 86% Long term loans 0% 0% 0% 0% 0% Long term deposits 1% 1% 1% 1% 1% Deferred tax assets 0% 0% 0% 0% 5% 92% 89% 93% 93% 91% CURRENT ASSETS Stock in trade 1% 2% 1% 1% 1% Store, spare and loose tools 4% 5% 4% 4% 6% Assets held for disposal 0% 0% 0% 0% 0% Trade Debts 0% 0% 0% 0% 1% Loan & advances 1% 0% 0% 1% 0% Deposits & prepayments 0% 0% 0% 0% 0% Other receivables 0% 0% 0% 0% 0% Current portion of long term deposits 0% 0% 0% 0% 0% Sales tax net 0% 0% 0% 0% 0% Taxation-net 0% 0% 0% 0% 0% Cash & bank balance 1% 4% 1% 0% 1% 8% 11% 7% 7% 9% 100% 100% 100% 100% 100%
  • 80.
    80 ANALYSIS: NON-CURRENT ASSETS: As wecan see from the vertical balance sheet of the company total fixed assets are constant in relation to total assets with little variations. The management is more focusing on working capital management than on fixed asset in last two years as shown by the vertical balance sheet. Property, plant and equipment have shown an increasing trend it increased in 2011 by 86% in 2012 by 93% in 2013 by 91% 87% in 2014 and 91% in 2015. CURRENT ASSETS: Total current assets have shown an increasing trend over the last five year period. Stores and spares decreased in year 2015, 2012 and 2013 by 4% and increased in 2011 by 6% and 2014 by 5%.Stock in trade has shown an increasing with a same sequence at the rate of 1% all the years except 2014 which is 2%. Stock in trade is about 1% of the total current assets in 2011, 2012, 2013 and 2015 and it was 2% of total assets in 2014. Stores and spares have the largest portion than stock of the total current assets. Trade debts 1% of total assets in 2011 and then no other year has significant effect on total current Asset affected by trade debts. Cash and bank balance were 1% in 2012, 1% in 2013 and 2015 and 4% in 2014. This trend shows that more funds are tied in receivable, inventories and in stores & spares. EQUITY AND LIABILITIES: Issued Subscribed and paid up capital showing mix trend in increase 22% in 2011 and 2012 contribute in total liabilities and then it decrease in 2013 by 19% contribution and in 2014 by 20% and in 2015 19% in total liabilities. Currently company is not paying dividends to shareholders. Reserves also decreased in 2011 by 10% and no major contribution in total liabilities in coming years.
  • 81.
    81 NON-CURRENT LIABILITIES: Total long-termliabilities of the company have shown decreasing trend in relation to total liabilities. It contributes in total liabilities by 78% in 2011, 53% in 2012, 49% in 2013, 46% in 2014 and 28% in 2015. CURRENT LIABILITIES: Current liabilities have shown an increasing trend during the last five years from 2011 to 2015 as shown in the vertical balance sheet of the company they contribute in total liabilities by 9% in 2011, 14% in 2012, 17% in 2013, 23% in 2014 and 29% in 2015 which is maximum and company got loss in 2014 and 2015. Trade and other payables have shown an increasing trend with a marginal increase in last five years. Trade and other payables increase in 2015 by 8% and 2014 by 5% than their respective years, in 2013 and 2012 they were 4% and 2%in 2011. TREND ANALYSIS Trend Analysis is a comparative analysis of a company's financial ratios over time. SIGNIFICANCE: It is an aspect of technical analysis that tries to predict the future movement of a stock based on past data. Trend analysis is based on the idea that what has happened in the past gives traders an idea of what will happen in the future. BALANCE SHEET As at June 30 2015 2014 2013 2012 2011 EQUITY AND LIABILITIES SHARE CAPITAL AND RESERVE Authorized Share Capital 100% 100% 100% 100% 100% Issue Subscribed & Paid Up Capital 209% 177.9% 170.3% 162.1% 100% BALANCE SHEET
  • 82.
    82 Reserves -75.8% -97.3%-170.4% -17.9% 100% 422.8% 384.5% 425.9% 297.3% 100% Surplus on Revaluation of fixed assets-net of tax 0% 0% 0% 0% 0% NON-CURRENT LIABILITIES Redeemable capital 0% 0% 0% 92.1% 100% Long term financing-secured 0% 39.1% 231.6% 0% 0% Long term loans-secured 89.02% 0% 0% 0% 0% Long term Musharaka finance 0% 0% 0% 0% 0% Liabilities against assets subject to finance lease 2493.6% 5102.5% 165.3% 2880.07% 100% Long term deposits 79.4% 226.1% 242.5% 286.5% 100% Long term creditor-unsecured 0% 0% 0% 0% 0% Deferred liabilities 73.2% 81.7% 69.8% 78.87% 100% Deferred tax liabilities 0% 0% 0% 0% 0% 87.8% 108.01% 121.9% 109.01% 100% CURRENT LIABILITIES Creditors against expansion project 0% 0% 0% 0% 0% Trade and other payables 1046.2% 476.1% 446.5% 351.04% 100% Interest/ Mark up accrued 109.7% 71.38% 41.9% 75% 100% Short term Murabah-secured 0% 0% 0% 0% 0% Short term Musharaka secured 0% 0% 0% 0% 0% Short term finances 0% 0% 0% 0% 100% Short term borrowings 0% 0% 0% 0% 0% Current maturity of redeemable capital 0% 0% 0% 192.9% 0%
  • 83.
    83 Current maturity oflong term loan 0% 0% 0% 35.6% 100% Current portion of long term loan 0% 0% 0% 0% 0% Current portion of liabilities against assets subject to finance lease 0% 0% 2158.4% 211.9% 100% Current portion of deferred liability 0% 0% 0% 0% 0% Sales tax payable 0% 0% 710.9% 440.2% 0% 779.8% 521.9% 287.1% 130.7% 100% - - 364.9% 258.3% 100% ASSETS NON CURRENT ASSETS FIXED CAPITAL EXPENDITURE Property, plant and equipment 261.6% 205.3% 210.1% 174.5% 100% Long term loans 107.7% 121.7% 75.37% 112.8% 100% Long term deposits 456.5% 343.4% 268.6% 155.4% 100% Deferred tax assets - - - - - 249.6% 197.03% 121.2% 165.6% 100% CURRENT ASSETS Stock in trade 135.2% 295.8% 170.3% 111.8% 100% Store, spare and loose tools 167.6% 163.4% 130.9% 112.6% 100% Assets held for disposal - - - - - Trade Debts 162.3% 120% 50.5% 76.7% 100% Loan & advances 1062.1% 414.9% 230.3% 1038.6% 100%
  • 84.
    84 Deposits & prepayments15.9% 38.8% 57.8% 68.4% 100% Other receivables 366.1% 4.27% 65.5% 121.8% 100% Current portion of long term deposits - - - - - Sales tax net - - - - - Taxation-net 80.8% 0% 82.16% 92.3% 100% Cash & bank balance 372.4% 817.4% 192.4% 46.9% 100% 199.3% 244.6% 156.4% 117.1% 100% 244.9% 201.4% 196.6% 161.1% 100% ANALYSIS: NON-CURRENT ASSETS: As we can see from the balance sheet of the company total fixed assets are constant in relation to total assets with little deviations. The management is more focusing on fixed asset in past years. As property, plant and equipment have shown an increasing trend. CURRENT ASSETS: Total current assets have shown an increasing trend over the last five year period. Stores and spares increased consistently over the years. Stock in trade has shown an increasing with a same sequence. Loans and advances have the largest portion than stock of the total current assets. This trend shows that more funds are needed. EQUITY AND LIABILITIES: Issued Subscribed and paid up capital showing mix trend in increase that there is increase in 2012 andin2013 where as there is a decrease in 2014 and in increase in 2015 in total liabilities as currently company is not paying dividends to shareholders
  • 85.
    85 NON-CURRENT LIABILITIES: Total long-termliabilities of the company have shown decreasing trend in relation to total liabilities. CURRENT LIABILITIES: Current liabilities have shown an substantially mix trend during the last five years from 2011 to 2015 as shown in the balance sheet of the company they contribute in total liabilities. INCOME STATEMENT PIONEER CEMENT COMPANY LIMITED FIVE YEAR POSITION OF INCOME STATEMENT For the year ended June 30 2015 2014 2013 2012 2011 Gross Turnover 337.4% 237.3% 212.0% 142.9% 100% Excise Duty 288.8% 238.6% 210.9% 115.6% 100% Sales Tax 261.8% 218.9% 192.2% 125.03% 100% Commission 226.2% 227.1% 104.8% 98.18% 100% 275.9% 23.78% 169.5% 118.78% 100% Net turnover 367% 236.7% 232.5% 154.6% 100% Cost of sales 463.6% 300.5% 197.1% 146.57% 100% Gross Profit 132.8% 82.3% 318.2% 174.08% 100% Distribution Cost 1649.1% 192.7% 138.8% 241.90% 100% Administrative And Selling expenses 155.2% 149.8% 127.6% 112.69% 100% - - 131.2% 155.03% 100% Other operating income-net 39% 14.8% 90.63% 34.63% 100% - - 313.65% 149.5% 100%
  • 86.
    86 ANALYSIS: As we cansee from the income statement the gross turnover has increased from 2011 to 2015 as excise duty and sales tax has increased in these years where as there is a 1%decrease in commission in 2015.There is a substantial increase in net turnover as trend of cost of sales has increased. There was a increase in 2012 and 2013 in gross profit then company start facing losses in 2014 and 2015 because there distribution cost and administrative expenses increases which was due to the flaw in the management of the company. The finance cost and other charges have also increased which assist the losses of the company. Finally the company is improving with the passage of time. Although the profits are not very adequate but the management is very confident that they are working hard and the company will prosper in coming years as most of the capital work has been completed. 4.3. RATIO ANALYSIS Finance Cost 351.8% 311.5% 167.7% 102.8% 100% Other Charges 639.3% 30.49% 25.12% 222.8% 100% - - 181.55% 122.7% 100% Profit before taxation -240.9% -77.4% 391.6% 165.3% 100% Taxation -211.7% -48.8% -138.18% -33.23% 100% Profit after taxation -42.41% 22.03% 159.3% 78.27% 100%
  • 87.
    87 4.3.1. LIQUIDITY RATIOS Liquidityratios are the ratios for testing short term solvency or financial position of a business. These are designed to test the ability of the business to meet its short term obligation promptly, a class of financial metrics that IS used to determine a company's ability to pay off its short-terms debts obligations. Generally, the higher the value of the ratio, the larger the margin of safety that the company possesses to cover its short-term debts 4.3.2. CURRENT RATIO: Current ratio may be defined as the relationship between current assets and current liabilities. This ratio is also known as "working capital ratio". It is a measure of general liquidity and is most widely used to make the analysis for short term financial position or liquidity of a firm. It is calculated by dividing the total of the current assets by total of the current liabilities. COMPONENTS: The two basic components of this ratio are current assets and current liabilities. Current assets include cash and those assets which can be easily converted into cash within a short period of time, generally, one year, such as marketable securities or readily realizable investments, bills receivables, sundry debtors, (excluding bad debts or provisions), inventories, work in progress, etc. Prepaid paid expenses should also be included in current assets because they represent payments made in advance which will not have to be paid in near future. Current liabilities are those obligations which are payable within a short period of tie generally one year and include outstanding expenses, bills payable, sundry creditors, bank overdraft, accrued expenses, short term advances, income tax payable, dividend payable, etc. However, sometimes a controversy arises that whether overdraft should be regarded as current liability or not. Often an arrangement with a bank may be regarded as permanent and therefore, it may be treated as long term liability. At the same time the fact remains that the overdraft facility may be cancelled at any time. Accordingly, because of this reason and the need for conversion in interpreting a situation, it seems advisable to include overdrafts in current liabilities.
  • 88.
    88 LIMITATIONS OF CURRENTRATIO: This ratio is measure of liquidity and should be used very carefully because it suffers from many limitations. It is, therefore, suggested that it should not be used as the sole index of short term solvency 1. It is crude ratio because it measures only the quantity and not the quality of the current assets. 2. Even if the ratio is favorable, the firm may be in financial trouble, because of more stock and work in process which is not easily convertible into cash, and, therefore firm may have less cash to pay off current liabilities. 3. Valuation of current assets and window dressing is another problem. This ratio can be very easily manipulated by overvaluing the current assets. An equal increase in both current assets and current liabilities would decrease the ratio and similarly equal decrease in current assets and current liabilities would increase current ratio. SIGNIFICANCE: This ratio is a general and quick measure of liquidity of a firm. It represents the margin of safety or cushion available to the creditors. It is an index of the firm‟s financial stability. It is also an index of technical solvency and an index of the strength of working capital. A relatively high current ratio is an indication that the firm is liquid and has the ability to pay its current obligations in time and when they become due. On the other hand, a relatively low current ratio represents that the liquidity position of the firm is not good and the firm shall not be able to pay its current liabilities in time without facing difficulties. An increase in the current ratio represents improvement in the liquidity position of the firm while a decrease in the current ratio represents that there has been deterioration in the liquidity position of the firm. A ratio equal to or near 2: 1 is considered as a standard or normal or satisfactory. The idea of having double current assets as compared to current liabilities is to provide for the delays and losses in the realization of current assets. However, the rule of 2:1 should not be blindly used while making interpretation of the ratio. Firms having less than 2 : 1 ratio may be having a better liquidity than even firms having more than 2 : 1 ratio. This is because of the reason that current ratio measures the quantity of the current assets and not the quality of the current assets. If a firm's current assets include debtors which are not recoverable or stocks which are slow-moving or obsolete, the current ratio may be high but it does not represent a good liquidity position.
  • 89.
    89 Current Ratio. Formula CurrentAssets/Current Liabilities Years 2015 2014 2013 2012 2011 Pioneer Cement 0.26 0.48 0.56 0.92 1.03 Cherat Cement 1.07 2.28 2.45 3.07 2.47 Kohat Cement 0.66 1.00 2.56 1.47 1.24 ANALYSIS: Current Ratio clears the extent to which the claim of short term creditors can be met by assets that are to become cash within a year. The best standard ratio is 2:1 so, the Pioneer Cement has current ratio below standard. There is a decrease in 2011 to 2015. Current Ratio of Kohat Cement is more than Pioneer and Cherat cement. Current ratio shows that how many times current assets are available to meet its current liabilities. Pioneer cement current ratio shows decreasing trend and it has less than 1:1 but only 0 0.5 1 1.5 2 2.5 3 3.5 2015 2014 2013 2012 2011 Pioneer Cement Cherat Cement Kohat Cement 4.3.2. CURRENT RATIO
  • 90.
    90 in 2011 itis more than 1:1. Cherat cement also shows decreasing trend in current ratio. Kohat cement current ratio shows increasing trend in 2011, 2012 and in 2013 but decreases in 2014 and 2015 which shows that it has less current assets or current liabilities increases. 4.3.3. QUICK RATIO: Liquid ratio is also termed as "Liquidity Ratio”,” Acid Test Ratio" or "Quick Ratio". It is the ratio of liquid assets to current liabilities. The true liquidity refers to the ability of a firm to pay its short term obligations as and when they become due COMPONENTS: The two components of liquid ratio (acid test ratio or quick ratio) are liquid assets and liquid liabilities. Liquid assets normally include cash, bank, sundry debtors, bills receivable and marketable securities or temporary investments. In other words they are current assets minus inventories (stock) and prepaid expenses. Inventories cannot be termed as liquid assets because it cannot be converted into cash immediately without a loss of value. In the same manner, prepaid expenses are also excluded from the list of liquid assets because they are not expected to be converted into cash. Similarly, Liquid liabilities means current liabilities i.e., sundry creditors, bills payable, outstanding expenses, short term advances, income tax payable, dividends payable, and bank overdraft (only if payable on demand). Some time bank overdraft is not included in current liabilities, on the argument that bank overdraft is generally permanent way of financing and is not subject to be called on demand. In such cases overdraft will be excluded from current liabilities SIGNIFICANCE: The quick ratio/acid test ratio is very useful in measuring the liquidity position of a firm. It measures the firm's capacity to pay off current obligations immediately and is more rigorous test of liquidity than the current ratio. It is used as a complementary ratio to the current ratio. Liquid ratio is more rigorous test of liquidity than the current ratio because it eliminates inventories and prepaid expenses as a part of current assets. Usually a high liquid ratio an indication that the firm
  • 91.
    91 is liquid andhas the ability to meet its current or liquid liabilities in time and on the other hand a low liquidity ratio represents that the firm's liquidity position is not good. As a convention, generally, a quick ratio of "one to one" (1:1) is considered to be satisfactory. Although liquidity ratio is more rigorous test of liquidity than the current ratio, yet it should be used cautiously and 1:1 standard should not be used blindly. A liquid ratio of 1:1 does not necessarily mean satisfactory liquidity position of the firm if all the debtors cannot be realized and cash is needed immediately to meet the current obligations. In the same manner, a low liquid ratio does not necessarily mean a bad liquidity position as inventories are not absolutely non- liquid. Hence, a firm having a high liquidity ratio may not have a satisfactory liquidity position if it has slow-paying debtors. On the other hand, a firm having a low liquid ratio may have a good liquidity position if it has a fast moving inventory. Though this ratio is definitely an improvement over current ratio, the interpretation of this ratio also suffers from the same limitations as of current ratio Quick Ratio Formula Current Asset-stock/current liabilities Years 2015 2014 2013 2012 2011 Pioneer Cement 0.24 0.41 0.47 0.81 0.9 Cherat cement 0.94 2.07 2.17 2.88 2.25 Kohat Cement 0.57 0.78 2.34 1.41 1.18
  • 92.
    92 ANALYSIS: The acid testratio is also below standard due to heavy short term borrowings. Pioneer acid test ratio decreased in year 2012, 2013, 2014 and in 2015. The quick ratio of Kohat cement shows that sufficient liquid asset is available to discharge and settle its current obligation. The rise in current liabilities is due to the expansion of project and short and long term financing. Pioneer Cement liquidity is less than standard. Kohat and Cherat cement liquidity is on considerable point. Kohat cement liquid ratio is more than pioneer and Cherat which shows that it has more liquidity. Cherat liquidity position is considerable because it is near to 1 which shows that it has liquid assets to meet its current liabilities. Pioneer position is not at considerable point. It shows decreasing trend and less than 1:1. 0 0.5 1 1.5 2 2.5 3 3.5 2015 2014 2013 2012 2011 Pioneer Cement Cherat cement Kohat Cement
  • 93.
    93 4.3.4. TURNOVER/ACTIVITY RATIOS: Activityratios are measures of how well assets are used. Activity ratios -- which are, for the most part, turnover ratios can be used to evaluate the benefits produced by specific assets, such as inventory or accounts receivable. Or they can be use to evaluate the benefits produced by all a company's assets collectively. These measures help us gauge how effectively the company is at putting its investment to work. A company will invest in assets – e.g., inventory or plant and equipment – and then use these assets to generate revenues. The greater the turnover, the more effectively the company is at producing a benefit from its investment in assets INVENTORY DAYS: The number of day‟s inventory is also known as average inventory period and inventory holding period. A high number of days inventory indicates that there is a lack of demand for the product being sold. A low days inventory ratio (inventory holding period) may indicate that the company is not keeping enough stock on hand to meet demands. The number of day‟s inventory and inventory turnover ratios are included in the financial statement ratio analysis spreadsheets highlighted in the left column, which provide formulas, definitions, calculation, charts and explanations of each ratio.
  • 94.
    94 ANALYSIS: Pioneer inventory daysdecreased in 2012 as compare to 2011 and increased in 2013 and in 2014 and show decreasing in 2015 which shows that management is efficient for managing inventory period. 0 10 20 30 40 50 60 2015 2014 2013 2012 2011 Pioneer Cement Cherat Cement Kohat Cement Inventory Days Formula Inventory Days = Inventory / Cost of Sales*365 Years 2015 2014 2013 2012 2011 Pioneer Cement 6 20 19 15 20 Cherat Cement 24 40 21 23 6.67 Kohat Cement 49 38 28 8 6 INVENTORY DAYS
  • 95.
    95 The above diagramshows that in 2011 and 2012 Kohat cement has less inventory days required to convert stock in sale which shows that Kohat management is efficient but it decreases with the passage of times and Pioneer trend is opposite to Kohat. It was low in beginning and it increases in 2015, but Cherat Cement shows mixed trend. 4.3.5. DEBTORS TURNOVER RATIO OR RECEIVABLES TURNOVER RATIO: Debtor‟s turnover ratio indicates the velocity of debt collection of a firm. In simple words it indicates the number of times average debtors (receivable) are turned over during a year. SIGNIFICANCE OF THE RATIO: This ratio indicates the number of times the debtors are turned over a year. The higher the value of debtors, turnover the more efficient is the management of debtors or more liquid the debtors are. Similarly, low debtors turnover ratio implies inefficient management of debtors or less liquid debtors. It is the reliable measure of the time of cash flow from credit sales. There is no rule of thumb which may be used as a norm to interpret the ratio as it may be different from firm to firm.
  • 96.
    96 0 5 10 15 20 25 30 35 40 2015 2014 20132012 2011 Pioneer Cement Cherat Cement Kohat Cement Debtor days. Formula Trade debtors/Credit sales*365 Years 2015 2014 2013 2012 2011 Pioneer Cement 3 3 1 3 7 Cherat Cement 35 19 10 8 9 Kohat Cement 4 5 3 5 7 DEBTOR DAYS
  • 97.
    97 ANALYSIS: Graph shows thatPioneer cement has good debtor management to receive the debt or collect the receivables and shows positive trend and debtor‟s collection period is less than creditor‟s period. Kohat position is also considerable but Cherat management has more time to collect their receivables whish shows inefficient debtor management and in 2015 it is at highest point which indicates unfavorable situation regarding to debtor collection period. 4.3.6. TOTAL ASSETS TURNOVER RATIO: The total assets turnover ratio measures the use of all assets in terms of sales, by comparing sales with net total assets. This interactive tutorial walks you through the calculations as well as where on the financial statements to find the numbers. Total Asset Turnover Formula Sales/ Total Assets Years 2015 2014 2013 2012 2011 Pioneer Cement 0.46 0.36 0.37 0.30 0.31 Cherat Cement 0.68 0.74 0.67 0.74 0.95 Kohat Cement 0.18 0.26 0.76 1.04 1.10 TOTAL ASSET TURNOVER
  • 98.
    98 ANALYSIS: In the abovegraph we can see that total asset turnover ratio of Pioneer cement company showing mix trend in the year 2015 total asset total asset turnover ratio is at highest level and as it compare it with Cherat and Kohat cement it is better in the last two year 2014,2015 so we can say it is using its assets for generating the revenue in a better way than Kohat and Cherat cement in 2011,2012 and 2013 Kohat cement total asset turnover ratio at top so they use much of it for generating revenue. But pioneer overall situation regarding to total asset turnover ratio is better than other two competitors. 4.3.7. FIXED ASSETS TURNOVER RATIO: Fixed assets turnover ratio is also known as sales to fixed assets ratio. This ratio measures the efficiency and profit earning capacity of the concern. Higher the ratio, greater is the intensive utilization of fixed assets. Lower ratio means under-utilization of fixed assets 0 0.2 0.4 0.6 0.8 1 1.2 2015 2014 2013 2012 2011 Pioneer Cement Cherat Cement Kohat Cement
  • 99.
    99 0 0.5 1 1.5 2 2.5 3 3.5 2015 2014 20132012 2011 Pioneer Cement Cherat Cement Kohat Cement Fixed Asset Turnover Ratio Formula Cost of sales / Fixed Assets Years 2015 2014 2013 2012 2011 Pioneer Cement 0.51 0.42 0.41 0.32 0.36 Cherat Cement 0.39 0.2 0.35 0.51 0.61 Kohat Cement 1.46 1.52 2.12 2.95 2.32 FIXED ASSETS TURNOVER RATIO
  • 100.
    100 ANALYSIS: It shows theutilization of fixed assets, Pioneer increasing the utilization of its fixed assets but it has lower times than Kohat cement which has more utilization of fixed assets and at highest level in 2012. Cherat Cement shows the mixed trend and has less utilization than Kohat and Pioneer cement. 4.4.1. PROFITABLITY RATIOS: Profitability ratios (also referred to as profit margin ratios) compare components of income with sales. They give us an idea of what makes up a company's income and are usually expressed as a portion of each dollar of sales. The profit margin ratios we discuss here differ only by the numerator. It's in the numerator that we reflect and thus evaluate performance for different aspects of the business: The gross profit margin is the ratio of gross income or profit to sales. This ratio indicates how much of every dollar of sales is left after costs of goods sold. 4.4.2. GROSS PROFIT (GP) RATIO: Gross profit ratio (GP ratio) is the ratio of gross profit to net sales expressed as a percentage. It expresses the relationship between gross profit and sales. COMPONENTS: The basic components of the calculation of gross profit ratio are gross profit and net sales. Net sales means sales minus sales returns. Gross profit would be the difference between net sales and
  • 101.
    101 cost of goodssold. Cost of goods sold in the case of a trading concern would be equal to opening stock plus purchases, minus closing stock plus all direct expenses relating to purchases. In the case of manufacturing concern, it would be equal to the sum of the cost of raw materials, wages, direct expenses and all manufacturing expenses. In other words, generally the expenses charged to profit and loss account or operating expenses are excluded from the calculation of cost of goods sold. SIGNIFICANCE: Gross profit ratio may be indicated to what extent the selling prices of goods per unit may be reduced without incurring losses on operations. It reflects efficiency with which a firm produces its products. As the gross profit is found by deducting cost of goods sold from net sales, higher the gross profit better it is. There is no standard GP ratio for evaluation. It may vary from business to business. However, the gross profit earned should be sufficient to recover all operating expenses and to build up reserves after paying all fixed interest charges and dividends. Gross profit to Sales: Formula Gross profit/Sales*100 Years 2015 2014 2013 2012 2011 Pioneer Cement 10.58% 10.16% 40.00% 32.91% 29.23% Cherat Cement 5.95% 14.41% 40.68% 35.67% 34.33% Kohat Cement 6.35% 22.09% 51.55% 38.72% 35.45% GROSS PROFIT TO SALES
  • 102.
    102 Analysis: Gross profit ofPioneer cement company increasing in 2011 to 2013 but decrease in 2014 to 2015. Due to inflation and economic instability in Pakistan and irregular power supply of WAPDA in 2014 and 2015. Gross Profit ratio of three competitors show increasing trend in 2011 to 2013 due to good economic and financial situation of world and good market situation in Pakistan. Kohat position is more considerable up to 2013 but shows decreasing trend in 2014 and 2015, and Cherat Cement also has same situation. 4.4.3. OPERATING PROFIT RATIO: Operating ratio is the ratio of cost of goods sold plus operating expenses to net sales. It is generally expressed in percentage. It measures the cost of operations per dollar of sales. This is closely related to the ratio of operating profit to net sales. COMPONENTS: The two basic components for the calculation of operating ratio are operating cost (cost of goods sold plus operating expenses) and net sales. Operating expenses normally include (a) 0.00% 10.00% 20.00% 30.00% 40.00% 50.00% 60.00% 2015 2014 2013 2012 2011 Pioneer Cement Cherat Cement Kohat Cement
  • 103.
    103 administrative and officeexpenses and (b) selling and distribution expenses. Financial charges such as interest, provision for taxation etc. are generally excluded from operating expenses. SIGNIFICANCE: Operating ratio shows the operational efficiency of the business. Lower operating ratio shows higher operating profit and vice versa. An operating ratio ranging between 75% and 80% is generally considered as standard for manufacturing concerns. This ratio is considered to be a yardstick of operating efficiency but it should be used cautiously because it may be affected by a number of uncontrollable factors beyond the control of the firm. Moreover, in some firms, non- operating expenses from a substantial part of the total expenses and in such cases operating ratio may give misleading results Operating Profit Margin Formula Operating Profit Margin = Operating profit /Sale*100 Years 2015 2014 2013 2012 2011 Pioneer Cement -3.13% 5.79% 36.74% 25.16% 26.89% Cherat Cement 4.38% 4.18% 34.14% 29.57% 32.31% Kohat Cement 1.57% 17.91% 49.24% 35.86% 32.25% OPERATING PROFIT RATIO
  • 104.
    104 ANALYSIS: Pioneer cement companyoperating profit increasing in 2011 to 2013 and decreasing in 2014 and 2015 and in 2015 they suffer loss by 3.13% due to increase in prices of coal, diesel and empty bag in 2014-2015 Operating profit of all three organization show increasing trend in 2011, 2012, and 2013 but decreases in 2014 and 2015due to increase in operating expenses. 4.4.4. RETURN ON ASSETS: Where asset turnover tells an investor the total sales for each $1 of assets, return on assets tells an investor how much profit a company generated for each $1 in assets. The return on assets figure is also a sure-fire way to gauge the asset intensity of a business. Companies such as telecommunication providers, car manufacturers, and railroads are very asset-intensive, meaning they require big, expensive machinery or equipment to generate a profit. Advertising agencies and software companies, on the other hand, are generally very asset-light. -10.00% 0.00% 10.00% 20.00% 30.00% 40.00% 50.00% 60.00% 2015 2014 2013 2012 2011 Pioneer Cement Cherat Cement Kohat Cement
  • 105.
    105 Return on Assets: FormulaNet Income / Total Assets*100 Years 2015 2014 2013 2012 2011 Pioneer Cement -1.72% -1.10% 8.00% 4.80% 9.90% Cherat Cement 0.23% 5.21% 14.88% 15.99% 19.50% Kohat Cement -2.92% 0.83% 25.68% 23.40% 22.97% ANALYSIS: This ratio measures the return of total investment of the business. Pioneer cement company show mix trend in 2011 it is at maximum point than decrease in 2012 and again increase in 2013 and then become negative in 2014 and 2015. Kohat cement company return on asset is much better than Cherat and pioneer it decreases in 2011 to 2013 and then decrease in 2014 and becomes negative in 2015, it is at highest point in 2013, Cherat also increase in 2011 to 2012 and then it little decrease in 2013 and at goes down in 2014 and becomes negative in 2015. -5.00% 0.00% 5.00% 10.00% 15.00% 20.00% 25.00% 30.00% 2015 2014 2013 2012 2011 Pioneer Cement Cherat Cement Kohat Cement RETURN ON ASSETS
  • 106.
    106 4.4.5. RETURN ONEQUITY (ROE) RATIO: In real sense, ordinarily shareholders are the real owners of the company. They assume the highest risk in the company. (Preference share holders have a preference over ordinary shareholders in the payment of dividend as well as capital. Preference share holders get a fixed rate of dividend irrespective of the quantum of profits of the company). The rate of dividends varies with the availability of profits in case of ordinary shares only. Thus ordinary shareholders are more interested in the profitability of a company and the performance of a company should be judged on the basis of return on equity capital of the company. Return on equity capital which is the relationship between profits of a company and its equity, can be calculated as follows. COMPONENTS: Equity share capital should be the total called-up value of equity shares. As the profit used for the calculations are the final profits available to equity shareholders as dividend, therefore the preference dividend and taxes are deducted in order to arrive at such profits. SIGNIFICANCE: This ratio is more meaningful to the equity shareholders who are interested to know profits earned by the company and those profits which can be made available to pay dividends to them. Interpretation of the ratio is similar to the interpretation of return on shareholder's investments and higher the ratio better is. RETURN ON EQUITY RATIO (ROE) Formula [(Net profit after tax − Preference dividend) / Equity share capital] × 100 Years 2015 2014 2013 2012 2011 Pioneer Cement -7.80% -4.46% 29.11% 20.48% 77.81% Cherat Cement 1.08% 29.77% 54.70% 77.04% 80.08% Kohat Cement -9.55% 2.09% 34.58% 35.73% 42.09%
  • 107.
    107 ANALYSIS: In 2011 Pioneercement company return on equity ratio is at highest point and better, in 2012 it decreases and in 2013 it is better than 2012 but in 2014 and 2015 it goes down and become negative. Kohat Cement Company also shows decreasing trend it is highest point in 2011 and then decrease in 2012 to 2014 and it becomes negative in 2015. Cherat cement company return on equity ratio has mix trend in 2011 it is at lower side and then it increase in 2012 and it decrease in 2013 and it goes down and become negative in 2014 and 2015. -20.00% -10.00% 0.00% 10.00% 20.00% 30.00% 40.00% 50.00% 60.00% 70.00% 80.00% 90.00% 2015 2014 2013 2012 2011 Pioneer Cement Cherat Cement Kohat Cement
  • 108.
    108 4.4.6. DEBT RATIOS: Acompany can finance its assets either with equity or debt. Financing through debt involves risk because debt legally obligates the company to pay interest and to repay the principal as promised. Equity financing does not obligate the company to pay anything -- dividends are paid at the discretion of the board of directors. There is always some risk, which we refer to as business risk, inherent in any operating segment of a business. Financial leverage ratios are used to assess how much financial risk the company has taken on. There are two types of financial leverage ratios: component percentages and coverage ratios. Component percentages compare a company's debt with either its total capital (debt plus equity) or its equity capital. Coverage ratios reflect a company's ability to satisfy fixed obligations, such as interest, principal repayment, or lease payments. Debt to Equity Ratio: Debt-to-Equity ratio indicates the relationship between the external equities or outsiders funds and the internal equities or shareholders funds. It is also known as external internal equity ratio. It is determined to ascertain soundness of the long term financial policies of the company. Debt to Equity Ratio: Formula Total Long Term Debts / Shareholders Funds Years 2015 2014 2013 2012 2011 Pioneer Cement 31:69 52:48 48:52 52:48 86:14 Cherat Cement 13:20 39:50 1:9:50 1:51:100 37:50 Kohat Cement 67:33 55:45 10:90 10:90 22:78
  • 109.
    109 ANALYSIS: Pioneer cement debtto equity ratio is higher point in 2011 and after that it has improved its situation in next coming years and decreases, but Kohat shows increasing trend from 2011 to 2015 which shows that they increasing their debts for expansion of project and their short and long term debts increased. Cherat computation of the ratio brings to life the fact that Cherat cement has not been able to feed its financing through equity as its ratios are considerable higher than the favorable“ 1 or less”. The initial year shows that there was less dependency of debt but there has been a visible increase in the ratio ever since, the last year shows a phenomenal increase and highly unfavorable. The firm must by all means try and reduce its portions as the dependency on debt causes the firm to lose its control and will over the organization as it is then driven to feed the debt. 0 0.5 1 1.5 2 2.5 3 3.5 4 2015 2014 2013 2012 2011 Pioneer Cement Cherat Cement Kohat Cement
  • 110.
    110 4.4.7. DEBT SERVICERATIO OR INTEREST COVERAGE RATIO: Interest coverage ratio is also known as debt service ratio or debt service coverage ratio. This ratio relates the fixed interest charges to the income earned by the business. It indicates whether the business has earned sufficient profits to pay periodically the interest charges. SIGNIFICANCE OF DEBT SERVICE RATIO:The interest coverage ratio is very important from the lender's point of view. It indicates the number of times interest is covered by the profits available to pay interest charges. Formula Net Profit Before Interest and Tax / Fixed Interest Charges] Years 2015 2014 2013 2012 2011 Pioneer cement 0.39 0.31 5.73 4.26 3.03 Cherat 0.30 4.27 9.94 21.10 30.96 Kohat Cement -4.71 1.23 20.21 25.17 17.22 INTEREST COVERAGE RATIO
  • 111.
    111 ANALYSIS: Interest Cover Ratioshows that how many times interest is earned by the company. Pioneer cement company shows increasing trend from 2011 to 2013 which indicates positive sign and beneficial for the company and it has availability of the funds to pay interest expense. In 2014 and 2015 it goes down which means it is not good sign for the company to pay the interest expense. Kohat Cement Company and Cherat Cement is in better position to Cherat and pioneer cement, In year 2012 Kohat Cement earned 17.22 times interest which is higher among all year and easy to pay the interest expense. In 2014 and 2015 Interest cover ration of all the company is not very healthy and it shows that the financial costs are very high and earnings are very low. Management must look into the matter and should improve this ratio. Cherat cement was able to very comfortably cover this cost in the early years but by its growth the inabilities started to show although revenues are rising but the interest charges to be paid by the enterprise are also rising as the revenues are only resulting due to the rising financing through debt. The debt, especially the short term financing, needs to be curtailed as they will not result in Cherat Cement‟s well being. -10 -5 0 5 10 15 20 25 30 35 2015 2014 2013 2012 2011 Pioneer cement Cherat Kohat Cement
  • 112.
    112 4.5. GENERAL RATIOANALYSIS 4.5.1. PROFITABILITY ANALYSIS: According to the scenario, the cement sector is experiencing strong growth in cement dispatches, but at the same time, is facing decline in profitability during 2015. Although the sales volume in the sector increased, the net sales revenue did not increase as much due to decrease in net retention. Over the years all cement manufacturers undertook huge capacity expansion plans which have now created a situation of excess supply in the local market. Companies resorted to price wars and this led to a fall in prices. As per the industry trend of declining profitability, Pioneer Cement also posted an overall loss of 179 million in 2015. The Profitability ratios of Pioneer Cement indicate that Pioneer, like many other companies in the cement sector, has been plagued by lower earnings. The gross profit margin fell drastically in 2014 and fell slightly in 2015 as well. Pioneer's rising operating expenses and finance costs have led negative net profit margin. Similarly return on assets and return on equity have also fallen. The prices of imported coal had shot up during the last fiscal year and caused a major rise in the cost of production. Crude oil prices had also seen an extraordinary rise last fiscal year. As fuel costs are the largest portion of production costs of the Pioneer Cement, the price increase had deeply hit the profitability of the company in 2015. For Pioneer Cement, the prices of packaging material went up and formed 14% to total production costs. Fuel and electricity costs form 60% of the cost of sales and higher electricity tariffs and fuel costs affected the earnings of the company in 2015.The cost of production went up due to rise in the prices of imported coal. Company had an impact of Rs 149 million on earnings due to devaluation of rupee against the US dollar and Japanese yen in the form of exchange losses. Financial cost also increased due to higher interest rates in the economy. The profitability ratios indicate that Pioneer Cement, like many other companies in the cement sector, has been weighed down by lower earnings. Pioneer's rising operating expenses and financial costs have led to negative impact on the net profit margins. Similarly, return on assets and return on equity have also fallen.
  • 113.
    113 4.5.2. LIQUIDITY ANALYSIS: Theliquidity position of the company has been weakening over the years, due to substantial rise in the current liabilities. Pioneer felt a liquidity crunch, like many other companies in the cement sector due to the price war and losses caused by that in 2015. The current liabilities of Pioneer have also increased to Rs 2.987 billion during 2015, backed mainly by increased short-term borrowings by the company. To solve the liquidity problem, Pioneer has initiated a process of restructuring its debt by issuing Sukuk of Rs 2.5 billion in 2015. This will help the company to liquidate its excessive current liabilities. It will also help to control company's finance costs. Also, Pioneer will issue shares to the National Bank of Pakistan due to its inability to pay its loans. This restructuring would give a breather to the company whose current ratio was steadily moving downhill. During 2015, the composition of current assets changed such that the most liquid assets: cash and bank balances constituted 18%, trade debts 5% and inventory 9% of total current assets. Stores, spares and tools are highly illiquid assets and they form a major portion of the company's current assets. Industry‟s position, though not ideal, is at least much better than the Pioneer Cement. In fact, it is the only company in the cement sector, which has the liquidity ratio of below 0.5. 4.5.3. DEBT ANALYSIS: The debt to assets ratio depicts how Pioneer Cement financed. Each year, the company is being increasingly financed by equity rather than debt. In 2011, debt financed 87% of assets while in 2015 debt only contributed to 56% of the total assets. The company's debt to asset ratio has not fluctuated much because over the years because assets and liabilities have grown more or less in the same proportions. The debt to equity ratio fell during 2012 and 2013 indicating that the company was financing its growth by equity. In 2012, the equity of the company rose by 197% while liabilities increased only by 11%. In 2014 the equity fell as the reserves fell owing to the loss made during that fiscal year. This caused a slight increase in Debt to Equity ratio in 2014. In 2015 the debt to equity ratio has declined owing largely to a fall in the debt. The company is trying to restructure its financing composition in favor of equity by issuing Sukuk financing and convertible loan into
  • 114.
    114 equity. This willreduce the current liabilities in the future. In the wake of rising interest rates in the economy, this strategy will prove to be beneficial for Pioneer in the future. The average price/share fell during 2014 to Rs 31.78 and in 2015, it remained around Rs 31.84. The share prices declined due to the losses incurred during both the fiscal years. 4.5.4. ASSETS: The asset management of the company seems to be quite effective during 2015 as the operating cycle of Pioneer decreased to 9 days from 23 days in 2014. The operating cycle, however, has reduced due to faster sales turnover while days to collect trade debt remained the same in 2015. The days to sell the average inventory were 19 days in 2014 whereas in 2015 it took the company only 6 days to sell its inventory.
  • 115.
    115 5 SWOT ANALYSISOF CEMENT INDUSTRY 5.1 STRENGTHS ORGANIZED SECTOR: Cement industry is a highly organized sector. The total number of cement plants in Pakistan is 25. The industry is highly capital intensive. The capital cost of 2000tons/day plant ranges between Rs.3 billion to Rs.4 Billion. Thus only experienced and big players enter this industry. HIGH QUALITY: Cement produced in main companies is of good quality. It is of attraction for export, and for high-importance projects.
  • 116.
    116 EXPANSION: Currently almost allof the cement plants are undergoing conversion and expansion plans. Capacity expansion of 13million tons will go online between FY05-FY09. Most of the companies are going to benefit from economies of scale after expansion. CAPACITY UTILIZATION: The capacity utilization for the sector also improved to 91.32 per cent from 89 per cent last year. Cement exports during the said period have increased by 40 per cent while the local cement dispatches have grown by 18 per cent. GOVERNMENT POLICIES: Financial sector reform, increase in worker remittance, higher government infrastructure spending and fiscal incentive for the housing sector will serve as catalyst for higher growth. During the last two years, the Public Sector Development Programme has been considerably enhanced and this has coincided with greater demand for cement from the private sector largely for construction activities in the housing sector. PUBLIC SECTOR DEVELOPMENT PROGRAM: During the last two years, the Public Sector Development Program has been considerably enhanced and this has coincided with greater demand for cement from the private sector largely for construction activities in the Housing sector. LOW TRANSPORTATION COSTS AND ENERGY EFFICIENCY: Pakistan is having competitive edge of low transportation costs and energy efficient plants.
  • 117.
    117 ECONOMIC GROWTH: Cement industryhas a direct link to the economic growth of the industry. Better roads, airports, proper canal lining and sea ports form major infrastructure for every industry. 5.2 WEAKNESSES ECONOMIES OF SCALE: In the Gulf countries, the average plant size is 1.6m mtpa while in Egypt, it is over 3m mtpa. The relatively small size of individual cement factories in Pakistan suggests that a significant capacity is currently unable to benefit from the economy of scales. HIGHER MAINTAINANCE COST: Majority of the companies have plants of Chinese origin. They have a higher long-term maintenance costs, as compared to western plants. FULL-CAPACITY UTILIZATION: Almost all the companies are already running at full capacity. Therefore, any hike in demand in form of construction of dams or infrastructure will not be met. Thus resulting in major shortfall. CONCENTRATION OF PLANTS IN NORTH: Majority of the plants are located in the northern region, mainly in NWFP. Thus any development in the southern region is mainly augmented by northern region plants. This results in higher transportation costs.
  • 118.
    118 NON-COOPERATION OF GOVERNMENT: Thereis non-cooperative gesture of the government. CEMENT PRICES: Cement prices in the international market are very tight, looking at the prevailing demand. EXCISE DUTY: The government has not taken any step for abolishing excise duty on cement items, which is clearly negating of the achievement of lowering prices for the public and for development activities. UNLIMITED IMPORTS: It is quite contrary to APCMA‟s recommendations of allowing import of cement up to 500,000 metric tons on confessional basis as a buffer stock. The government has permitted unlimited imports, which can provide roots for damaging the domestic industry if neighboring countries start dumping the commodity into our markets 5.3 OPPORTUNITIES INFRASTRUCTURE DEVELOPMENT IN PAKISTAN: According to the “Medium Term Development Framework”, the government will gradually increase its allocation for the Public Sector Development Program from Rs272b to Rs597b in FY'10, which is likely to generate further demand in coming years.
  • 119.
    119 Construction of largedams, mainly KALABAGH, BASHA-DIAMER, MUNDA, AKHORI, KURRAM TANGI, NAI GAJ, and SKARDU, is going to require huge amounts of cement. It is estimated that these dams will require around 15 to 20 mn MT of cement. PER CAPITA CONSUMPTION: Pakistan‟s per capita cement consumption is amongst the lowest in the region. The government has started massive spending on infrastructure development- road construction and water management measures etc., which was the neglected area in late 1990s due to deteriorated balance of payment conditions of the country. The country used to spend a major part of the budget on debt servicing that left no room for development expenditures. The situation has almost reversed now. The per capita consumption is expected to increase phenomenally in coming years, as a result. POTENTIAL IN SOUTHERN REGION: At present, 80% of the consumption is at the Northern Region. There lies a huge potential for the cement companies in the Southern region, specially in Karachi and Gawadar. EXPORTS; PRESENT AND POTENTIAL: There is lies a huge potential for export of cement. Can export to Middle-East on large scale through Karachi sea port, after construction of cement export terminal, expected to be offered on BOT by GOP.
  • 120.
    120 India is alsoa huge market for Pakistani cement. A lot of expansion is going on in India. With relationships getting better, it is anticipated that Pakistani Cement companies will be able to gain a huge market in the shape of India. Presently some of the cement companies from Pakistan are exporting cement to Afghanistan, Iraq and UAE only to maintain their presence in these markers. After completion of major expansion plans in Pakistan in 2014, there would be surplus to export in these markets. 5.4 THREATS CLYNICAL NATURE OF BUSINESS: Cement being a pure commodity business, the industry is prone to cyclical nature of demand of cement. DELAY IN CONSTRUCTION OF DAMS: Dams are a major source for the cement industry. Due to political instability and inconsistency of policies, the construction of dams is being delayed. This will dent demand of cement in short run. POLITICAL INSTABILITY: This threat is true for all the industries. Political instability has harmed industry for over two decades, and it seems as if this will continue for some time.
  • 121.
    121 MONOPOLY CONTROL AUTHORITY: Abig threat to cement industry is the onging tussle between the cement manufacturers and the Monopoly Control Authority. The Authority is being given increased regulatory powers, and it is exercising more aggressive price controls. IRANIAN CEMENT INDUSTRY: Currently Pakistan is a major exporter to Afghanistan, and it is also aiming at exporting to Middle-Eastern countries. However, it should be noted that Iran is going to enter these markets soon. Its cement industries, which are currently focusing on internal development, will soon compete in international market. 6 CONCLUSION The company underwent many expansion plans due to which its capacity was increased to 2350 tons per day in 2012 and in 2013 a new production line of 4300 tons per day clinker capacity started production. Its shares are quoted on all the three stock exchanges of the country. It is a part of the Noon group, which holds the majority stake of 60% in the company, followed by a leading brokerage house, First National Equity Limited (FNE) 9% shareholding. Financial institutions, insurance companies and the general public, hold the rest of the shareholding. Pioneer is involved in the manufacturing and marketing of cement. Its products include ordinary Portland cement, suitable for concrete construction and sulphate resistant cement, ideal for construction in or near sea. Thus, the company's sulphate resistant cement is highly preferred in important projects such as the Thai Greater Canal project. PIOC's products are sold under the brand name of 'Pioneer Cement' and it was the winner of "Brand of the Year Awards 2013" in cement sector in the national category.
  • 122.
    122 Pioneer Cement isISO 9001:2000 QMS and ISO: 14001:2011 certified. It meets local as well as international quality standards. Pioneer Cement produces and sells used coal and cement domestically and internationally. The cement sector had shown an impressive growth of 24.3% in the cement dispatches during 2015, owing to a strong demand in the local market and supply deficits in the regional markets. The major boost had come from the export sales (a growth of 142%) while local cement dispatches grew nominally by 6.5%.exports showed a growth of 59.5% and export market share rose from 21.5% in 2015 to 34.1% . However, there is no reflective true performance of Cherat against its competitors; EPS remained above the industry average. Lower value of outstanding number of shares rather than a high net income is mainly responsible for the mentioned trend. The same argument holds true for the higher than average book value per share as well. It has a declining trend. This again can be attributed to shareholder pattern of the company. The outlook for local demand growth for Cherat remains positive as a number of mega housing projects are in their initial stages whereas the government has also started a lot of infrastructure developments projects and might even go for mega water reservoir projects in the future. This would keep the demand upbeat. Earthquake reconstruction in the Northern Areas further strengthens the demand growth. Whereas for the Kohat Cement Company, by going forward, with additional capacities coming on line, the gross margins are likely to decline. However, they are expected to sustain at a reasonable level, allowing a comfortable profitability and cash flow levels for the industry, even at low capacity utilization levels. As Kohat Cement Company is going under sustainable capacity expansion, relative to its existing size, its market share in the production sharing arrangement is expected to increase, signifying ability to achieve higher sales volumes even at low capacity utilization. They should increase the overall profitability of the company as compare to its competitors.
  • 123.
    123 7 RECOMMENDATIONS These arethe recommendations that can be implemented in the cement industry to reinforce its success: GOVERNMENT’S ROLE: There are many players in the industry that are not functioning efficiently. There needs to be certain minimum requirements that should be fulfilled by the manufacturers. The government can give deadlines to the manufacturers for implementing those measures, which if not implemented, will lead to the closure of the companies. These minimum requirements can be conversion to low-cost coal powered plants. The government can initiate more infrastructure projects to develop the country and, in turn, developing the industry. The government should strengthen its regulatory framework and regulatory body Monopoly Control Authority (MCA) to look into malpractices of cartel-forming as is the case with the All Pakistan Cement Manufacturers Association (APCMA). The government has to get costing data on cement industry from independent sources and strictly implement its anti-trust law. There should be more reductions in the government levies to make the industry more competitive in the export market. Government should take any step for abolishing excise duty on cement items, which is clearly negating of the achievement of lowering prices for the public and for development activities. It is
  • 124.
    124 incomprehensible that exciseduty has been imposed on cement, which is being produced in the country in abundance. TECHNOLOGY: The industry is dominated by a few giants along with relatively smaller players. Thus, these giants need to get involved into more research and development to come up with new varieties of cements, different production methods and other such innovations. Material sciences are developing rapidly the world over, and advanced construction materials are being produced, in particular, for enhancing quality, strength and efficiency in the concrete construction. The industry should, therefore, make investment in advanced cement technologies, over short and long term horizons, in the wake of recent destruction due to earthquake TRANSPORT SECTOR Just as the transport sector of China uses cement in road construction rather than asphalt, Pakistan can also implement the same. With more and more road development, the industry would also benefit. FUEL COST Cement industry is highly energy intensive and fuel cost constitutes about 30 per cent of the total cost of cement manufacturing. If all the cement plants switchover to coal and capacity utilization remains the same, the industry will be able to save over Rs 5 billion annually.
  • 125.
    125 EXPORTS It takes aroundthree days for a single ship to be loaded with cement for export. If this ship loading/unloading time could be reduced, we would be better able to handle the exports more quickly. There should be easy and quick procedures at the ports to facilitate the cement exporters with the process. VISION The industry needs to have a long-term vision. It is essentially important for it also to adopt measures to reduce its present production cost further by improving production efficiency, conserving energy and employing advanced techniques, such as installation of advanced process controls and developing bulk handling system. PRICING In order to be competitive, the industry is required to arrest the price increase trend, as cement production cost would reduce as a result of economical expansions of various existing units. A schedule for maintenance should be prepared. In house dust emission measurement i.e. intensive monitoring of Bag-House-Filters should be carried out to gain more information about its effectiveness. BAG FILTERS High temperature resistant fabric material like Nomex should be used in filters of Clinker Bucket Conveyor to prevent the burning of bag fabric from hot Clinker particles, which results in small holes in bag fabric. The cost of Nomex fabric is approximately two times higher than polyester needle filter.
  • 126.
    126 WASTE MANAGEMENT Improvement inmaintenance is to prevent spillage and leakage- by making an inventory for the leakage/spillage, and investigating the cause of leakage and accordingly planning the maintenance. Improved recycling of the collected spillage – e.g. through implementing a chute system, collecting dust at a special recycling point, removing metal scrap with a magnetic separator. Re-cycling of Cr-containing refractory bricks in cement production instead of selling them to the downstream use – after crushing the Chromium-bricks in the Crusher it should be used as raw material, this will prevent the dispersion of toxic waste. PERSONAL PROTECTION EQUIPMENT To control and minimize the risks at the workplace, it‟s necessary that structural attention be paid to safety. Although some system exists with regard to Occupational Health & Safety (OHS) in most of the cement plants, it requires refinement with identification of reasons of the accident and suggesting measures to avoid such happenings in future. Following steps should be specially looked into. Exposure to Health Risks: The health risks of working in a cement plant are associated with working with rotary equipment, the inhalation of dust, exposure to noise and vibration. Besides these risks, the people working in the quarry are exposed to the risks of working with explosives. The management should define procedures on explosive handling and other precautions during blasting. Following measures are recommended to the Management of cement plants for prevention of production area accidents in the factory.
  • 127.
    127 REGULATORY FRAMEWORK Sector isnot regulated properly and environmentally harmful practices such as using cheap coal as fuel go unchecked. Vested interests are the reason for inconsistent policies; government tends to ignore any social agitation. For the cement sector, a proper regulatory framework for pricing as well as keeping a check on environmentally harmful practices should be adopted .Government should take care of not allowing low grade cement to be imported, which if used could endanger the stability of load bearing structures in view of its lower strength. EXPLORING NEW MARKETS Major buyers of cement had been Afghanistan and Middle Eastern countries. If government takes pro-industry steps, the volume of cement exports can increase substantially besides capturing various new markets TRANSPORTATION COSTS There is an increase in transportation and energy costs which has impact on the cost of production of cement. And the hike in truck rates for carriage of coal from Karachi to the upcountry and for general distribution of cement to the various urban markets from the plants mostly located in the rural areas. So it is recommended that the ministry of railways to provide wagons on priority to cement units so that pressure on the truck and road network may be reduced.
  • 128.
    128 8 BIBLIOGRAPHY REFERENCE &SOURCES USED  Pioneer Cement Company limited (PCCL) website (www.pioneercement.com). Retrieved: June, 03, 2010: 08:52 PM   Kohat Cement Company (KCC) website (www.kohatcement.com): Retrieved: June, 04, 2010: 09:36 PM   All Pakistan Cement Manufacturing Association (APCMA). www.apcma.com: Retrieved: June, 04, 2010: 10:22 PM  Earthtrends (2003), „„Climate and atmosphere – Nigeria‟‟, available at: http://earthtrends.wri.org (accessed 13 June 2011).  Fleishman-Hillard (2013), Rethinking CSR: A Fleishman-Hillard/National Consumers League Study, Fleishman-Hillard, St Louis, MO.  Frederick, W. (1994), „„From CSR1 to CSR2‟‟, Business and Society, Vol. 32 No. 2, pp. 150-64.  Frooman, J. (1999), „„Stakeholder influence strategies‟‟, Academy of Management Review, Vol. 24 No. 2, pp. 191-245.  Hassanein, A., Lundholm, G., Willis, G. and Young, C. (2014), CSR and the Canadian International Extractive Sector: A Survey, The Canadian Centre for the Study of Resource Conflict, Revelstoke.  Hess, D., Rogovsky, N. and Dunfee, T.W. (2002), „„The next wave of corporate community involvement‟‟, California Management Review, Vol. 44 No. 2, pp. 110-25.
  • 129.
    129  Ite, U.E.(2011), „„Multinationals and corporate social responsibility in developing countries; a case study of Shell in Nigeria‟‟, Corporate Social Responsibility and Environmental Management, Vol. 11 No. 1, pp. 1-11.  Ite, U.E. (2014), „„Changing times and strategies: shell contribution to sustainable development in the Niger Delta, Nigeria‟‟, Sustainable Development, Vol. 15, pp. 1-14.  Iyawe, V.I., Ebomoyi, M.I.E., Chiwuzie, J.C. and Alakija,W. (2000), „„Some factors which may affect blood pressure in Nigerian cement factory workers‟‟, African Journal of Biomedical Research, Vol. 3 No. 2, pp. 117-21.  Ahuja, I.P.S. and Khamba, J.S. (2015), “An evaluation of TPM initiatives in Indian industry for enhanced manufacturing performance”, International Journal of Quality & Reliability  Management, Vol. 25 No. 2, pp. 147-72.  Ahuja, I.P.S. and Kumar, P. (2009), “Reviews and case studies a case study of total productive  maintenance implementation at precision tube mills”, Internal of Quality in Maintenance  Engineeing, Vol. 15 No. 3, pp. 241-58.  Al-Habaibeh, A. and Parkin, R.M. (2012), “An evaluation of a heat transfer process using sensor fusion of thermocouples and infrared thermography”, Proceedings of the International  Conference on ConditionMonitoring 2012, KingsCollege,Cambridge,UK, pp. 229-33.  Al-Habaibeh, A., Cai, R., Jackson, M.R. and Parkin, R.M. (2011), “Modern development in sensor technology and its applications in condition monitoring”, Invited Keynote Paper, abstract accepted for the 7th International Conference on Monitoring and Automatic Supervision in Manufacturing, Zakopane, 19-21 August.  Al-Habaibeh, A., Parkin, R.M., Jackson, M.R., Whitby, D.R., Mansi, M. and Coy, J. (2002), “The application of an autonomous low cost infra-red thermal imager for condition based  maintenance of machinery”, Proceedings of the Mechatronics 2002 Conference, Enschede,  The Netherlands, June.
  • 130.
    130  Al-Muhaisen, M.and Santarisi, N. (2002), “Auditing of the maintenance system of Fuhais  plant/Jordan Cement Factories Co”, Journal of Quality in Maintenance Engineering, Vol. 8  No. 1, pp. 62-76.  Alsyouf, I. (2009), “Maintenance practices in Swedish industries: survey results”, International  Journal of Production Economics, Vol. 121, pp. 212-23.  Bamber, C.J., Sharp, J.M. and Hides, M.T. (1999), “Factors affecting successful implementation of total productive maintenance – a UK manufacturing case study perspective”, Journal of Quality in Maintenance Engineering, Vol. 5 No. 3, pp. 162-81  www.dailytimes.com.pk  http://www.cpp.org.pk/etpibrchr/cement-brochure.pdf.  www.nation.com.pk  www.businessplus.tv/Programme/pdf/Pioneer%20Cement%20Report.pdf.  AKD Research report on Cement sector (February 2014)  Ismail Iqbal securities (Pvt) Ltd report on Cement sector  www.pakistan.gov.pk/ministries/yearbook0506.pdf  www.wikipedia.com  www.dawn.com  http://www.jang.com.pk/thenews/investors/aug2011/if.htm  http://www.researchandmarkets.com/reportinfo.asp?report_id=300358  http://www.dawn.com/2012/10/24/ebr8.htm