Downloaded 15 times

![3
| 10/5/2014 | © eHealth Data Solutions
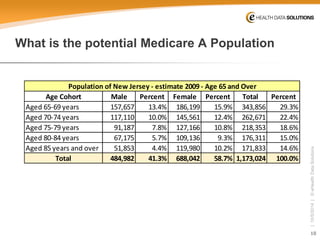
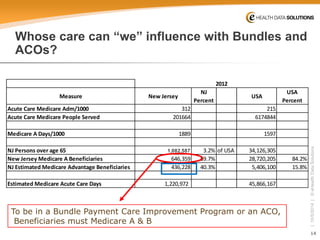
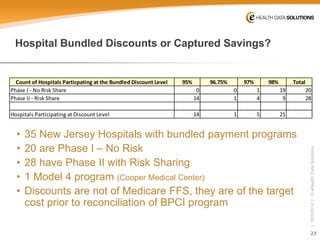
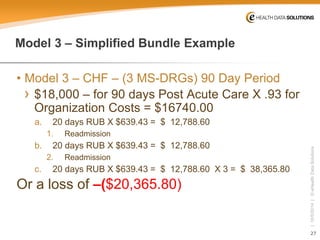
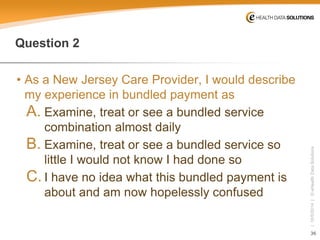
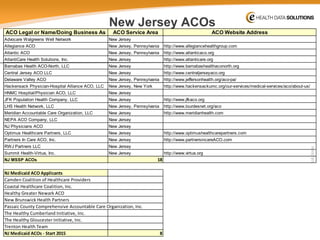
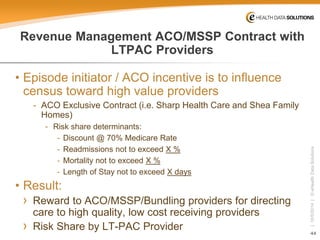
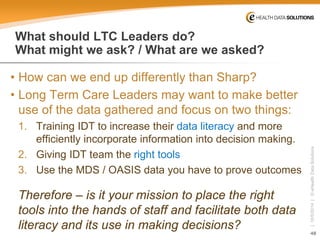
Why must we face and know Data? Or The Question that is the “Elephant in the room.” “Are we appropriately Doctored”? / Are we well served?
•
"the great American medical guilt trip“
›
We spend far more on health care for allegedly worse health outcomes, including higher mortality, compared to other countries.
›
This is an apples-to-oranges comparison of vastly different geographies, social structures and cultures. After subtracting homicides and automobile fatalities, the mortality discrepancies largely disappear.
We cannot cure homicide and automobile fatalities once they have happened
•
Medicine, like life [or “Big Data”], inevitably consists of messiness, error, tedium, unresolvable dilemmas and contradictory trade-offs.
›
Book Review: 'Doctored' by Sandeep Jauhar
ByTHOMAS P. STOSSEL, MD –Wall Street Journal Aug. 25, 2014](https://image.slidesharecdn.com/finaljohnsheridanpresentationfornjltclcoctober-22014-141005204145-conversion-gate02/85/Navigating-Oceans-of-Data-Being-Part-of-and-Competing-in-the-ACO-Bundled-Payment-Reforms-3-320.jpg)

![38
| 10/5/2014 | © eHealth Data Solutions
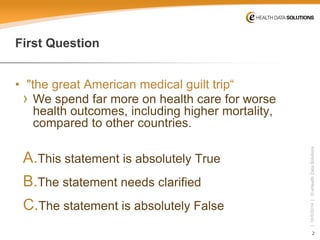
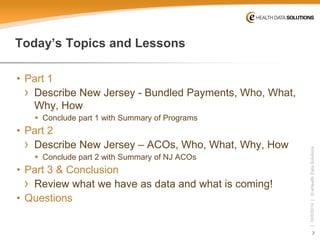
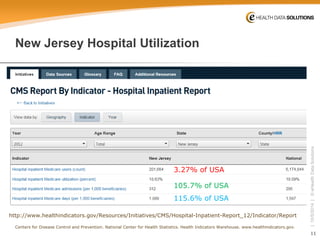
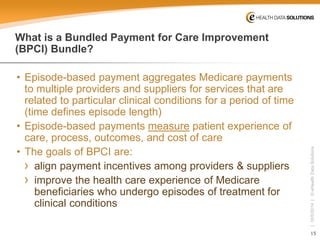
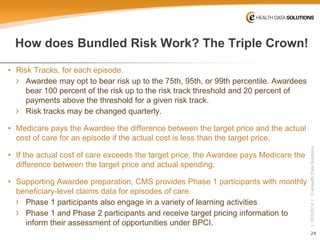
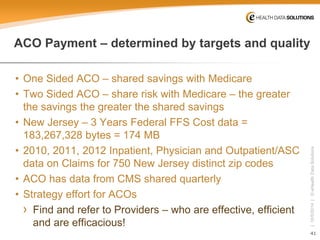
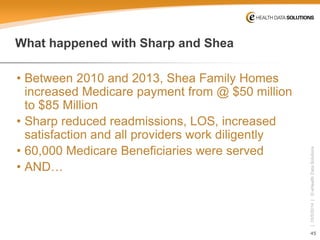
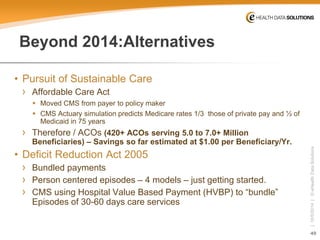
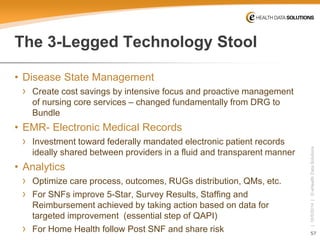
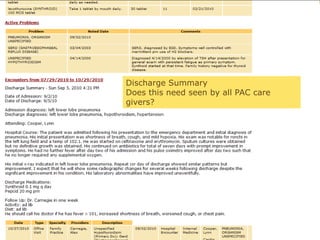
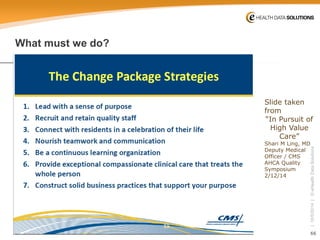
New Jersey Acute and Post Acute Expenditures (2012) [3 days prior to index Admission + 30 days PAC]
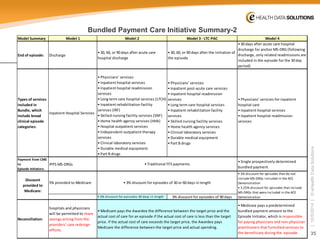
Total Costs per PeriodReported%Calculated* Day 1-3 Prior to Adm$66,205,5221.3%$66,205,522Index Admission$2,563,702,94651.2%$2,563,702,946Days 1-30 post Index AdmissionLong Term Care$2,379,987,73047.5%$2,379,987,730Complete Episode Costs$5,009,841,634100.0%$5,009,896,198 Medicare A Episodes of Care249919Medicare Beneficiaries Served201664 Estimated Medicare A Episodes per Person Served1.24New Jersey Medicare Part A Expenditures for 2012Transitions per person per year*Note Addition differences reported by CMS as rounding errors
If all Medicare A Episodes were set for 2012, targeted cost would be
$4,859,546,385 –or $150,295,249 less than spent
Ideally savings will be greater than 3%](https://image.slidesharecdn.com/finaljohnsheridanpresentationfornjltclcoctober-22014-141005204145-conversion-gate02/85/Navigating-Oceans-of-Data-Being-Part-of-and-Competing-in-the-ACO-Bundled-Payment-Reforms-38-320.jpg)
![59
| 10/5/2014 | © eHealth Data Solutions
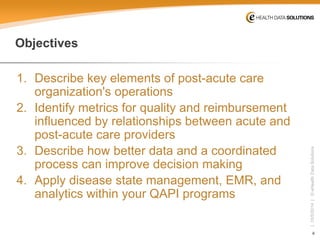
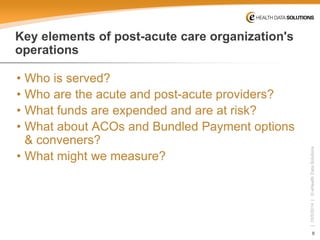
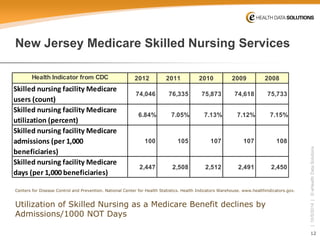
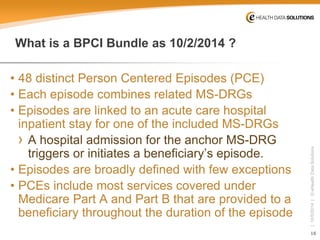
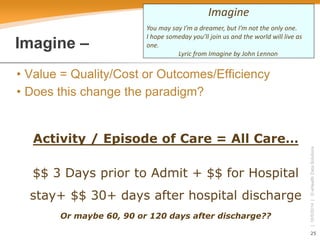
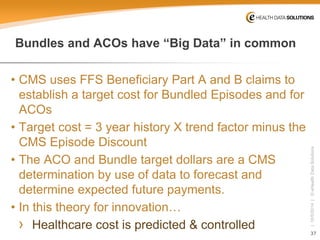
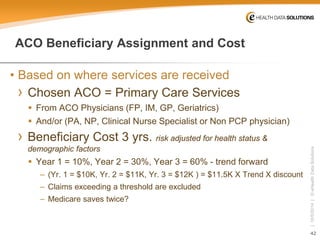
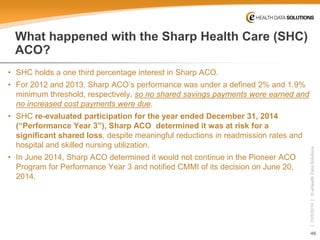
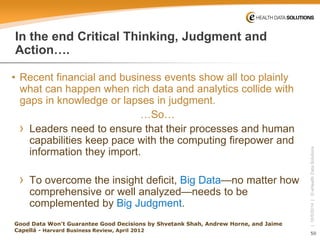
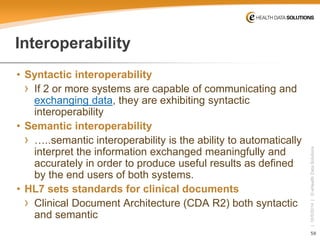
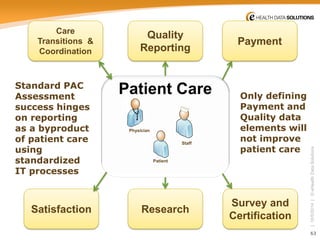
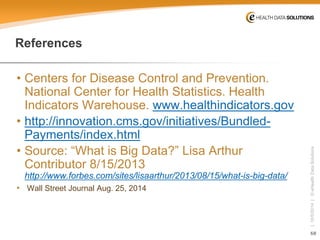
S&I [Standards & Interoperability]
CDA Templates
S&I Framework CEDD
Care Transition Datasets
Patient Assessments
Encounter Summaries
Longitudinal Plan of Care
CEDD
[Common Element Data Dictionary]
CDA
[Clinical Document Architecture]
What is “the” EHR?
Congress made the laws for MU2
CMS will act
Providers
comply](https://image.slidesharecdn.com/finaljohnsheridanpresentationfornjltclcoctober-22014-141005204145-conversion-gate02/85/Navigating-Oceans-of-Data-Being-Part-of-and-Competing-in-the-ACO-Bundled-Payment-Reforms-59-320.jpg)


The document discusses the complexities of the U.S. healthcare system, emphasizing the disparities in healthcare spending and outcomes compared to other countries, while highlighting the importance of data in improving care transitions and post-acute care operations. It details the objectives of understanding bundled payments and Accountable Care Organizations (ACOs) in New Jersey, including the metrics for quality, reimbursement, and the changing healthcare landscape. The presentation outlines the population served, Medicare utilization trends, and how bundled payment models aim to align incentives among healthcare providers to enhance patient care.


