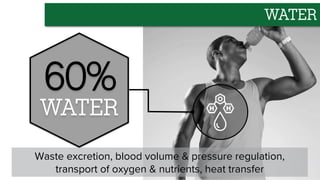
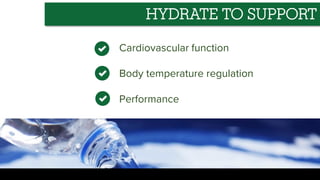
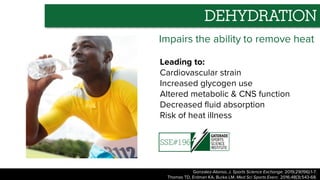
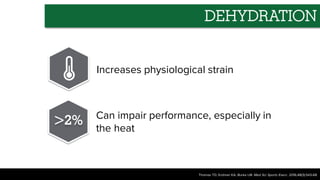
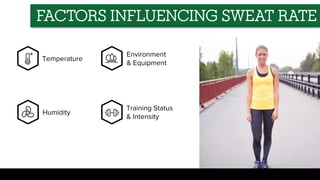
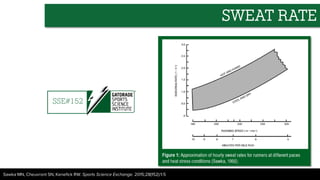
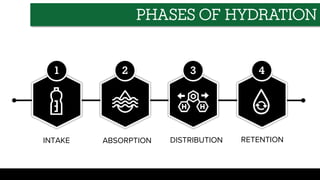
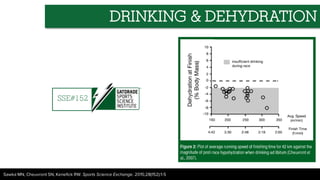
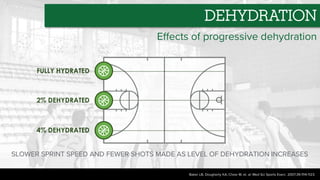
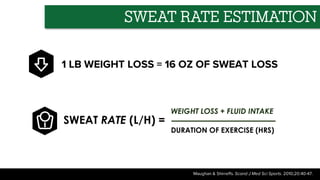
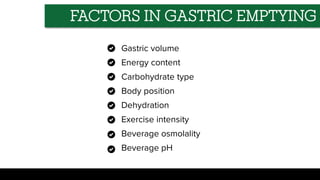
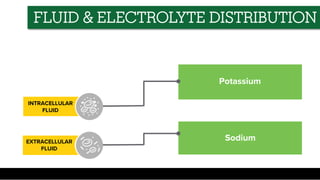
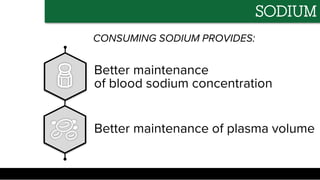
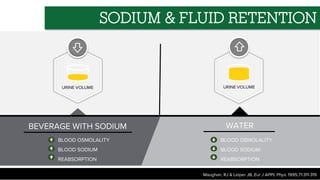
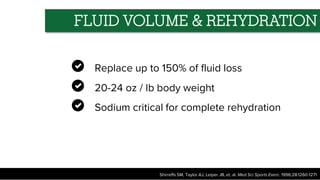
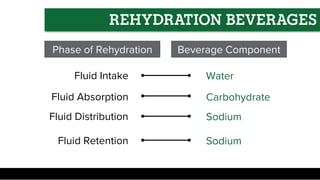
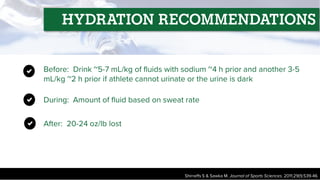
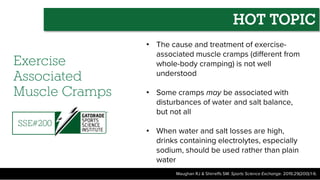
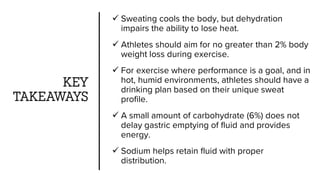
HYDRATION PRINCIPLES:
INTAKE, ABSORPTION, DISTRIBUTION &
RETENTION
Lecture content provided by GSSI, a division of PepsiCo, Inc. Any
opinions or scientific interpretations expressed in this
presentation are those of the author and do not necessarily
reflect the position or policy of PepsiCo, Inc.
OVERVIEW
• Physiological importance of hydration
• Effects of dehydration on performance
• Sweat rate estimation
• Fluid absorption and gastric emptying
• Hydration and rehydration recommendations
60%
WATER
Waste excretion, blood volume & pressure regulation,
transport of oxygen & nutrients, heat transfer
WATER
Cardiovascular function
Body temperature regulation
Performance
HYDRATE TO SUPPORT
Impairs the ability to remove heat
Leading to:
Cardiovascular strain
Increased glycogen use
Altered metabolic & CNS function
Decreased fluid absorption
Risk of heat illness
DEHYDRATION
SSE#196
Gonzalez-Alonso, J. Sports Science Exchange. 2019;29(196):1-7.
Thomas TD, Erdman KA, Burke LM. Med Sci Sports Exerc. 2016;48(3):543-68.
>2% Can impair performance, especially in
the heat
Thomas TD, Erdman KA, Burke LM. Med Sci Sports Exerc. 2016;48(3):543-68
DEHYDRATION
Increases physiological strain
SWEAT RATE
~1-2 L/h
SWEATING
Cools the Body
Humidity
Temperature
Environment
& Equipment
Training Status
& Intensity
FACTORS INFLUENCING SWEAT RATE
Sawka MN, Cheuvront SN, Kenefick RW. Sports Science Exchange. 2015;28(152):1-5
SWEAT RATE
SSE#152
INTAKE ABSORPTION DISTRIBUTION RETENTION
2 3 4
1
PHASES OF HYDRATION
FLUID
INTAKE
(Modified from) Baker LB & Jeukendrup AE. Compr Physiol. 2014;4(2):575-620
CENTRAL NERVOUS
SYSTEM
INCREASED
PLASMA
OSMOLALITY
HYPOVOLEMIA
OROPHARYNGEAL
FACTORS
DRY MOUTH
ORAL METERING
(swallowing)
BEVERAGE
AVAILABILITY
Temperature
Flavor
Texture
Composition
PERCEIVED
THIRST
PHYSIOLOGICAL
THIRST
THIRST & FLUID FACTORS
PLASMA
ADH
(pg/ml)
20
25
15
20
5
0
PLASMA OSMOLALITY (mOsm/kg)
12
10
8
6
4
2
0
THIRST
(cm)
285 290 295 300 305
←OFF/ON→
THIRST
THRESHOLD
THIRST, HYDRATION & ADH
(Modified from) Robertson GL. Kidney Int. 1984 Feb;25(2):460-9
Planned Drinking Drink to Thirst
Longer duration activities > 90 min
Particularly in the heat
High intensity
High sweat rates
When performance is a concern
When carbohydrate intake of 1 g/min
Short duration activities < 60 to 90 min
Cooler conditions
Lower intensity
Kenefick RW. Sports Science Exchange. 2018;29(182)
PLANNED VS DRINKING TO THIRST
SSE #182
Despite having access to cool palatable fluid,
athletes typically dehydrate during exercise.
VOLUNTARY DEHYDRATION
Osterberg KL, Horswill CA, Baker LB. J Athl Train. 2009;44:53-57.
Passe D, Horn M, Stofan J, et. al. IJSNEM. 2007;17:284-295.
Greenleaf & Sargent. J Appl Physiol. 1965;20:719-724.
DRINKING & DEHYDRATION
SSE#152
Sawka MN, Cheuvront SN, Kenefick RW. Sports Science Exchange. 2015;28(152):1-5
Effects of progressive dehydration
SLOWER SPRINT SPEED AND FEWER SHOTS MADE AS LEVEL OF DEHYDRATION INCREASES
Baker LB, Dougherty KA, Chow M, et. al. Med Sci Sports Exerc. 2007;39:1114-1123.
DEHYDRATION
FULLY HYDRATED
2% DEHYDRATED
4% DEHYDRATED
SWEAT RATE ESTIMATION
WEIGHT LOSS + FLUID INTAKE
SWEAT RATE (L/H) =
DURATION OF EXERCISE (HRS)
1 LB WEIGHT LOSS = 16 OZ OF SWEAT LOSS
Maughan & Shirreffs. Scand J Med Sci Sports. 2010;20:40-47.
FLUID
ABSORPTION
Gastric volume
Energy content
Carbohydrate type
Body position
Dehydration
Exercise intensity
Beverage osmolality
Beverage pH
FACTORS IN GASTRIC EMPTYING
IMPORTANCE OF ENERGY DENSITY
Murray R, Bartoli W, Stofan J, et. al. Int J Sports Nutr. 1999;9:263-274
6% CARBS WATER 8% CARBS
When to Add Carbohydrate
If an athlete is training or competing for 60 minutes or longer
with a performance goal.
Add 30-60 g/h carbohydrate, resulting in no more than a 6%
solution (6% = 14 g/8 oz).
Choose quickly oxidized carbohydrates to provide energy
and minimize GI upset.
Thomas TD, Erdman KA, Burke LM. Med Sci Sports Exerc. 2016;48(3):543-68
CARBOHYDRATE
BLOODSTREAM
GLUCOSE
FRUCTOSE
INTESTINAL
LUMEN
GLUCOSE
FRUCTOSE
SGLT1
GLUT5
INTESTINAL WATER ABSORPTION
Shi X, Summers RW, Schedl HP, et. al. Med Sci Sports Exerc. 1995;27:1607-1615
PLASMA
SGLT1
2 NA+
2 NA+
GLUCOSE
GLUCOSE
H2O
GLUT 5
FRUCTOSE
FRUCTOSE
DRTS
SUCROSE
FRUCTOSE
GLUCOSE
Shi X, Summers RW, Schedl HP, et. al. Med Sci Sports Exerc. 1995;27:1607-1615
INTESTINAL WATER ABSORPTION
Importance of drinking pattern
FLUID
DISTRUBUTION
& RETENTION
INTRACELLULAR
FLUID
EXTRACELLULAR
FLUID
Potassium
Sodium
FLUID & ELECTROLYTE DISTRIBUTION
Better maintenance
of blood sodium concentration
CONSUMING SODIUM PROVIDES:
Better maintenance of plasma volume
SODIUM
URINE VOLUME URINE VOLUME
BEVERAGE WITH SODIUM WATER
BLOOD OSMOLALITY
BLOOD SODIUM
REABSORPTION
BLOOD OSMOLALITY
BLOOD SODIUM
REABSORPTION
SODIUM & FLUID RETENTION
Maughan, RJ & Leiper JB, Eur J APPL Phys. 1995;71:311-319
Shirreffs SM, Taylor AJ, Leiper JB, et. al. Med Sci Sports Exerc. 1996;28:1260-1271
Replace up to 150% of fluid loss
20-24 oz / lb body weight
Sodium critical for complete rehydration
FLUID VOLUME & REHYDRATION
DURING
~16 oz/lb lost
AFTER
~20-24 oz/lb lost
Thomas TD, Erdman KA, Burke LM. Med Sci Sports Exerc. 2016;48(3):543-68
REHYDRATION RECOMENDATIONS
Tournament
play
Throughout
day-long
competitions
During
two-a-day
practices
After weigh-ins
REHYDRATION IS IMPORTANT…
X2
Shirreffs S & Sawka M. Journal of Sports Sciences. 2011;29(1):S39-46
Fluid Intake Water
Fluid Absorption Carbohydrate
Fluid Distribution Sodium
Fluid Retention Sodium
REHYDRATION BEVERAGES
Phase of Rehydration Beverage Component
Before: Drink ~5-7 mL/kg of fluids with sodium ~4 h prior and another 3-5
mL/kg ~2 h prior if athlete cannot urinate or the urine is dark
During: Amount of fluid based on sweat rate
After: 20-24 oz/lb lost
Shirreffs S & Sawka M. Journal of Sports Sciences. 2011;29(1):S39-46
HYDRATION RECOMMENDATIONS
Exercise
Associated
Muscle Cramps
• The cause and treatment of exercise-
associated muscle cramps (different from
whole-body cramping) is not well
understood
• Some cramps may be associated with
disturbances of water and salt balance,
but not all
• When water and salt losses are high,
drinks containing electrolytes, especially
sodium, should be used rather than plain
water
Maughan RJ & Shirreffs SM. Sports Science Exchange. 2019;29(200):1-6.
SSE#200
HOT TOPIC
PUTTING IT TOGETHER
SSE#141
American
Football
Example
Adams WM & Casa DJ. Sports Science Exchange. 2015;28(141):1-5
KEY
TAKEAWAYS
 Sweating cools the body, but dehydration
impairs the ability to lose heat.
 Athletes should aim for no greater than 2% body
weight loss during exercise.
 For exercise where performance is a goal, and in
hot, humid environments, athletes should have a
drinking plan based on their unique sweat
profile.
 A small amount of carbohydrate (6%) does not
delay gastric emptying of fluid and provides
energy.
 Sodium helps retain fluid with proper
distribution.
www.GSSIweb.org

FINAL Hydration Principles_ Intake, Absorption, Distribution _ Retention_6.4.21.pdf

  • 1.
    HYDRATION PRINCIPLES: INTAKE, ABSORPTION,DISTRIBUTION & RETENTION Lecture content provided by GSSI, a division of PepsiCo, Inc. Any opinions or scientific interpretations expressed in this presentation are those of the author and do not necessarily reflect the position or policy of PepsiCo, Inc.
  • 2.
    OVERVIEW • Physiological importanceof hydration • Effects of dehydration on performance • Sweat rate estimation • Fluid absorption and gastric emptying • Hydration and rehydration recommendations
  • 3.
    60% WATER Waste excretion, bloodvolume & pressure regulation, transport of oxygen & nutrients, heat transfer WATER
  • 4.
    Cardiovascular function Body temperatureregulation Performance HYDRATE TO SUPPORT
  • 5.
    Impairs the abilityto remove heat Leading to: Cardiovascular strain Increased glycogen use Altered metabolic & CNS function Decreased fluid absorption Risk of heat illness DEHYDRATION SSE#196 Gonzalez-Alonso, J. Sports Science Exchange. 2019;29(196):1-7. Thomas TD, Erdman KA, Burke LM. Med Sci Sports Exerc. 2016;48(3):543-68.
  • 6.
    >2% Can impairperformance, especially in the heat Thomas TD, Erdman KA, Burke LM. Med Sci Sports Exerc. 2016;48(3):543-68 DEHYDRATION Increases physiological strain
  • 7.
  • 8.
  • 9.
    Sawka MN, CheuvrontSN, Kenefick RW. Sports Science Exchange. 2015;28(152):1-5 SWEAT RATE SSE#152
  • 10.
    INTAKE ABSORPTION DISTRIBUTIONRETENTION 2 3 4 1 PHASES OF HYDRATION
  • 11.
  • 12.
    (Modified from) BakerLB & Jeukendrup AE. Compr Physiol. 2014;4(2):575-620 CENTRAL NERVOUS SYSTEM INCREASED PLASMA OSMOLALITY HYPOVOLEMIA OROPHARYNGEAL FACTORS DRY MOUTH ORAL METERING (swallowing) BEVERAGE AVAILABILITY Temperature Flavor Texture Composition PERCEIVED THIRST PHYSIOLOGICAL THIRST THIRST & FLUID FACTORS
  • 13.
    PLASMA ADH (pg/ml) 20 25 15 20 5 0 PLASMA OSMOLALITY (mOsm/kg) 12 10 8 6 4 2 0 THIRST (cm) 285290 295 300 305 ←OFF/ON→ THIRST THRESHOLD THIRST, HYDRATION & ADH (Modified from) Robertson GL. Kidney Int. 1984 Feb;25(2):460-9
  • 14.
    Planned Drinking Drinkto Thirst Longer duration activities > 90 min Particularly in the heat High intensity High sweat rates When performance is a concern When carbohydrate intake of 1 g/min Short duration activities < 60 to 90 min Cooler conditions Lower intensity Kenefick RW. Sports Science Exchange. 2018;29(182) PLANNED VS DRINKING TO THIRST SSE #182
  • 15.
    Despite having accessto cool palatable fluid, athletes typically dehydrate during exercise. VOLUNTARY DEHYDRATION Osterberg KL, Horswill CA, Baker LB. J Athl Train. 2009;44:53-57. Passe D, Horn M, Stofan J, et. al. IJSNEM. 2007;17:284-295. Greenleaf & Sargent. J Appl Physiol. 1965;20:719-724.
  • 16.
    DRINKING & DEHYDRATION SSE#152 SawkaMN, Cheuvront SN, Kenefick RW. Sports Science Exchange. 2015;28(152):1-5
  • 17.
    Effects of progressivedehydration SLOWER SPRINT SPEED AND FEWER SHOTS MADE AS LEVEL OF DEHYDRATION INCREASES Baker LB, Dougherty KA, Chow M, et. al. Med Sci Sports Exerc. 2007;39:1114-1123. DEHYDRATION FULLY HYDRATED 2% DEHYDRATED 4% DEHYDRATED
  • 18.
    SWEAT RATE ESTIMATION WEIGHTLOSS + FLUID INTAKE SWEAT RATE (L/H) = DURATION OF EXERCISE (HRS) 1 LB WEIGHT LOSS = 16 OZ OF SWEAT LOSS Maughan & Shirreffs. Scand J Med Sci Sports. 2010;20:40-47.
  • 19.
  • 20.
    Gastric volume Energy content Carbohydratetype Body position Dehydration Exercise intensity Beverage osmolality Beverage pH FACTORS IN GASTRIC EMPTYING
  • 21.
    IMPORTANCE OF ENERGYDENSITY Murray R, Bartoli W, Stofan J, et. al. Int J Sports Nutr. 1999;9:263-274 6% CARBS WATER 8% CARBS
  • 22.
    When to AddCarbohydrate If an athlete is training or competing for 60 minutes or longer with a performance goal. Add 30-60 g/h carbohydrate, resulting in no more than a 6% solution (6% = 14 g/8 oz). Choose quickly oxidized carbohydrates to provide energy and minimize GI upset. Thomas TD, Erdman KA, Burke LM. Med Sci Sports Exerc. 2016;48(3):543-68 CARBOHYDRATE
  • 23.
    BLOODSTREAM GLUCOSE FRUCTOSE INTESTINAL LUMEN GLUCOSE FRUCTOSE SGLT1 GLUT5 INTESTINAL WATER ABSORPTION ShiX, Summers RW, Schedl HP, et. al. Med Sci Sports Exerc. 1995;27:1607-1615
  • 24.
    PLASMA SGLT1 2 NA+ 2 NA+ GLUCOSE GLUCOSE H2O GLUT5 FRUCTOSE FRUCTOSE DRTS SUCROSE FRUCTOSE GLUCOSE Shi X, Summers RW, Schedl HP, et. al. Med Sci Sports Exerc. 1995;27:1607-1615 INTESTINAL WATER ABSORPTION
  • 25.
  • 26.
  • 27.
  • 28.
    Better maintenance of bloodsodium concentration CONSUMING SODIUM PROVIDES: Better maintenance of plasma volume SODIUM
  • 29.
    URINE VOLUME URINEVOLUME BEVERAGE WITH SODIUM WATER BLOOD OSMOLALITY BLOOD SODIUM REABSORPTION BLOOD OSMOLALITY BLOOD SODIUM REABSORPTION SODIUM & FLUID RETENTION Maughan, RJ & Leiper JB, Eur J APPL Phys. 1995;71:311-319
  • 30.
    Shirreffs SM, TaylorAJ, Leiper JB, et. al. Med Sci Sports Exerc. 1996;28:1260-1271 Replace up to 150% of fluid loss 20-24 oz / lb body weight Sodium critical for complete rehydration FLUID VOLUME & REHYDRATION
  • 31.
    DURING ~16 oz/lb lost AFTER ~20-24oz/lb lost Thomas TD, Erdman KA, Burke LM. Med Sci Sports Exerc. 2016;48(3):543-68 REHYDRATION RECOMENDATIONS
  • 32.
    Tournament play Throughout day-long competitions During two-a-day practices After weigh-ins REHYDRATION ISIMPORTANT… X2 Shirreffs S & Sawka M. Journal of Sports Sciences. 2011;29(1):S39-46
  • 33.
    Fluid Intake Water FluidAbsorption Carbohydrate Fluid Distribution Sodium Fluid Retention Sodium REHYDRATION BEVERAGES Phase of Rehydration Beverage Component
  • 34.
    Before: Drink ~5-7mL/kg of fluids with sodium ~4 h prior and another 3-5 mL/kg ~2 h prior if athlete cannot urinate or the urine is dark During: Amount of fluid based on sweat rate After: 20-24 oz/lb lost Shirreffs S & Sawka M. Journal of Sports Sciences. 2011;29(1):S39-46 HYDRATION RECOMMENDATIONS
  • 35.
    Exercise Associated Muscle Cramps • Thecause and treatment of exercise- associated muscle cramps (different from whole-body cramping) is not well understood • Some cramps may be associated with disturbances of water and salt balance, but not all • When water and salt losses are high, drinks containing electrolytes, especially sodium, should be used rather than plain water Maughan RJ & Shirreffs SM. Sports Science Exchange. 2019;29(200):1-6. SSE#200 HOT TOPIC
  • 36.
    PUTTING IT TOGETHER SSE#141 American Football Example AdamsWM & Casa DJ. Sports Science Exchange. 2015;28(141):1-5
  • 37.
    KEY TAKEAWAYS  Sweating coolsthe body, but dehydration impairs the ability to lose heat.  Athletes should aim for no greater than 2% body weight loss during exercise.  For exercise where performance is a goal, and in hot, humid environments, athletes should have a drinking plan based on their unique sweat profile.  A small amount of carbohydrate (6%) does not delay gastric emptying of fluid and provides energy.  Sodium helps retain fluid with proper distribution.
  • 38.