
More Related Content
Similar to FINAL FALL 2014 OVER VIEW REPORT
Similar to FINAL FALL 2014 OVER VIEW REPORT (20)
FINAL FALL 2014 OVER VIEW REPORT
- 1. 1 | P a g e January 27, 2015 FALL 2014 EMPLOYER INTERNSHIP PLACEMENT REPORT OBJECTIVES__________________________________________________________________________________________ The objective of this report is to provide a summary of the data gathered throughout THE Fall 2014, concerning employers offering internships through the Aztec Career Connections website. This report is intended to: Track the amount of employers placing San Diego State University students in internship and volunteer opportunities through the use of the Aztec Career Connections website. Track the amount of internships and volunteer opportunities being posted through the Aztec Career Connections website Tracking overall student placements throughout the semester on a bi-monthly basis SURVEY METHODOLOGY__________________________________________________________________________ Information gathered was done so through bi-monthly surveys that were individually emailed to employers. A preliminary survey was initially sent out, followed by a follow up survey about two weeks after the preliminary. This method of follow up was done so in order to obtain as much responses as possible. The survey included the following questions: Organization name If the internship(s) posted on Aztec Career Connections had been filled If a student from SDSU was hired to fill the position How many SDSU students were hired Information was also gathered through the Aztec Career Connections website on a bi- monthly basis. This data provided information of employers who would be surveyed, and the amount of new posts per month. Trends and themes observed in the data have been identified in the section “Observations” and observations specific to a certain time period have been addressed in its corresponding section. The analysis includes: Raw data analysis based off of data taken from the Aztec Career Connections website Bi-monthly Employer Internship survey data
- 2. 2 | P a g e Additionally, it should be noted that not all employers accounted for in the raw data analysis responded to the bi-monthly survey for various reasons, whether it be an email address deemed undeliverable, a general email address only accepting applications (i.e recruits@organizationname.com), or an employer simply choosing not to reply to a survey request. Finally, this report is possibly the first to track student placements and is a working document for following semesters to come. No data is known to be reported prior to Fall 2014, so no semester to semester comparisons can be made until following semester reports are created. RESULTS______________________________________________________________________________________________ Month to Month Raw Data July – August 2014 o Paid opportunities increased by 11.84% (+9) o Unpaid opportunities increased by 30.64% (+19) o Internship positions increased by 49.48% (+48) o Volunteer positions decreased by 48.48% (-16) o Employers using the Aztec Career Connections website increased by 33.33% (+32) o Positions posted on the Aztec Career Connections website increased by 21.99% (+31) July August Totals Percentage Totals Percentage Paid: 76 54% Paid: 85 49% Unpaid: 62 44% Unpaid: 81 47% N/A: 3 2% N/A: 6 3% Total: 141 100% Total: 172 100% Internship 97 69% Internship 145 84% Volunteer 33 23% Volunteer 17 10% Both 11 8% Both 10 6% Total 141 100% Total 172 100% Employers: 96 Employers: 128 Openings: 141 Openings: 172
- 3. 3 | P a g e 76 62 3 85 81 6 0 10 20 30 40 50 60 70 80 90 Paid: Unpaid: N/A: July-August 14' Paidv. Unpaid Opportunities Jul-14 Aug-14 97 33 11 145 17 10 0 20 40 60 80 100 120 140 160 Internship Volunteer Both July- August 14' Internships v. Volunteer Opportunities Jul-14 Aug-14 August – September 2014 o Paid opportunities increased by 48.24%(+41) o Unpaid opportunities decreased by 8.64% (-7) o Internship positions increased by 9.66% (+14) o Volunteer positions increased by 105.88% (+18) o Employers using Aztec Career Connections increased by 3.91% (+5) o Positions posted on Aztec Career Connections increased by 18.60% (+32) August September Totals Percentage Totals Percentag e Paid: 85 49% Paid: 126 61.76% Unpaid: 81 47% Unpaid: 74 36.27% N/A: 6 3% N/A: 4 1.96% Total: 172 100% Total: 204 100% Internship 145 84% Internship 159 79.25% Volunteer 17 10% Volunteer 35 20.28% Both 10 6% Both 10 0.47% Total 172 100% Total 204 100% Employers: 128 Employers: 133 Openings: 172 Openings: 204
- 4. 4 | P a g e 85 81 6 126 74 4 0 20 40 60 80 100 120 140 Paid: Unpaid: N/A: August-September Paidv Unpaid Opportunities Aug-14 Sep-14 145 17 10 159 35 10 0 20 40 60 80 100 120 140 160 180 Internship Volunteer Both August-September Internshipv. Volunteer Opportunities Aug-14 Sep-14 September – October 2014 o Paid opportunities increased by 7.93% (+10) o Unpaid opportunities decreased by 24.32% (-18) o Internship opportunities increased by 6.29% (+10) o Volunteer opportunities decreased by 62.86% (-22) o Employers using Aztec Career Connections decreased by 4.51% (-6) o Positions posted on Aztec Career Connections decreased by 3.92% (-8) September October Totals Percentage Totals Percentage Paid: 126 61.76% Paid: 136 68.69% Unpaid: 74 36.27% Unpaid: 56 28.28% N/A: 4 1.96% N/A: 6 3.03% Total: 204 100% Total: 198 100% Internship 159 79.25% Internship 169 85.35% Volunteer 35 20.28% Volunteer 13 6.57% Both 10 0.47% Both 16 8.08% Total 204 100% Total 198 100% Employers: 133 Employers: 127 Openings: 204 Openings: 196
- 5. 5 | P a g e 126 74 4 136 56 6 0 20 40 60 80 100 120 140 160 Paid: Unpaid: N/A: September - October Paidv Unpaid Opportunities Sep-14 Oct-14 159 35 10 169 13 16 0 20 40 60 80 100 120 140 160 180 Internship Volunteer Both September - October Internshipv Volunteer Opportunities Sep-14 Oct-14 October – November 2014 o Paid Opportunities decreased by 37.5% (-51) o Unpaid Opportunities decreased by 17. 86% (-10) o Internships decreased 26.63% (-45) o Volunteers decreased by 23.08% (-3) o Employers Postings on Aztec Career Connections decreased by 27.00% (-27) o Postings on Aztec Career Connections decreased by 30.61% (-60) October November Totals Percentage Totals Percentage Paid: 136 68.69% Paid: 85 63% Unpaid: 56 28.28% Unpaid: 46 34% N/A: 6 3.03% N/A: 5 4% Total: 198 100% Total: 136 100% Internship 169 85.35% Internship 124 91% Volunteer 13 6.57% Volunteer 10 7% Both 16 8.08% Both 2 1% Total 198 100% Total 136 100% Employers: 127 Employers: 100 Openings: 196 Openings: 136
- 6. 6 | P a g e 136 56 6 85 46 5 0 20 40 60 80 100 120 140 160 Paid: Unpaid: N/A: October - November:Paidv. Unpaid opportunities Oct-14 Nov-14 169 13 16 124 10 2 0 20 40 60 80 100 120 140 160 180 Internship Volunteer Both October - November:Internshipv. Volunteer opportunities Oct-14 Nov-14 November – December 2014 o Paid internships increased 48.23 %(+41) o Unpaid internships increased by 17.39%(+8) o Internship opportunities increased by 26.61% (+33) o Volunteer opportunities increased by 90.00% (+9) o Overall employer positions increased 32.35% (+44) o Employers posting on Aztec Career Connections increased 31.00% (+31) November December Totals Percentage Totals Percentage Paid: 85 63% Paid: 126 70% Unpaid: 46 34% Unpaid: 54 30% N/A: 5 4% N/A: 0 0% Total: 136 100% Total: 180 100% Internship 124 91% Internship 157 87% Volunteer 10 7% Volunteer 19 11% Both 2 1% Both 4 2% N/A: 0 0% N/A: 0 0% Total 136 100% Total 180 100% Employers: 100 Employers: 131 Openings: 136 Openings: 180
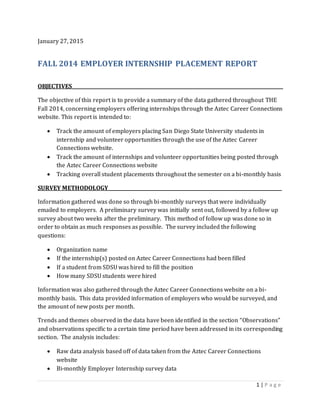
- 7. 7 | P a g e 85 46 5 126 54 0 0 20 40 60 80 100 120 140 Paid: Unpaid: N/A: November v. December: Paid v Unpaid Opportunities Nov-14 Dec-14 124 10 2 157 19 4 0 20 40 60 80 100 120 140 160 180 Internship Volunteer Both November v. December: Internship v. Volunteer Opportunities Nov-14 Dec-14 76 85 126 136 85 126 62 81 74 56 46 54 3 6 4 6 5 0 0 20 40 60 80 100 120 140 160 July August September October November December Paid v. Unpaid Internships 2014 Paid Internships Unpaid Internships N/A July – December, Fall 2014 Raw Data Overview o Paid v. Unpaid Paid internships have increased overall by 65.78% (+50) in the Fall 2014 semester Unpaid internships have decreased overall by 12.90% (-8) in the Fall 2014 semester
- 8. 8 | P a g e 97 145 159 169 124 157 33 17 35 13 10 19 11 10 10 16 2 4 0 20 40 60 80 100 120 140 160 180 July August September October November December Internshipv. Volunteer Opportunities2014 Internships Volunteers Both 96 128 133 127 100 131 0 20 40 60 80 100 120 140 July August September October November December EmployersPosting 2014 Employers Posting 2014 Internship v. Volunteer Opportunities o Internship opportunities increased overall by 61.86% (+60) in the Fall 2014 semester o Volunteer opportunities decreased overall by 42.42% (-14) in the Fall 2014 semester Employer Posting on Aztec Career Connections o The number of employers posting on Aztec Career connections have overall increased by 36.46% (+35) in the Fall 2014 semester o Total Employers from July – December 2014: 715 Employers
- 9. 9 | P a g e 141 172 204 196 136 180 0 50 100 150 200 250 July August September October November December Positions Posted Per Month Positions Posted Per Month 1 studen t, 6, 13% 2 students, 3, 7% 3 students, 4, 9% 4 students, 0, 0% 5 students, 1, 2% 6 students, 1, 2% 7 students, 0, 0% 8 students, 1, 2% N/A, 30, 65% July-August 2014 Student Placements 1 student 2 students 3 students 4 students 5 students 6 students 7 students 8 students N/A Positions Posted on Aztec Career Connections o The amount of positions posted on Aztec Career Connections have overall increased by 27.66% (+39) in the Fall 2014 semester o Total Postings from July – December 2014: 1029 Positions Survey Data July – August 2014 o Total employers – 224 o Total postings – 313 o Response Rate: 23.59% 195 emails sent, 46 respondents o Placements – 43
- 10. 10 | P a g e 1 student, 18.03% 2 student, 4.92% 3 student, 3.28% 4 students, 6.56% 5 students, 0.00% 6 students, 0.00% 7 students, 1.64% 8 students, 1.64% 9 students, 0.00% 10+ students, 0.00% N/A, 63.93% September-October 2014 Student Placements 1 student 2 student 3 student 4 students 5 students 6 students 7 students 8 students 9 students 10+ students N/A No. of Student interns No. of Employers Percentage No. of students hired 1 6 13.04% 6 2 3 6.52% 6 3 4 8.70% 12 5 1 2.17% 5 6 1 2.17% 6 8 1 2.17% 8 N/A (skipped) 30 65.22% 0 Totals: 46 100% Total hired: 43 September – October 2014 o Total employers – 247 o Total postings – 400 o Response rate – 27.11% 225 emails sent, 61 respondents o Placements – 54
- 11. 11 | P a g e 1 students, 5, 17% 2 students, 12, 40% 3 students, 9, 30% 4 students, 4, 13% 5 students, 0, 0% 6 students, 0, 0% 7 students, 0, 0% 8 students, 0, 0% November- December 2014 Student Placements 1 students 2 students 3 students 4 students 5 students 6 students 7 students 8 students No. of SDSU interns No. employers who hired Percentage Total SDSU Students 1 11 18.03% 11 2 3 4.92% 6 3 2 3.28% 6 4 4 6.56% 16 7 1 1.64% 7 8 1 1.64% 8 N/A Skipped 39 63.93% 0 TOTAL: 61 TOTAL: 100% TOTAL: 54 November – December 2014 o Total employers – 231 o Total postings – 316 o Response Rate: 25.00% 192 emails sent, 48 respondents o Placements – 30
- 12. 12 | P a g e 22 18 15 8 1 1 1 2 0 5 10 15 20 25 1 student 2 students 3 students 4 students 5 students 6 students 7 students 8 students Amount of Students Hired per Employer Employers hiring No. of SDSU interns No. employers who hired Percentage Total SDSU Students 1 5 10.41% 5 2 6 12.50% 12 3 3 6.25% 9 4 1 2.08% 4 N/A Skipped 33 68.75 0 TOTAL: 48 TOTAL: 100% TOTAL: 30 July – December 2014 o Total Employers who have hired students – 68 o There have been a total of 155 respondents Of the 155 respondents, 68 (43.87%) respondents have confirmed hiring an SDSU student Students hired Employers who Hired Percentage 1 22 32.35% 2 18 26.47% 3 15 22.06% 4 8 11.76% 5 1 1.47% 6 1 1.47% 7 1 1.47% 8 2 2.94% Total 68 100%
- 13. 13 | P a g e 43 54 30 0 10 20 30 40 50 60 July/August14 Sept/Oct14 Nov/Dec14 Total Students Hired Total Students Hired Total placements o July/August – 43 (33.86%) o September/October – 54 (42.52%) o November/December – 30 (23.62%) o Total – 127 OBSERVATIONS____________ _________________________________________________________________________ Raw Data According to the data taken from the Aztec Career Connections website (Symplicity), internships posted mimic the need of students looking for internships. In other words, internship opportunities particularly show an increase at the beginning of a semester as well as towards mid-semester. Internship opportunities then decrease towards the end of the semester when more focus is turned toward school related responsibilities such as midterms and finals. It can be predicted that this trend will continue in following semesters. Another trend that was seen given by the raw data is that the amount of paid internships has increased while the amount of unpaid and volunteer opportunities has decreased.
- 14. 14 | P a g e Survey Data The data gathered through email surveys compliments the pattern depicted by the given raw data; more students have been placed in positions towards the beginning and mid-semester rather than towards the end of the semester. A reason for this is similar to the reason that is given in the raw data. Students are more inclined to look for internships towards the beginning and mid-semester to fulfill requirements of courses that require an internship experience. As the semester comes to an end, students tend to focus themselves towards academic achievement before searching for more internship opportunities. It can be predicted that this trend will continue in following semesters. It should also be taken into consideration that a majority of those who either did not respond at all to the survey or responded “No,” in answering whether or not the internship position had been filled, posted on their opportunity on Aztec Career Connections relatively close to the period of when preliminary emails were sent out. Given the amount of time, one can infer that there haven’t been enough applicants for the position or that the application deadline has not yet passed, therefore these companies cannot comment yet on whether or not an SDSU student has been hired to fill that internship position. One suggestion for this complication in the survey process may be to allow for a specified amount of time to pass from the last posting of the month of which bi-monthly surveys are sent out so that employers can go through the hiring process. CONCLUSION_________________________________________________________________________________________ In conclusion, data indicates that there is a relationship between the amount of postings per month and the number of student placements. The time period during the semester at which an internship is posted also plays a role in the amount of SDSU students placed in internship opportunities. In order to gain a better idea of trends and relationships between these variables, the process should be continued. As previously stated, this is a working document and thus will see additions and improvements to the methods used to gain better information on student placements, employer postings, and tracking the number of employers using the Aztec Career Connections website as a resource for employment.