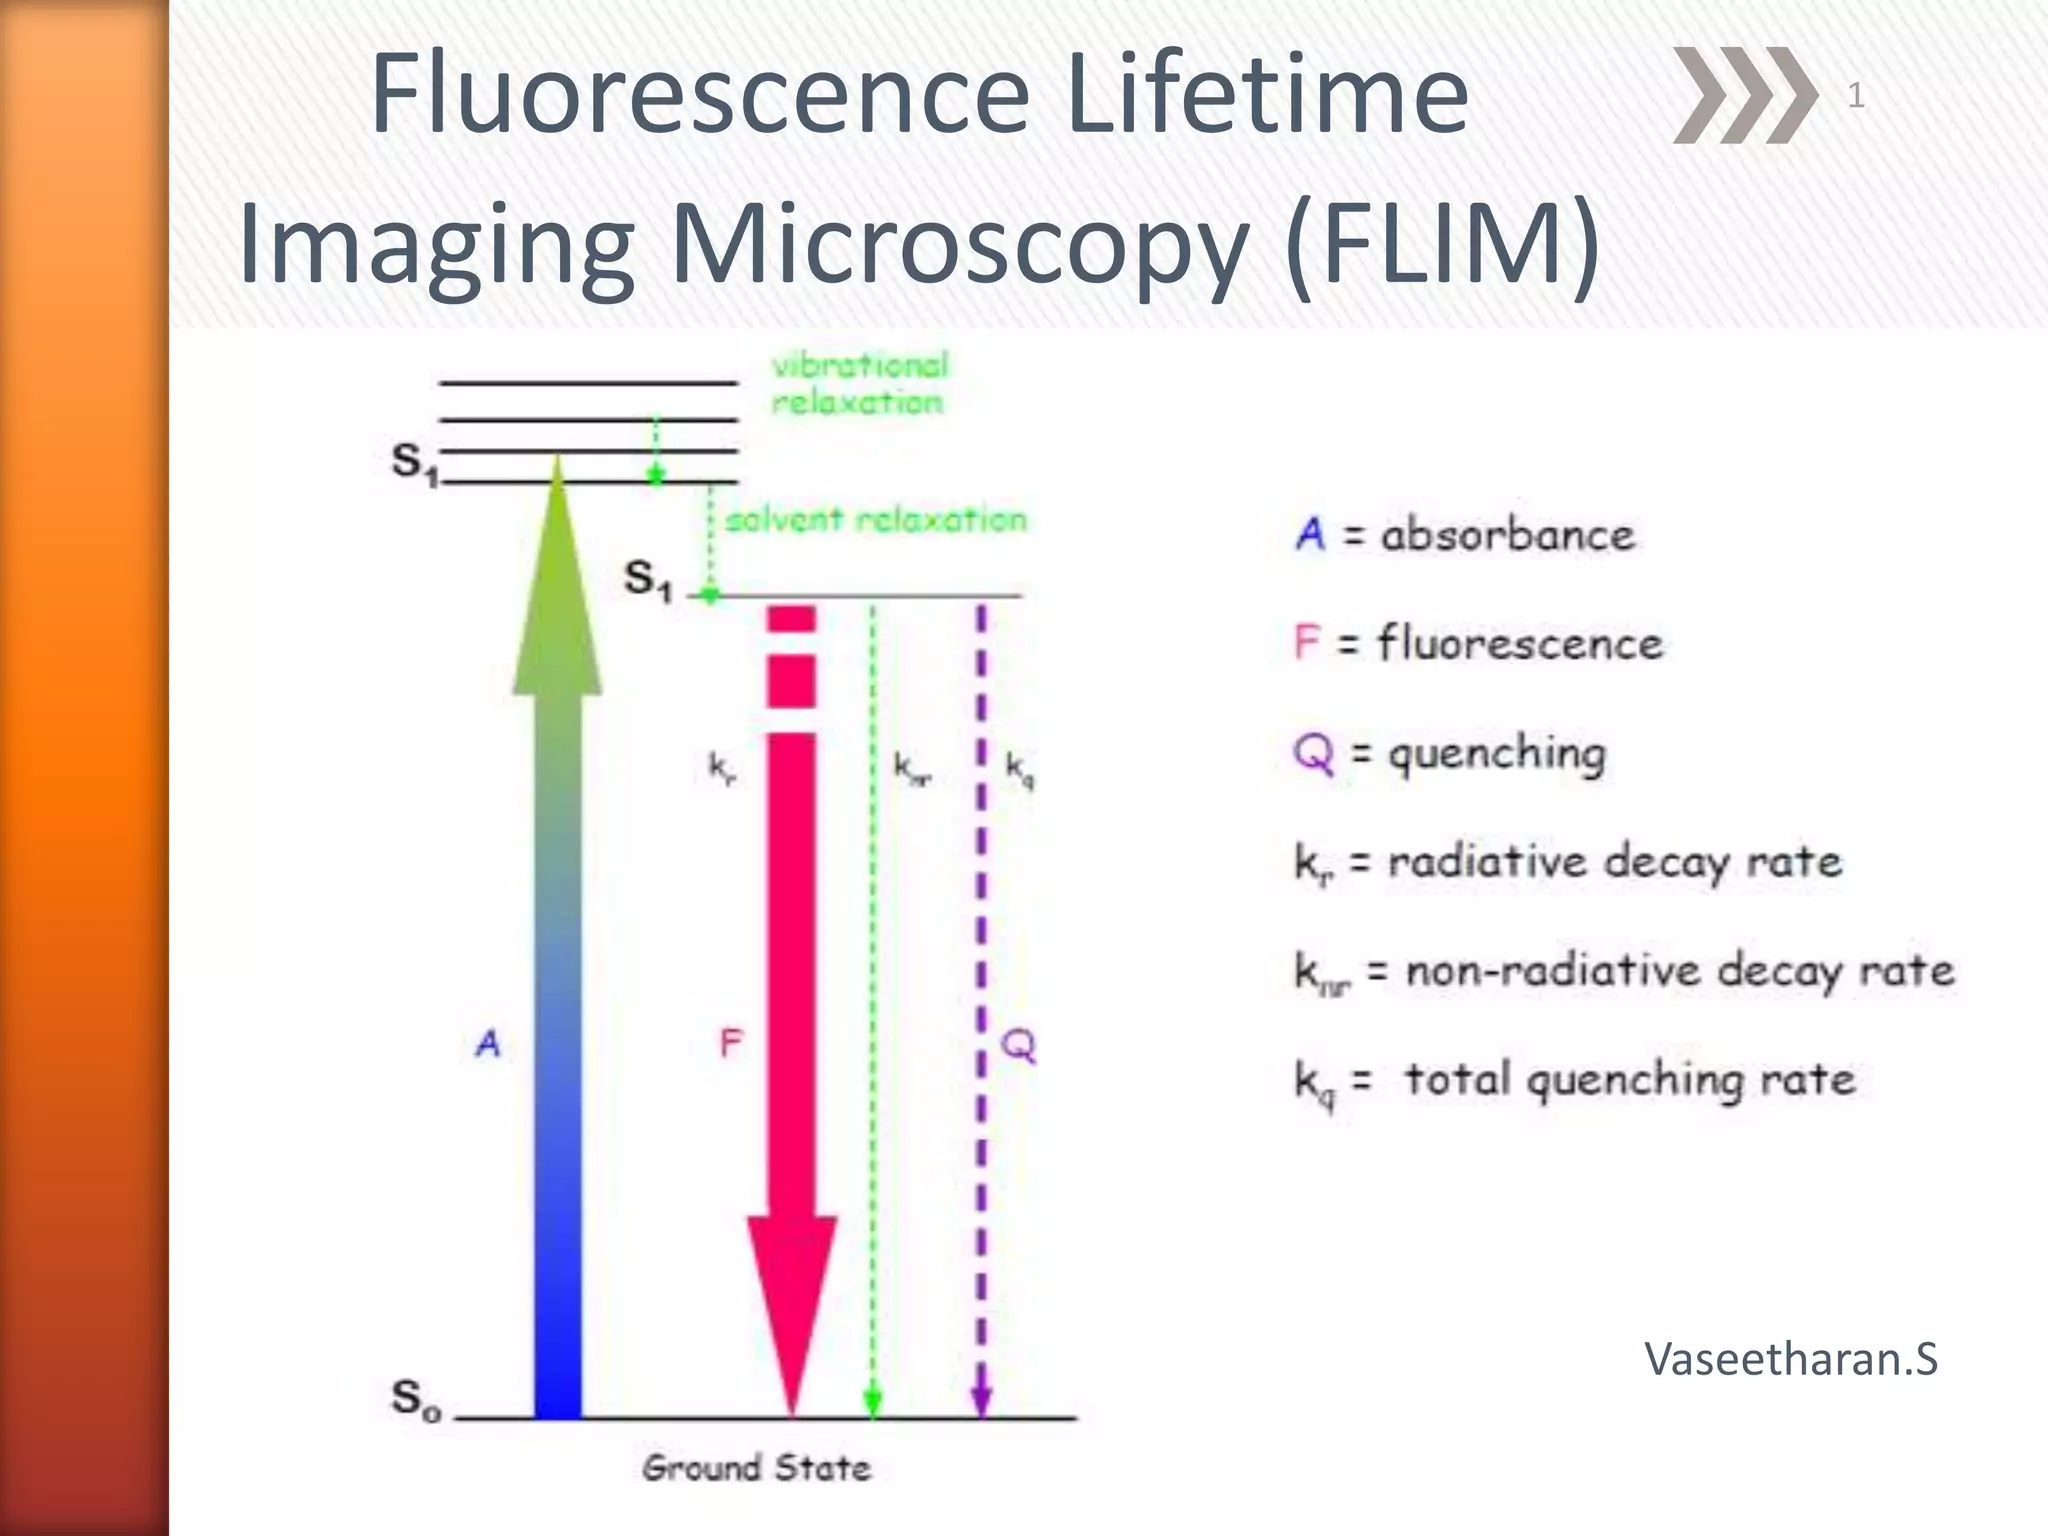
What is FLIM?
Fluorescence-lifetimeimaging microscopy or FLIM is an imaging technique
for producing an image based on the differences in the exponential decay rate
of the fluorescence from a fluorescent sample.
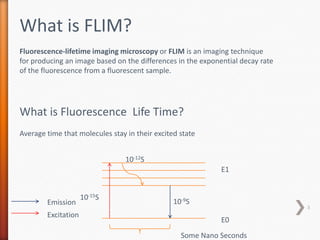
What is Fluorescence Life Time?
Average time that molecules stay in their excited state
E1
E0
Some Nano Seconds
Excitation
Emission
10-15S
10-12S
10-9S
3
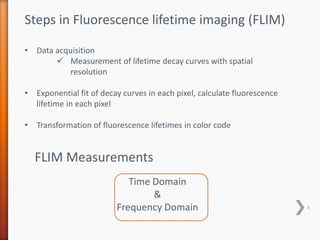
FLIM Measurements
Time Domain
&
FrequencyDomain
Steps in Fluorescence lifetime imaging (FLIM)
• Data acquisition
Measurement of lifetime decay curves with spatial
resolution
• Exponential fit of decay curves in each pixel, calculate fluorescence
lifetime in each pixel
• Transformation of fluorescence lifetimes in color code
6
7.
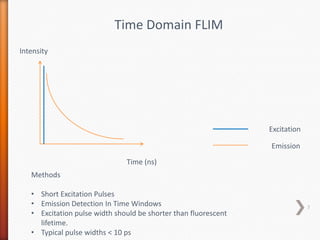
Time Domain FLIM
Intensity
Time(ns)
Excitation
Emission
Methods
• Short Excitation Pulses
• Emission Detection In Time Windows
• Excitation pulse width should be shorter than fluorescent
lifetime.
• Typical pulse widths < 10 ps
7
8.
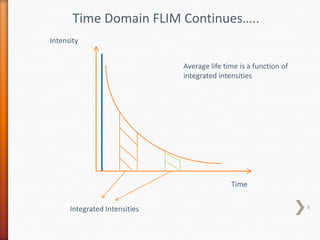
Time Domain FLIMContinues…..
Intensity
Time
Integrated Intensities
Average life time is a function of
integrated intensities
8
9.
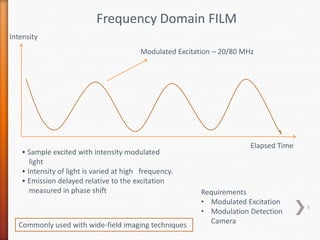
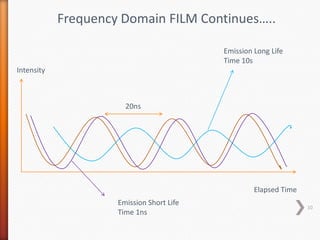
Frequency Domain FILM
Intensity
ElapsedTime
• Sample excited with intensity modulated
light
• Intensity of light is varied at high frequency.
• Emission delayed relative to the excitation
measured in phase shift
Modulated Excitation – 20/80 MHz
Requirements
• Modulated Excitation
• Modulation Detection
CameraCommonly used with wide-field imaging techniques
9
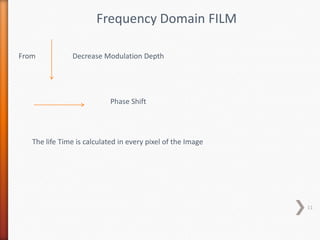
Frequency Domain FILM
DecreaseModulation Depth
Phase Shift
The life Time is calculated in every pixel of the Image
From
11
12.
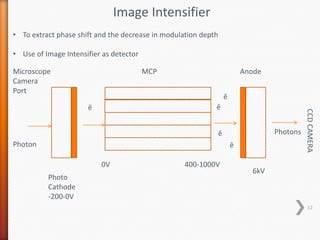
Image Intensifier
• Toextract phase shift and the decrease in modulation depth
• Use of Image Intensifier as detector
Microscope
Camera
Port
Photon
Photo
Cathode
-200-0V
MCP Anode
0V 400-1000V
6kV
Photons
CCDCAMERA
ē
ē
ē
ē
ē
12
13.
MCP Anode
0V 400-1000V
6kV
Photons
CCDCAMERA
ē
ē
ē
ē
ē
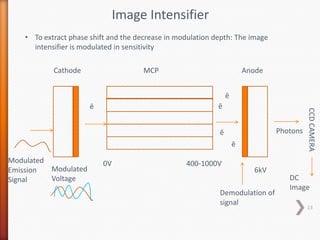
ImageIntensifier
• To extract phase shift and the decrease in modulation depth: The image
intensifier is modulated in sensitivity
Modulated
Emission
Signal
Modulated
Voltage
Demodulation of
signal
DC
Image
Cathode
13
14.
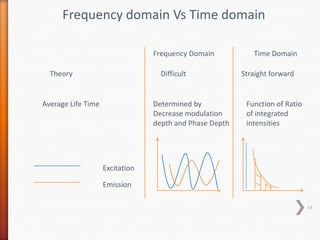
Frequency domain VsTime domain
Frequency Domain Time Domain
Theory Difficult Straight forward
Average Life Time Determined by
Decrease modulation
depth and Phase Depth
Function of Ratio
of integrated
intensities
Excitation
Emission
14
15.
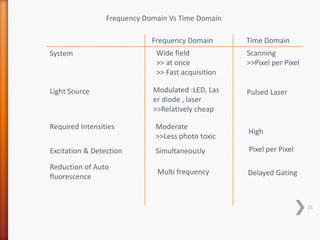
Frequency Domain TimeDomain
Frequency Domain Vs Time Domain
System Wide field
>> at once
>> Fast acquisition
Scanning
>>Pixel per Pixel
Light Source Modulated :LED, Las
er diode , laser
>>Relatively cheap
Pulsed Laser
Required Intensities Moderate
>>Less photo toxic
High
Excitation & Detection Simultaneously Pixel per Pixel
Reduction of Auto
fluorescence
Multi frequency Delayed Gating
15
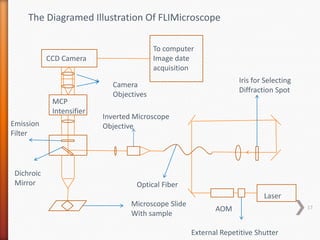
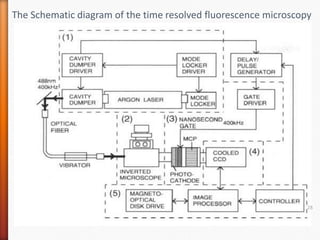
CCD Camera
MCP
Intensifier
Camera
Objectives
To computer
Imagedate
acquisition
Emission
Filter
Dichroic
Mirror
Microscope Slide
With sample
Laser
AOM
External Repetitive Shutter
Iris for Selecting
Diffraction Spot
Optical Fiber
Inverted Microscope
Objective
The Diagramed Illustration Of FLIMicroscope
17
18.
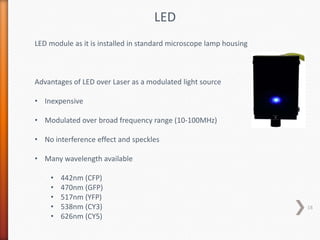
LED
LED module asit is installed in standard microscope lamp housing
Advantages of LED over Laser as a modulated light source
• Inexpensive
• Modulated over broad frequency range (10-100MHz)
• No interference effect and speckles
• Many wavelength available
• 442nm (CFP)
• 470nm (GFP)
• 517nm (YFP)
• 538nm (CY3)
• 626nm (CY5)
18
19.
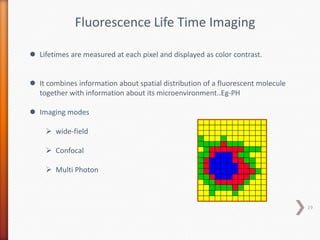
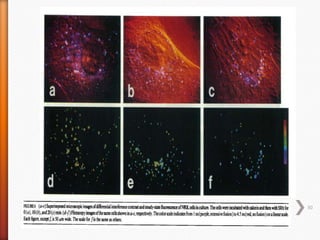
Fluorescence Life TimeImaging
Lifetimes are measured at each pixel and displayed as color contrast.
It combines information about spatial distribution of a fluorescent molecule
together with information about its microenvironment..Eg-PH
Imaging modes
wide-field
Confocal
Multi Photon
19
20.
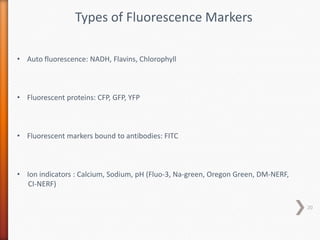
Types of FluorescenceMarkers
• Auto fluorescence: NADH, Flavins, Chlorophyll
• Fluorescent proteins: CFP, GFP, YFP
• Fluorescent markers bound to antibodies: FITC
• Ion indicators : Calcium, Sodium, pH (Fluo-3, Na-green, Oregon Green, DM-NERF,
CI-NERF)
20
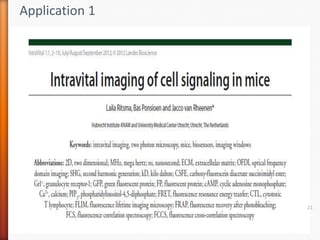
Introduction
The clinicalstrategic study of cancer requires understanding of signaling
pathways in their pathophysiological contexts
2D-culture models lack the full dimensions of integrated local and systemic +ve and
-ve feedback signals
The in vivo environment contains 3 categories of factors that impose additional cell
signaling on individual cells
Neighboring cells
Secreted soluble factors
Non-cellular structural factors
The routinely used methods are
PCR
Western Blotting
22
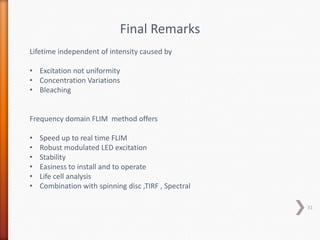
Final Remarks
Lifetime independentof intensity caused by
• Excitation not uniformity
• Concentration Variations
• Bleaching
Frequency domain FLIM method offers
• Speed up to real time FLIM
• Robust modulated LED excitation
• Stability
• Easiness to install and to operate
• Life cell analysis
• Combination with spinning disc ,TIRF , Spectral
31
32.
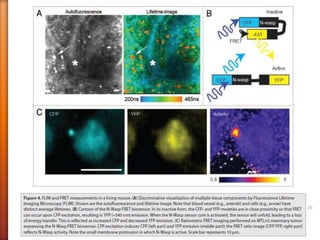
FILM APPLICATIONS
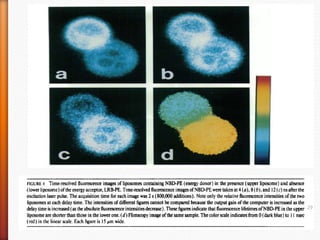
Dyedifferential visualization.
Energy transfer (FRET) for distance measurements
Concentration measurements of ions (Ca2+ , Na+, pH), small ligands, oxygen
Environmental studies (viscosity, refractive index, membrane potential)
Protein studies (Proteomics)
Intracellular signal transduction 32