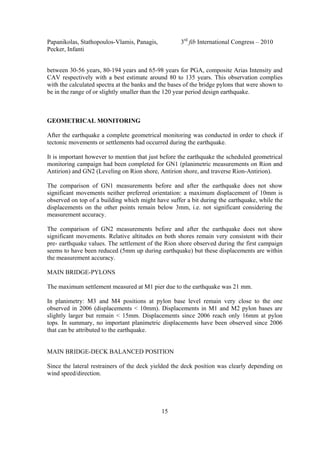
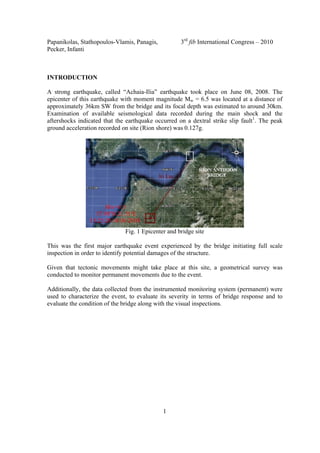
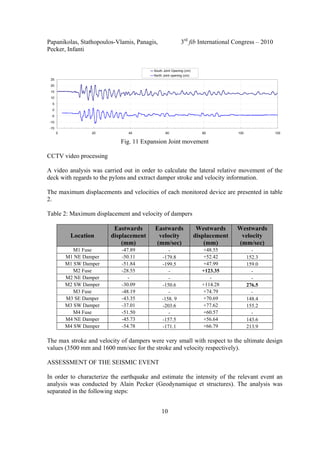
The Rion-Antirion Bridge in Greece withstood the 2008 Mw 6.5 Achaia-Ilia earthquake without structural damage. The bridge's seismic design included energy dissipation devices and sacrificial fuses that were activated during the quake as intended. Post-earthquake inspections confirmed yielding of all lateral fuses while minor non-structural damage occurred. Data from the bridge's monitoring system was analyzed to evaluate the bridge's response and performance of the seismic design elements during the strong shaking event.
![Papanikolas, Stathopoulos-Vlamis, Panagis, 3rd
fib International Congress – 2010
Pecker, Infanti
2
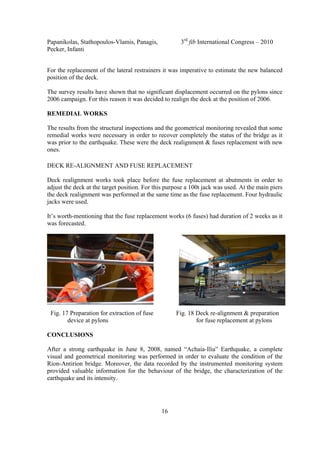
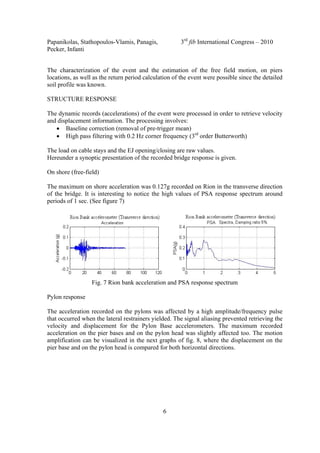
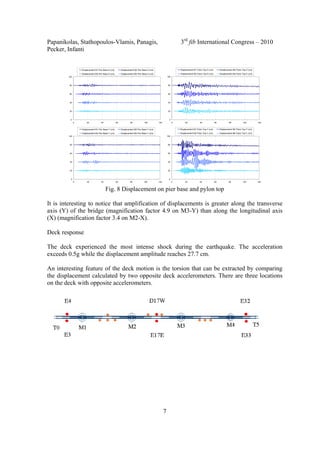
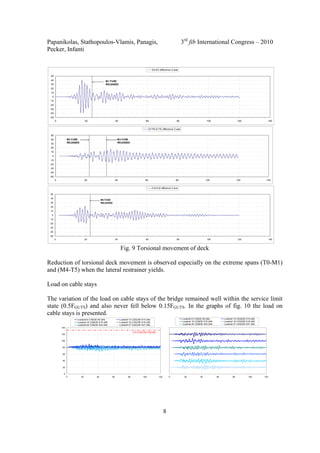
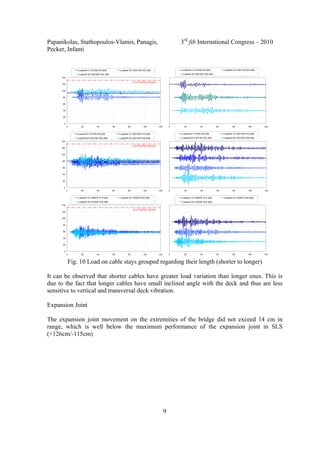
BRIDGE DESCRIPTION AND EARTHQUAKE DESIGN
Fig. 2 Bridge elevation
Rion-Antirion Bridge is a five span cable-stay bridge located in the western Greece linking
Peloponnese with the continental Greece.
The harsh environmental conditions of the area which determined the design of the bridge are
the:
• Large water depth
• Deep soil strata of weak alluviums
• High seismicity & strong winds
• Tectonic movements
The specified2
high return period (2000 years) of the design earthquake yields to a response
spectrum (fig. 3) with P.G.A. of 0.48g, which is greater than that specified by the National
seismic code3
(475 year return period) for the particular seismic risk zone III.
0
0,3
0,6
0,9
1,2
1,5
0,0 1,0 2,0 3,0 4,0 5,0Period [s]
pseudoacceleration[g]
EAK 2000
Seismic risk zone III
Soil cat "Γ "
5% damping
Importance factor I = 1,3
RION-ANTIRION
E.A.K.
Fig. 3 Design earthquake spectrum](https://image.slidesharecdn.com/fib2010article269june2008eqcasestudyreva-130514092719-phpapp02/85/Fib2010-article269-june-2008-eq-case-study_rev_a-3-320.jpg)
![Papanikolas, Stathopoulos-Vlamis, Panagis, 3rd
fib International Congress – 2010
Pecker, Infanti
14
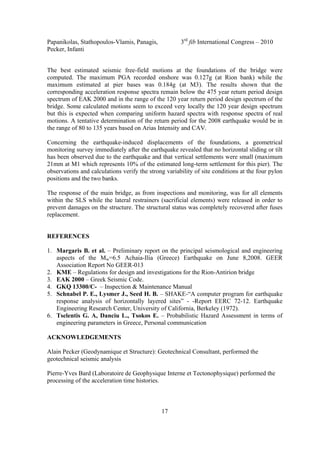
Table 3: Calculated intensity parameters (average, extreme values)
Intensity
parameters for:
PGA
Arias
Intensity
CAV
4 Recorded
Rion/Antirion
0.11g
(0.093g-0.127g)
0.39 [m/s]
(0.38-0.40)
5.31 [m/s]
(5.10-5.76)
48 Calculated
under piers
0.123g
(0.071g-0.189g)
0.55 [m/s]
(0.34-0.84)
5.92 [m/s]
(4.50-8.39)
Estimation of return period
Using the calculated intensity parameters, an estimate (upper and lower limit) of the return
period of the earthquake is performed using recurrence relationships established for PGA,
Arias Intensity and CAV6
.
Fig. 16 Estimation of return periods based on upper and lower limit of each intensity
parameter
Examination of the figures and consideration of the measured values of the ground motion
parameters leads to the conclusion that the return period of the examined earthquake is](https://image.slidesharecdn.com/fib2010article269june2008eqcasestudyreva-130514092719-phpapp02/85/Fib2010-article269-june-2008-eq-case-study_rev_a-15-320.jpg)