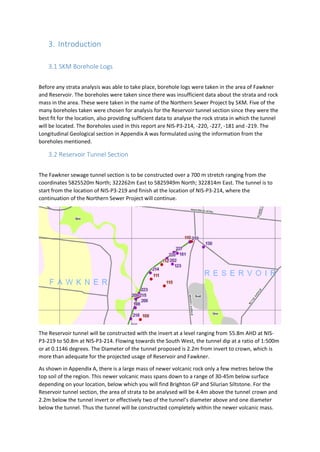
Fawkner-
Reservoir Sewer
Tunnel
CIVE1105 Assignment 2
Briece Newton 3282911
Contents
Summary................................................................................................. Error! Bookmark not defined.
1. Project Background....................................................................................................................... 2
2. Scope ............................................................................................................................................ 2
3. Introduction.................................................................................................................................. 3
3.1 SKM Borehole Logs ............................................................................................................... 3
3.2 Reservoir Tunnel Section....................................................................................................... 3
3.3 Basalt Weathering................................................................................................................. 4
4. Rock Mass Classification ............................................................................................................... 5
4.1 Rock Mass Rating .................................................................................................................. 5
4.1.1 Strength of Intact Rock.................................................................................................. 5
4.1.2 Rock Quality Designation (RQD)........................................................................................... 5
4.1.3 Spacing of Discontinuities .................................................................................................... 6
4.1.4 Condition of Discontinuities................................................................................................. 6
4.1.5 Groundwater........................................................................................................................ 6
4.2 Q System............................................................................................................................... 6
4.2.1 (𝑅𝑄𝐷𝐽𝑛) ........................................................................................................................ 7
4.2.2 𝐽𝑟𝐽𝑎 ............................................................................................................................... 7
4.2.3 (𝐽𝑤𝑆𝑅𝐹) ....................................................................................................................... 8
4.3 Rock Mass Parameters.......................................................................................................... 8
5. List of Tables ................................................................................................................................. 9
NDS – RMR Table of Values............................................................................................................... 0
NDS – Q System Table of Values ....................................................................................................... 0
NDS – Table of Rock Parameters....................................................................................................... 1
6. Application for Construction............................................................................................................. 0
6.1 Application of the RMR System.................................................................................................. 0
6.2 Applications of the Q System ...................................................................................................... 0
Appendix A............................................................................................................................................ 0
Longitudinal Section Plan.................................................................................................................. 0
Appendix B............................................................................................................................................ 0
Appendix C............................................................................................................................................ 1
1. Project Background
The proposed Reservoir sewage tunnel will be the initial section of a sewage tunnel linking the
Reservoir and Fawkner areas of Melbourne to the Northern Diversion Sewer. The sewage tunnel will
create an effective sewage outlet for the two Melbourne suburbs and extended area. The proposed
project will allow a significant increase in property development in the Melbourne area through
creating a much more effective outlet for suburban sewage. Without the construction of the
Reservoir sewage tunnel section, the suburban area around Reservoir would not be able to cope
with the rapid population growth in Melbourne, this would hinder the economic and population
capacity of Melbourne and the surrounding suburbs of Reservoir. This project will create the
framework to accommodate the future projected population growth of the Reservoir area and
consequently the expansion of Melbourne.
2. Scope
The proposed sewage section of the Northern Sewer Project will span 700m, connecting the
Reservoir area to the Northern Diversion Sewer. A range of borehole logs have been compiled to
analyse the rock strata beneath Fawkner, in to which the sewage tunnel will be constructed. This
report has been compiled based upon borehole information that was analysed to investigate the
state of the rock mass into which the tunnel will be constructed. Through laboratory testing and
geotechnical investigation, a clear interpretation of the structure and properties of the rock mass
has been formed. A summary of the data and techniques used is included in this report. Our
recommendations and discussion for the method of construction have based on our thorough
investigation and understanding of the rock mass below Fawkner.
3. Introduction
3.1 SKM Borehole Logs
Before any strata analysis was able to take place, borehole logs were taken in the area of Fawkner
and Reservoir. The boreholes were taken since there was insufficient data about the strata and rock
mass in the area. These were taken in the name of the Northern Sewer Project by SKM. Five of the
many boreholes taken were chosen for analysis for the Reservoir tunnel section since they were the
best fit for the location, also providing sufficient data to analyse the rock strata in which the tunnel
will be located. The Boreholes used in this report are NIS-P3-214, -220, -227, -181 and -219. The
Longitudinal Geological section in Appendix A was formulated using the information from the
boreholes mentioned.
3.2 Reservoir Tunnel Section
The Fawkner sewage tunnel section is to be constructed over a 700 m stretch ranging from the
coordinates 5825520m North; 322262m East to 5825949m North; 322814m East. The tunnel is to
start from the location of NIS-P3-219 and finish at the location of NIS-P3-214, where the
continuation of the Northern Sewer Project will continue.
The Reservoir tunnel will be constructed with the invert at a level ranging from 55.8m AHD at NIS-
P3-219 to 50.8m at NIS-P3-214. Flowing towards the South West, the tunnel dip at a ratio of 1:500m
or at 0.1146 degrees. The Diameter of the tunnel proposed is 2.2m from invert to crown, which is
more than adequate for the projected usage of Reservoir and Fawkner.
As shown in Appendix A, there is a large mass of newer volcanic rock only a few metres below the
top soil of the region. This newer volcanic mass spans down to a range of 30-45m below surface
depending on your location, below which you will find Brighton GP and Silurian Siltstone. For the
Reservoir tunnel section, the area of strata to be analysed will be 4.4m above the tunnel crown and
2.2m below the tunnel invert or effectively two of the tunnel’s diameter above and one diameter
below the tunnel. Thus the tunnel will be constructed completely within the newer volcanic mass.
3.3 Basalt Weathering
The newer volcanic mass below Reservoir is made up of a finely crystalline basalt rock mass. Basalt
flats were formed over a range of Melbourne valleys during the Tertiary period. The valleys of
Melbourne were filled by basalt lava flows creating a porous vesicular layer of solid basalt once it
cooled. Basalt, being quite a porous rock, allows water to flow through over time allowing
weathering of the rock mass beneath the surface.
The Borehole data shows a fluctuating water table situated around 7-8 m below the surface level.
The rise and fall of the water table through the basalt increases the pressure inside the rock mass
and has resulted in a wide range of weathering across the basalt flats. The uneven weathering across
the basalt flats has created a weak and fractured mass in some parts of the basalt flats, whilst other
areas have kept their strength.
Through analysing borehole logs of the area, we will show the use of techniques such as; the RMR
Rating system and the Q System to map out a global picture of the basalt rock mass below Reservoir.
4. Rock Mass Classification
4.1 Rock Mass Rating
The rock mass rating system (RMR) was designed by Bieniawski, as part of the South African Council
for Scientific and Industrial Research, between 1974 and 1976. The RMR system satisfied a need for
a classification system to analyse rock masses around the world. The RMR system categorises a rock
mass based on its overall in-situ features to easily gain an understanding on its strength and
favourable features. The RMR system classifies a rock mass using the input of five rock mass
parameters. Each of these parameters are given separate values in accordance to their favourability
towards the strength and cohesion of the rock mass for excavation and construction. The five
parameters of the RMR system are listed below.
 Strength of Intact Rock Material
 Rock Quality Designation (RQD)
 Spacing of Discontinuities
 Condition of Discontinuities
 Groundwater
The RMR system uses the sum of these five parameters’ values to systematically rate the rock mass
on a scale of very poor to very good. The stability of a rock mass during excavation and construction
is proportional to the sum of all five parameters in the RMR system, hence the system is widely
accepted and used in the field of rock mechanics. Further adjustments are made to the RMR value
depending on the dominant orientation of the discontinuities depending on their favourability in
relation to the construction of the tunnel.
The value system for the RMR tables below is situated in Appendix B.
4.1.1 Strength of Intact Rock
The strength of intact rock material rating is based upon the value of the Uniaxial Compressive
Strength (UCS) and the Point Load Index (PLI). Each of these are values given to a rock mass based on
laboratory sample testing from borehole core samples. In the laboratory a Point Load Test is
performed and the values of the PLI and UCS are formulated from the results. Laboratory tests were
performed on each of the five boreholes used in the analysis of the rock mass. In this case only the
UCS results were taken from the area of interest of each borehole, with the results shown in Table 1.
Borehole ID Depth (m) UCS (MPa)
NIS-P3-214 21.43 - 21.63 28.5
NIS-P3-220 23.68 - 23.95 45
NIS-P3-227 22.75 - 23.01 55
NIS-P3-181 23.71 - 24.76 93
NIS-P3-219 26.52 - 26.82 51
Table 1. Borehole UCS Lab Results.
4.1.2 Rock Quality Designation (RQD)
The RQD rating was introduced by Deere in 1964. Originally developed to measure the
percentage of intact rock pieces in a rock mass. Intact rock pieces being any rock piece lager than
100mm, measured against the total length of the rock core or borehole. The RQD value gives an
understanding of the percentage of quality intact rock, as well as the percentage of crushed rock
inside area of interest. The RQD values have been taken from the NDS Borehole data from the five
Boreholes mentioned above. These values are seen and interpreted in NDS – RMR Table of Values.
4.1.3 Spacing of Discontinuities
The spacing of discontinuities inside a rock can affect its overall cohesion and shear strength.
Discontinuities, created large by in-situ pressures, are the points of failure in tunnel construction
disasters and the cohesion and shear strength of the discontinuities is affected by the spacing
between each joint. Depending on the average spacing between the discontinuities, a value is given
to rate the favourability in comparison to each of the other four RMR rock parameters. The values
for the spacing of discontinuities were extracted from the Northern Interception Sewer Borehole
Image Processing System Final Survey Report prepared by RAAX Australia. These values are seen and
Interpreted in NDS – RMR Table of Values.
4.1.4 Condition of Discontinuities
A RMR value is given to the condition of the discontinuities, accounting for their roughness,
shape, continuity, separation and their filling material. The condition of the discontinuities
themselves plays a large part in the stability of the tunnel during construction. The Condition of
Discontinuities’ values were extracted from the Northern Interception Sewer Borehole Image
Processing System Final Survey Report prepared by RAAX Australia. These values are seen and
Interpreted in NDS – RMR Table of Values.
4.1.5 Groundwater
The groundwater conditions within the rock mass were interpreted using the Moisture Content
percentage determined during the laboratory testing that was performed on the core samples. The
Moisture Content results from the lab tests are displayed below in Table 2.
Borehole ID Depth (m) Moisture Content (%)
NIS-P3-214 21.43 - 21.63 16.9
NIS-P3-220 23.68 - 23.95 2.75
NIS-P3-227 22.75 - 23.01 3.8
NIS-P3-181 27.22 - 27.54 2.9
NIS-P3-219 26.52 - 26.82 1.3
Table 2. Moisture Content Lab Results.
Groundwater levels affect the in-situ pressure acting on the rock mass by forcing the rock to
swell, this affects the deformation modulus and the overall cohesion of the rock mass. The
groundwater levels and moisture content exponentially affect the values of the UCS, PLI and the
deformation modulus; all of which are parameters that measure the strength of a rock mass. The
moisture content percentage has been cross-referenced with the Northern Interception Sewer
Borehole Image Processing System Final Survey Report prepared by RAAX Australia to decipher
values for the groundwater RMR rating system. These values are seen and Interpreted in NDS – RMR
Table of Values.
4.2 Q System
The Q system was developed at the Norwegian Geotechnical Institute in 1974. Formulated by Barton
et al. the Q system was derived to determine the structural support requirements for tunnel
excavation in rock mass. Developed to be used with the RMR system, the Q system uses similar
parameters though focusing more on the joints of the mass. The Q system also boasts a unique
reduction factor (SRF) to help decide on which construction measures are to be taken. The six
parameters of the Q system are listed below.
 Rock Quality Designation (RQD)
 Jn – the number of joint sets
 Jr – the joint roughness coefficient
 Ja – a coefficient to describe the weathering and infill of the joints
 Jw – a water pressure coefficient
 SRF – the Q system reduction factor
Each coefficient fits into the Q system equation which fits along a natural logarithmic scale. The
Equation to the Q system is shown below.
𝑄 = (
𝑅𝑄𝐷
𝐽𝑛
) ∗ (
𝐽𝑟
𝐽𝑎
) ∗ (
𝐽𝑤
𝑆𝑅𝐹
)
Through thoroughly examining the data presented in the SKM Borehole logs, the laboratory testing
of borehole core samples and the Final Survey Report prepared by Raax; Q system values were
calculated for the mass below Reservoir.
The Q system uses the equation above to categorise the rock mass into a system ranging from
extremely good to extremely poor. The tables used to calculate each quotient of the Q system tables
below is situated in Appendix C.
4.2.1 (
𝑅𝑄𝐷
𝐽𝑛
)
Each Quotient of the Q system defines a different quality of the rock mass. Similar to the RMR the
first quotient, (
𝑅𝑄𝐷
𝐽𝑛
), describes the rock mass quality using the RQD system, though in the Q system
the value of the RQD is reduced the coefficient describing the number of joints, Jn, throughout the
area of interest. By taking into account the number joints affecting the RQD, it gives a crude
numerical value rating the average block size throughout the rock mass.
For the Q system, the RQD is taken as its numerical value and rounded to the nearest intervals of 5.
The coefficient Ja is determined by cross referencing the number of sets of similar joints from the
Northern Interception Sewer Borehole Image Processing System Final Survey Report prepared by
RAAX against the Q system Ja classification table in Appendix C.
4.2.2 (
𝐽𝑟
𝐽𝑎
)
The second quotient of the Q system equation defines a numerical value for the roughness and
regularity of the joints affecting the rock mass, whilst reducing the value by analysing the weathering
and infill of the joints in question. A value is given for the roughness coefficient, Jr, in favour of the
cohesion of the rock mass since a rough and undulating discontinuity is desired. The value of Jr is
then reduced by the coefficient Ja, which has a value describing the degree of weathering and infill of
the discontinuities since weathering and infill reduces the cohesion between the intact rock pieces.
The combined equation represents the shear strength between each block with a numerical value,
hence representing the general cohesion of the mass as a whole.
Both coefficients; Jr and Ja are derived through interpreting data from the Northern Interception
Sewer Borehole Image Processing System Final Survey Report prepared by RAAX against the Q
system classification table in Appendix C
4.2.3 (
𝐽𝑤
𝑆𝑅𝐹
)
The last quotient of the Q system equation defines a numerical value for the negative effects of
active water pressure acting on the rock mass, whilst further reducing the value with a reduction
factor SRF. The coefficient Jw describes the reduction of both the effective normal stress acting upon
the mass and shear stress between the joints, as water pressure builds up it relieves the rock mass of
the in-situ stresses holding the mass together. The coefficient is further reduced by the reduction
factor SRF, which describes three situations; (1) the loosening load through excavation into shear
zones and clay bearing rock, (2) the rock stress in competent rock or (3) the confining loads in plastic
incompetent rock. Together, the last quotient describes the active stress acting from inside the rock
mass.
The coefficient Jw is determined by calculating the water pressure by using the depth of the area of
interest below the water level to calculate the unit weight of water pressure, from here you are able
to cross reference the water pressure with a value from the Q system classification table in Appendix
C. The reduction factor SRF is calculated by first deciding on which situation of (1), (2) or (3) best fits
the area of interest, from here you can decide on a value for the reduction factor from the Q system
classification table that best suits the situation.
4.3 Rock Mass Parameters
Using the RMR classification, important rock mass parameters describing the state of the mass on a
global level around each borehole can be derived. Using the RMR values and classification table in
Appendix B we are able define the rock parameters describing the cohesion, angle of friction and the
deformation modulus of the rock mass around each borehole. Each class has given values for each
parameter, we are able to interpolate between the values to derive an approximation for each
value. These values are shown below in NDS – Table of Rock Parameters.
The cohesion of the rock mass describes the pressure, in KPa, to which the in-situ forces hold the
mass together. Where the angle of friction describes the dominant angle at which these forces are
acting on the rock mass. The deformation modulus describes the gradient at which the rock mass
will act in a plastic manner and resist strain under passive or active stress. Although the values
derived are only approximations since weathering and moisture content can have a large effect on
these parameters of the rock mass.
5. List of Tables
NDS – RMR Table of Values
NDS – Q System Table of Values
NDS – Table of Rock Parameters
NDS – RMR Table of Values
Borehole ID
NIS-P3-214 NIS-P3-220 NIS-P3-227 NIS-P3-181 NIS-P3-219
Condition Rating Condition Rating Condition Rating Condition Rating Condition Rating
1. Strength of Intact Rock UCS 28.5 MPa 2.3 UCS 45MPa 3.6 UCS 55MPa 4.5 UCS 93MPa 6.3 UCS 51MPa 4
2.RQD 92.50% 17.8 89.80% 17 Nil 86.10% 16.7 100% 20
3. Spacing of Joints ~150 mm 6.9 ~410mm 9 Nil >2m 20 ~500mm 13.75
4. Condition of Joints >5mm 0 >5mm 0 Nil Rough <1mm 20 Rough <1mm 20
5. Groundwater Flowing 2 Damp 10 Damp 10 Damp 10 Damp 12
6. Adjustment for Structural Fair -5 Fair -5 Fair -5 Fair -5 Fair -5
RMR Rating Value 24 34.6 Nil 68 64.75
RMR Class Poor Poor Nil Good Good
Table 3. NDS – RMR Rating
NDS – Q System Table of Values
Borehole ID
NIS-P3-214 NIS-P3-220 NIS-P3-227 NIS-P3-181 NIS-P3-219
Condition Rating Condition Rating Condition Rating Condition Rating Condition Rating
ESR
1. RQD 92.50% 95 89.8 90 Nil 86.1 85 100 100
2. Jn 3J's + R 12 2J's 4 Nil Few J's 1 2J's 4
3. Jr R. Planar 1.2 R. Planar 1.3 Nil R.Planar 1.5 S. Und. 2.3
4. Ja Clay F'lld 3 Clay F'lld 3 Nil Tight 0.75 Tight 0.9
5. Jw Large Inflow 0.5 Minor Inflow 1 Nil
Minor
Inflow 1 Med. Inflow 0.66
6. SRF Single/Clay 5 Single/Clay 5 Nil Med. Stress 1 Med. Stress 1
Q 0.32 1.95 Nil 170 42.2
Q-Rating V.Poor Poor Nil E. Good Good
Table 4. Q System Table
NDS – Table of Rock Parameters
Borehole ID NIS-P3-214
NIS-P3-
220 NIS-P3-227
NIS-P3-
181 NIS-P3-219
RMR Rating 24 34.6 Nil 68 64.75
Description Poor Poor Nil Good Good
Cohesion of rock mass (Kpa) 0.12 0.17 Nil 0.44 0.42
Angle of friction 17° 22° Nil 44° 42°
Deformation Modulus (Gpa) 2.6 4.6 Nil 33.2 27
Table 5. NDS – Table of Rock Parameters
6. Application for Construction
6.1 Application of the RMR System
The RMR class calculated in NDS – RMR Table of Values is therefore cross referenced against the
Guidelines for excavation and support of 10 m span rock tunnels in accordance with the RMR system
(After Bieniawski 1989) shown in Table 3. below. Referencing the table below we are able to
recommend a construction method for the tunnel, borehole by borehole. It should be taken into
account that no changes have been made to this table since 1973. Therefore this table should only
be used to recommend a construction method and all support details should be recommended using
the Q system table in 6.2.
Table 6. Guidelines for excavation and support of 10 m span rock tunnels in accordance with the
RMR system (After Bieniawski 1989).
6.2 Applications of the Q System
Using their experience and mathematic knowledge, a tunnel support table was formulated by
Grimstad and Barton in 1993 (the table was then reviewed and reproduced by Palmstrom and Broch
in b2006). This tunnelling support table was designed to work alongside the Q system, utilizing the
values produced and putting them toward a practical excavation use.
The Q system values can be cross referenced against a quotient, De, of the height of the tunnel
excavation divided by the excavation support ratio, (𝐻𝑒𝑖𝑔ℎ𝑡/𝐸𝑆𝑅). The ESR coefficient was designed
by Barton et al. and was given values depending on the scale of excavation taking place. The ESR for
water treatment plants and support tunnels is given a value of 1.3.
Thus De takes the value of;
𝐻𝑒𝑖𝑔ℎ𝑡
𝐸𝑆𝑅
=
2.2
1.3
= 1.7
Using the ESR and Q system value, we can cross-reference these values in the table below containing
estimated support categories based on the tunnelling quality index of Q.
Table7. Estimated support categories based on the tunnelling quality index Q (After Grimstad and
Barton, 1993, reproduced from Palmstrom and Broch, 2006).
By cross-referencing our values against the table above, we are able to give close estimates to the
best tunnel support method for excavation and longevity of the tunnel.
7. Discussion
The Basalt Rock Mass on a global scale, runs from a slightly weathered mass at boreholes 219 and
181 and as construction moves further through the mass the rock will show larger signs of
weathering and fracturing. The Basalt mass shows quite strong signs of weathering between
boreholes 214 and 220. This seems to be due to ground water flow streams through the mass
creating open weathered fractures and allowing smooth, unstable clay coatings to form inside. The
rock mass around the area of borehole 214 is heavily fractured and shows large clay filled
discontinuities running through the area of interest. The stability of the rock mass around such
weathering is highly affected, shown by the cohesion of rock mass at borehole 214 dropping to
almost a quarter of that at boreholes 181 and 219. The condition of the mass around borehole 214 is
something to be wary of during construction, diligence in the reinforcement and construction
methods is needed.
The severe weathering of the mass continues from borehole 214 all the way passed the area of
borehole 220. Although the mass improves slightly in both the RMR and Q class systems, the mass
around 220 still shown a large amount of fractures and unstable clay filled discontinuities which
intersect the area of interest in the mass. Although the general condition of the mass improves
slightly from borehole 214, the area of borehole 220 is still classed as poor in both systems. With the
amount of fractures and clay filled discontinuities shown throughout the area of interest the mass
may be unstable and may require reinforcement during construction to avoid disaster.
Although there is minimal information that can be interpreted about borehole 227, with increase in
Uniaxial Compressive Strength and decrease in Water Content Percentage we can assume that the
rock would be similar to that of borehole 219. With the strongest and most cohesive area of the
mass situated around borehole 181; we can safely assume that, as the mass continues from the area
of borehole 220 towards that of 181, the rock mass quality and stability will increase at a close to
linear rate. Taking a conservative estimate, we can assume that the mass around borehole 227
would fit along the low end of the fair rating in both the Q system and RMR system.
The area of interest around borehole 181 is quite a stable part of the mass. Only containing four
discontinuities and no major seams, this area of the mass is the most competent area of the area of
interest. This area will give minimal trouble to the construction of the sewage tunnel.
As the area of interest continues towards the final borehole, 219, the mass begins to show a few of
stronger in-situ forces acting on the area of rock mass but no signs of strong weathering. Through
the area of interest around borehole 219 contains only two main sets of joints with several
discontinuities in each set. Whilst the majority of the joints lie open, the majority have rough walls
and take an undulating form, these qualities will help stabilise the mass and boost the overall
cohesion of the area along the lines of discontinuity.
The mass as a whole shows signs of increased weathering moving from right to left along the
geological section. With the deformation modulus dropping dramatically towards the boreholes
further left of the section, the movement and pressure of tunnel construction could create further
fractures and weakness in this area of the mass. Extra reinforcement should be added as
construction nears borehole 220 and should continue until construction ends.
8. Recommendations
On a global level the condition of the rock mass has many areas of poor mass and a conservative
method of construction should be used. On the basis of the RMR and Q system outputs around the
boreholes 214 and 220, a top heading and bench method of construction for the sewage tunnel is
recommended using a partial face TBM.
During construction below the areas of boreholes 219, 181 and 227, excavation can continue with
1.5 m rock bolts placed every 3-4 m in unshotcreted areas. No extra reinforcement is need in these
areas considering the quality of the mass and the diameter of the tunnel.
As the excavation passes 300m from the entrance at borehole 219, the rock bolts installed should be
increased to a spacing of every 1.3m for extra reinforcement in the more unstable areas.
At 500m from the entrance at borehole 219, reinforcement should be increased again to systemic
rock bolting every 1m with extra support from 5 cm of shotcrete over the crown and walls. This
method should be continued until construction has finished below borehole 214.
After placing reinforcement after excavation, the sewage tunnel lining may be installed for speedy
construction of the sewage facility.
The method of construction we have recommended is much on the conservative side and is seen as
safe without dramatically increasing cost. A conservative construction method has been
recommended due to the undulating quality of the mass through which the tunnel is to be
constructed.
References
Effect of Weathering on Strength and Modulus of Basalt and Siltstone. (2008). ARMA, 08(207), 1-8.
Northern Interception Sewer Borehole Image Processing System Final Report (April, 2006), Sinclair
Kinght Merz PTY LTD. Boreholes: NDS-P3-214, NDS-P3-220, NDS-P3-181 NDS-P3-219 NDS-P3-214.
NSP Stage 2 (NIS) Borehole Data (April, 2006), SKM, Borhole No. NDS-P3-214, NDS-P3-220, NDS-P3-
227, NDS-P3-181, NDS-P3-219.
NSP Stage 2 (NIS) Geotechnical Lab Data (April, 2006), SKM, Borhole No. NDS-P3-214, NDS-P3-220,
NDS-P3-227, NDS-P3-181, NDS-P3-219.
NSP Stage 2 (NIS) Geotechnical Lab Data (April, 2006), SKM, Borhole No. NDS-P3-214, NDS-P3-220,
NDS-P3-227, NDS-P3-181, NDS-P3-219.
NSP Stage 2 (NIS) Core Photographs (April, 2006), SKM, Borhole No. NDS-P3-214, NDS-P3-220, NDS-
P3-181, NDS-P3-219.
Rock Mass Classification (2000), E. Hoek, Rocscience. 1-23.
https://www.rocscience.com/hoek/corner/3_Rock_mass_classification.pdf
Rock mass properties for underground mines (2001) E. Hoek, Underground Mining Methods:
Engineering Fundamentals and International Case Studies. 10-15
https://rocscience.com/hoek/references/H2001d.pdf
Appendix A
Longitudinal Section Plan
Appendix B
Rock Mass Rating System (After Bieniawski 1989).
Appendix C
Classification of individual parameters used in the Tunnelling Quality
Index Q (After Barton et al 1974).
Tunnel Project

Tunnel Project

  • 1.
  • 2.
    Contents Summary................................................................................................. Error! Bookmarknot defined. 1. Project Background....................................................................................................................... 2 2. Scope ............................................................................................................................................ 2 3. Introduction.................................................................................................................................. 3 3.1 SKM Borehole Logs ............................................................................................................... 3 3.2 Reservoir Tunnel Section....................................................................................................... 3 3.3 Basalt Weathering................................................................................................................. 4 4. Rock Mass Classification ............................................................................................................... 5 4.1 Rock Mass Rating .................................................................................................................. 5 4.1.1 Strength of Intact Rock.................................................................................................. 5 4.1.2 Rock Quality Designation (RQD)........................................................................................... 5 4.1.3 Spacing of Discontinuities .................................................................................................... 6 4.1.4 Condition of Discontinuities................................................................................................. 6 4.1.5 Groundwater........................................................................................................................ 6 4.2 Q System............................................................................................................................... 6 4.2.1 (𝑅𝑄𝐷𝐽𝑛) ........................................................................................................................ 7 4.2.2 𝐽𝑟𝐽𝑎 ............................................................................................................................... 7 4.2.3 (𝐽𝑤𝑆𝑅𝐹) ....................................................................................................................... 8 4.3 Rock Mass Parameters.......................................................................................................... 8 5. List of Tables ................................................................................................................................. 9 NDS – RMR Table of Values............................................................................................................... 0 NDS – Q System Table of Values ....................................................................................................... 0 NDS – Table of Rock Parameters....................................................................................................... 1 6. Application for Construction............................................................................................................. 0 6.1 Application of the RMR System.................................................................................................. 0 6.2 Applications of the Q System ...................................................................................................... 0 Appendix A............................................................................................................................................ 0 Longitudinal Section Plan.................................................................................................................. 0 Appendix B............................................................................................................................................ 0 Appendix C............................................................................................................................................ 1
  • 3.
    1. Project Background Theproposed Reservoir sewage tunnel will be the initial section of a sewage tunnel linking the Reservoir and Fawkner areas of Melbourne to the Northern Diversion Sewer. The sewage tunnel will create an effective sewage outlet for the two Melbourne suburbs and extended area. The proposed project will allow a significant increase in property development in the Melbourne area through creating a much more effective outlet for suburban sewage. Without the construction of the Reservoir sewage tunnel section, the suburban area around Reservoir would not be able to cope with the rapid population growth in Melbourne, this would hinder the economic and population capacity of Melbourne and the surrounding suburbs of Reservoir. This project will create the framework to accommodate the future projected population growth of the Reservoir area and consequently the expansion of Melbourne. 2. Scope The proposed sewage section of the Northern Sewer Project will span 700m, connecting the Reservoir area to the Northern Diversion Sewer. A range of borehole logs have been compiled to analyse the rock strata beneath Fawkner, in to which the sewage tunnel will be constructed. This report has been compiled based upon borehole information that was analysed to investigate the state of the rock mass into which the tunnel will be constructed. Through laboratory testing and geotechnical investigation, a clear interpretation of the structure and properties of the rock mass has been formed. A summary of the data and techniques used is included in this report. Our recommendations and discussion for the method of construction have based on our thorough investigation and understanding of the rock mass below Fawkner.
  • 4.
    3. Introduction 3.1 SKMBorehole Logs Before any strata analysis was able to take place, borehole logs were taken in the area of Fawkner and Reservoir. The boreholes were taken since there was insufficient data about the strata and rock mass in the area. These were taken in the name of the Northern Sewer Project by SKM. Five of the many boreholes taken were chosen for analysis for the Reservoir tunnel section since they were the best fit for the location, also providing sufficient data to analyse the rock strata in which the tunnel will be located. The Boreholes used in this report are NIS-P3-214, -220, -227, -181 and -219. The Longitudinal Geological section in Appendix A was formulated using the information from the boreholes mentioned. 3.2 Reservoir Tunnel Section The Fawkner sewage tunnel section is to be constructed over a 700 m stretch ranging from the coordinates 5825520m North; 322262m East to 5825949m North; 322814m East. The tunnel is to start from the location of NIS-P3-219 and finish at the location of NIS-P3-214, where the continuation of the Northern Sewer Project will continue. The Reservoir tunnel will be constructed with the invert at a level ranging from 55.8m AHD at NIS- P3-219 to 50.8m at NIS-P3-214. Flowing towards the South West, the tunnel dip at a ratio of 1:500m or at 0.1146 degrees. The Diameter of the tunnel proposed is 2.2m from invert to crown, which is more than adequate for the projected usage of Reservoir and Fawkner. As shown in Appendix A, there is a large mass of newer volcanic rock only a few metres below the top soil of the region. This newer volcanic mass spans down to a range of 30-45m below surface depending on your location, below which you will find Brighton GP and Silurian Siltstone. For the Reservoir tunnel section, the area of strata to be analysed will be 4.4m above the tunnel crown and 2.2m below the tunnel invert or effectively two of the tunnel’s diameter above and one diameter below the tunnel. Thus the tunnel will be constructed completely within the newer volcanic mass.
  • 5.
    3.3 Basalt Weathering Thenewer volcanic mass below Reservoir is made up of a finely crystalline basalt rock mass. Basalt flats were formed over a range of Melbourne valleys during the Tertiary period. The valleys of Melbourne were filled by basalt lava flows creating a porous vesicular layer of solid basalt once it cooled. Basalt, being quite a porous rock, allows water to flow through over time allowing weathering of the rock mass beneath the surface. The Borehole data shows a fluctuating water table situated around 7-8 m below the surface level. The rise and fall of the water table through the basalt increases the pressure inside the rock mass and has resulted in a wide range of weathering across the basalt flats. The uneven weathering across the basalt flats has created a weak and fractured mass in some parts of the basalt flats, whilst other areas have kept their strength. Through analysing borehole logs of the area, we will show the use of techniques such as; the RMR Rating system and the Q System to map out a global picture of the basalt rock mass below Reservoir.
  • 6.
    4. Rock MassClassification 4.1 Rock Mass Rating The rock mass rating system (RMR) was designed by Bieniawski, as part of the South African Council for Scientific and Industrial Research, between 1974 and 1976. The RMR system satisfied a need for a classification system to analyse rock masses around the world. The RMR system categorises a rock mass based on its overall in-situ features to easily gain an understanding on its strength and favourable features. The RMR system classifies a rock mass using the input of five rock mass parameters. Each of these parameters are given separate values in accordance to their favourability towards the strength and cohesion of the rock mass for excavation and construction. The five parameters of the RMR system are listed below.  Strength of Intact Rock Material  Rock Quality Designation (RQD)  Spacing of Discontinuities  Condition of Discontinuities  Groundwater The RMR system uses the sum of these five parameters’ values to systematically rate the rock mass on a scale of very poor to very good. The stability of a rock mass during excavation and construction is proportional to the sum of all five parameters in the RMR system, hence the system is widely accepted and used in the field of rock mechanics. Further adjustments are made to the RMR value depending on the dominant orientation of the discontinuities depending on their favourability in relation to the construction of the tunnel. The value system for the RMR tables below is situated in Appendix B. 4.1.1 Strength of Intact Rock The strength of intact rock material rating is based upon the value of the Uniaxial Compressive Strength (UCS) and the Point Load Index (PLI). Each of these are values given to a rock mass based on laboratory sample testing from borehole core samples. In the laboratory a Point Load Test is performed and the values of the PLI and UCS are formulated from the results. Laboratory tests were performed on each of the five boreholes used in the analysis of the rock mass. In this case only the UCS results were taken from the area of interest of each borehole, with the results shown in Table 1. Borehole ID Depth (m) UCS (MPa) NIS-P3-214 21.43 - 21.63 28.5 NIS-P3-220 23.68 - 23.95 45 NIS-P3-227 22.75 - 23.01 55 NIS-P3-181 23.71 - 24.76 93 NIS-P3-219 26.52 - 26.82 51 Table 1. Borehole UCS Lab Results. 4.1.2 Rock Quality Designation (RQD) The RQD rating was introduced by Deere in 1964. Originally developed to measure the percentage of intact rock pieces in a rock mass. Intact rock pieces being any rock piece lager than
  • 7.
    100mm, measured againstthe total length of the rock core or borehole. The RQD value gives an understanding of the percentage of quality intact rock, as well as the percentage of crushed rock inside area of interest. The RQD values have been taken from the NDS Borehole data from the five Boreholes mentioned above. These values are seen and interpreted in NDS – RMR Table of Values. 4.1.3 Spacing of Discontinuities The spacing of discontinuities inside a rock can affect its overall cohesion and shear strength. Discontinuities, created large by in-situ pressures, are the points of failure in tunnel construction disasters and the cohesion and shear strength of the discontinuities is affected by the spacing between each joint. Depending on the average spacing between the discontinuities, a value is given to rate the favourability in comparison to each of the other four RMR rock parameters. The values for the spacing of discontinuities were extracted from the Northern Interception Sewer Borehole Image Processing System Final Survey Report prepared by RAAX Australia. These values are seen and Interpreted in NDS – RMR Table of Values. 4.1.4 Condition of Discontinuities A RMR value is given to the condition of the discontinuities, accounting for their roughness, shape, continuity, separation and their filling material. The condition of the discontinuities themselves plays a large part in the stability of the tunnel during construction. The Condition of Discontinuities’ values were extracted from the Northern Interception Sewer Borehole Image Processing System Final Survey Report prepared by RAAX Australia. These values are seen and Interpreted in NDS – RMR Table of Values. 4.1.5 Groundwater The groundwater conditions within the rock mass were interpreted using the Moisture Content percentage determined during the laboratory testing that was performed on the core samples. The Moisture Content results from the lab tests are displayed below in Table 2. Borehole ID Depth (m) Moisture Content (%) NIS-P3-214 21.43 - 21.63 16.9 NIS-P3-220 23.68 - 23.95 2.75 NIS-P3-227 22.75 - 23.01 3.8 NIS-P3-181 27.22 - 27.54 2.9 NIS-P3-219 26.52 - 26.82 1.3 Table 2. Moisture Content Lab Results. Groundwater levels affect the in-situ pressure acting on the rock mass by forcing the rock to swell, this affects the deformation modulus and the overall cohesion of the rock mass. The groundwater levels and moisture content exponentially affect the values of the UCS, PLI and the deformation modulus; all of which are parameters that measure the strength of a rock mass. The moisture content percentage has been cross-referenced with the Northern Interception Sewer Borehole Image Processing System Final Survey Report prepared by RAAX Australia to decipher values for the groundwater RMR rating system. These values are seen and Interpreted in NDS – RMR Table of Values. 4.2 Q System The Q system was developed at the Norwegian Geotechnical Institute in 1974. Formulated by Barton et al. the Q system was derived to determine the structural support requirements for tunnel excavation in rock mass. Developed to be used with the RMR system, the Q system uses similar
  • 8.
    parameters though focusingmore on the joints of the mass. The Q system also boasts a unique reduction factor (SRF) to help decide on which construction measures are to be taken. The six parameters of the Q system are listed below.  Rock Quality Designation (RQD)  Jn – the number of joint sets  Jr – the joint roughness coefficient  Ja – a coefficient to describe the weathering and infill of the joints  Jw – a water pressure coefficient  SRF – the Q system reduction factor Each coefficient fits into the Q system equation which fits along a natural logarithmic scale. The Equation to the Q system is shown below. 𝑄 = ( 𝑅𝑄𝐷 𝐽𝑛 ) ∗ ( 𝐽𝑟 𝐽𝑎 ) ∗ ( 𝐽𝑤 𝑆𝑅𝐹 ) Through thoroughly examining the data presented in the SKM Borehole logs, the laboratory testing of borehole core samples and the Final Survey Report prepared by Raax; Q system values were calculated for the mass below Reservoir. The Q system uses the equation above to categorise the rock mass into a system ranging from extremely good to extremely poor. The tables used to calculate each quotient of the Q system tables below is situated in Appendix C. 4.2.1 ( 𝑅𝑄𝐷 𝐽𝑛 ) Each Quotient of the Q system defines a different quality of the rock mass. Similar to the RMR the first quotient, ( 𝑅𝑄𝐷 𝐽𝑛 ), describes the rock mass quality using the RQD system, though in the Q system the value of the RQD is reduced the coefficient describing the number of joints, Jn, throughout the area of interest. By taking into account the number joints affecting the RQD, it gives a crude numerical value rating the average block size throughout the rock mass. For the Q system, the RQD is taken as its numerical value and rounded to the nearest intervals of 5. The coefficient Ja is determined by cross referencing the number of sets of similar joints from the Northern Interception Sewer Borehole Image Processing System Final Survey Report prepared by RAAX against the Q system Ja classification table in Appendix C. 4.2.2 ( 𝐽𝑟 𝐽𝑎 ) The second quotient of the Q system equation defines a numerical value for the roughness and regularity of the joints affecting the rock mass, whilst reducing the value by analysing the weathering and infill of the joints in question. A value is given for the roughness coefficient, Jr, in favour of the cohesion of the rock mass since a rough and undulating discontinuity is desired. The value of Jr is then reduced by the coefficient Ja, which has a value describing the degree of weathering and infill of
  • 9.
    the discontinuities sinceweathering and infill reduces the cohesion between the intact rock pieces. The combined equation represents the shear strength between each block with a numerical value, hence representing the general cohesion of the mass as a whole. Both coefficients; Jr and Ja are derived through interpreting data from the Northern Interception Sewer Borehole Image Processing System Final Survey Report prepared by RAAX against the Q system classification table in Appendix C 4.2.3 ( 𝐽𝑤 𝑆𝑅𝐹 ) The last quotient of the Q system equation defines a numerical value for the negative effects of active water pressure acting on the rock mass, whilst further reducing the value with a reduction factor SRF. The coefficient Jw describes the reduction of both the effective normal stress acting upon the mass and shear stress between the joints, as water pressure builds up it relieves the rock mass of the in-situ stresses holding the mass together. The coefficient is further reduced by the reduction factor SRF, which describes three situations; (1) the loosening load through excavation into shear zones and clay bearing rock, (2) the rock stress in competent rock or (3) the confining loads in plastic incompetent rock. Together, the last quotient describes the active stress acting from inside the rock mass. The coefficient Jw is determined by calculating the water pressure by using the depth of the area of interest below the water level to calculate the unit weight of water pressure, from here you are able to cross reference the water pressure with a value from the Q system classification table in Appendix C. The reduction factor SRF is calculated by first deciding on which situation of (1), (2) or (3) best fits the area of interest, from here you can decide on a value for the reduction factor from the Q system classification table that best suits the situation. 4.3 Rock Mass Parameters Using the RMR classification, important rock mass parameters describing the state of the mass on a global level around each borehole can be derived. Using the RMR values and classification table in Appendix B we are able define the rock parameters describing the cohesion, angle of friction and the deformation modulus of the rock mass around each borehole. Each class has given values for each parameter, we are able to interpolate between the values to derive an approximation for each value. These values are shown below in NDS – Table of Rock Parameters. The cohesion of the rock mass describes the pressure, in KPa, to which the in-situ forces hold the mass together. Where the angle of friction describes the dominant angle at which these forces are acting on the rock mass. The deformation modulus describes the gradient at which the rock mass will act in a plastic manner and resist strain under passive or active stress. Although the values derived are only approximations since weathering and moisture content can have a large effect on these parameters of the rock mass.
  • 10.
    5. List ofTables NDS – RMR Table of Values NDS – Q System Table of Values NDS – Table of Rock Parameters
  • 11.
    NDS – RMRTable of Values Borehole ID NIS-P3-214 NIS-P3-220 NIS-P3-227 NIS-P3-181 NIS-P3-219 Condition Rating Condition Rating Condition Rating Condition Rating Condition Rating 1. Strength of Intact Rock UCS 28.5 MPa 2.3 UCS 45MPa 3.6 UCS 55MPa 4.5 UCS 93MPa 6.3 UCS 51MPa 4 2.RQD 92.50% 17.8 89.80% 17 Nil 86.10% 16.7 100% 20 3. Spacing of Joints ~150 mm 6.9 ~410mm 9 Nil >2m 20 ~500mm 13.75 4. Condition of Joints >5mm 0 >5mm 0 Nil Rough <1mm 20 Rough <1mm 20 5. Groundwater Flowing 2 Damp 10 Damp 10 Damp 10 Damp 12 6. Adjustment for Structural Fair -5 Fair -5 Fair -5 Fair -5 Fair -5 RMR Rating Value 24 34.6 Nil 68 64.75 RMR Class Poor Poor Nil Good Good Table 3. NDS – RMR Rating NDS – Q System Table of Values Borehole ID NIS-P3-214 NIS-P3-220 NIS-P3-227 NIS-P3-181 NIS-P3-219 Condition Rating Condition Rating Condition Rating Condition Rating Condition Rating ESR 1. RQD 92.50% 95 89.8 90 Nil 86.1 85 100 100 2. Jn 3J's + R 12 2J's 4 Nil Few J's 1 2J's 4 3. Jr R. Planar 1.2 R. Planar 1.3 Nil R.Planar 1.5 S. Und. 2.3 4. Ja Clay F'lld 3 Clay F'lld 3 Nil Tight 0.75 Tight 0.9 5. Jw Large Inflow 0.5 Minor Inflow 1 Nil Minor Inflow 1 Med. Inflow 0.66 6. SRF Single/Clay 5 Single/Clay 5 Nil Med. Stress 1 Med. Stress 1 Q 0.32 1.95 Nil 170 42.2 Q-Rating V.Poor Poor Nil E. Good Good Table 4. Q System Table
  • 12.
    NDS – Tableof Rock Parameters Borehole ID NIS-P3-214 NIS-P3- 220 NIS-P3-227 NIS-P3- 181 NIS-P3-219 RMR Rating 24 34.6 Nil 68 64.75 Description Poor Poor Nil Good Good Cohesion of rock mass (Kpa) 0.12 0.17 Nil 0.44 0.42 Angle of friction 17° 22° Nil 44° 42° Deformation Modulus (Gpa) 2.6 4.6 Nil 33.2 27 Table 5. NDS – Table of Rock Parameters
  • 13.
    6. Application forConstruction 6.1 Application of the RMR System The RMR class calculated in NDS – RMR Table of Values is therefore cross referenced against the Guidelines for excavation and support of 10 m span rock tunnels in accordance with the RMR system (After Bieniawski 1989) shown in Table 3. below. Referencing the table below we are able to recommend a construction method for the tunnel, borehole by borehole. It should be taken into account that no changes have been made to this table since 1973. Therefore this table should only be used to recommend a construction method and all support details should be recommended using the Q system table in 6.2. Table 6. Guidelines for excavation and support of 10 m span rock tunnels in accordance with the RMR system (After Bieniawski 1989). 6.2 Applications of the Q System Using their experience and mathematic knowledge, a tunnel support table was formulated by Grimstad and Barton in 1993 (the table was then reviewed and reproduced by Palmstrom and Broch in b2006). This tunnelling support table was designed to work alongside the Q system, utilizing the values produced and putting them toward a practical excavation use. The Q system values can be cross referenced against a quotient, De, of the height of the tunnel excavation divided by the excavation support ratio, (𝐻𝑒𝑖𝑔ℎ𝑡/𝐸𝑆𝑅). The ESR coefficient was designed by Barton et al. and was given values depending on the scale of excavation taking place. The ESR for water treatment plants and support tunnels is given a value of 1.3. Thus De takes the value of; 𝐻𝑒𝑖𝑔ℎ𝑡 𝐸𝑆𝑅 = 2.2 1.3 = 1.7 Using the ESR and Q system value, we can cross-reference these values in the table below containing estimated support categories based on the tunnelling quality index of Q.
  • 14.
    Table7. Estimated supportcategories based on the tunnelling quality index Q (After Grimstad and Barton, 1993, reproduced from Palmstrom and Broch, 2006). By cross-referencing our values against the table above, we are able to give close estimates to the best tunnel support method for excavation and longevity of the tunnel.
  • 15.
    7. Discussion The BasaltRock Mass on a global scale, runs from a slightly weathered mass at boreholes 219 and 181 and as construction moves further through the mass the rock will show larger signs of weathering and fracturing. The Basalt mass shows quite strong signs of weathering between boreholes 214 and 220. This seems to be due to ground water flow streams through the mass creating open weathered fractures and allowing smooth, unstable clay coatings to form inside. The rock mass around the area of borehole 214 is heavily fractured and shows large clay filled discontinuities running through the area of interest. The stability of the rock mass around such weathering is highly affected, shown by the cohesion of rock mass at borehole 214 dropping to almost a quarter of that at boreholes 181 and 219. The condition of the mass around borehole 214 is something to be wary of during construction, diligence in the reinforcement and construction methods is needed. The severe weathering of the mass continues from borehole 214 all the way passed the area of borehole 220. Although the mass improves slightly in both the RMR and Q class systems, the mass around 220 still shown a large amount of fractures and unstable clay filled discontinuities which intersect the area of interest in the mass. Although the general condition of the mass improves slightly from borehole 214, the area of borehole 220 is still classed as poor in both systems. With the amount of fractures and clay filled discontinuities shown throughout the area of interest the mass may be unstable and may require reinforcement during construction to avoid disaster. Although there is minimal information that can be interpreted about borehole 227, with increase in Uniaxial Compressive Strength and decrease in Water Content Percentage we can assume that the rock would be similar to that of borehole 219. With the strongest and most cohesive area of the mass situated around borehole 181; we can safely assume that, as the mass continues from the area of borehole 220 towards that of 181, the rock mass quality and stability will increase at a close to linear rate. Taking a conservative estimate, we can assume that the mass around borehole 227 would fit along the low end of the fair rating in both the Q system and RMR system. The area of interest around borehole 181 is quite a stable part of the mass. Only containing four discontinuities and no major seams, this area of the mass is the most competent area of the area of interest. This area will give minimal trouble to the construction of the sewage tunnel. As the area of interest continues towards the final borehole, 219, the mass begins to show a few of stronger in-situ forces acting on the area of rock mass but no signs of strong weathering. Through the area of interest around borehole 219 contains only two main sets of joints with several discontinuities in each set. Whilst the majority of the joints lie open, the majority have rough walls and take an undulating form, these qualities will help stabilise the mass and boost the overall cohesion of the area along the lines of discontinuity. The mass as a whole shows signs of increased weathering moving from right to left along the geological section. With the deformation modulus dropping dramatically towards the boreholes further left of the section, the movement and pressure of tunnel construction could create further fractures and weakness in this area of the mass. Extra reinforcement should be added as construction nears borehole 220 and should continue until construction ends.
  • 16.
    8. Recommendations On aglobal level the condition of the rock mass has many areas of poor mass and a conservative method of construction should be used. On the basis of the RMR and Q system outputs around the boreholes 214 and 220, a top heading and bench method of construction for the sewage tunnel is recommended using a partial face TBM. During construction below the areas of boreholes 219, 181 and 227, excavation can continue with 1.5 m rock bolts placed every 3-4 m in unshotcreted areas. No extra reinforcement is need in these areas considering the quality of the mass and the diameter of the tunnel. As the excavation passes 300m from the entrance at borehole 219, the rock bolts installed should be increased to a spacing of every 1.3m for extra reinforcement in the more unstable areas. At 500m from the entrance at borehole 219, reinforcement should be increased again to systemic rock bolting every 1m with extra support from 5 cm of shotcrete over the crown and walls. This method should be continued until construction has finished below borehole 214. After placing reinforcement after excavation, the sewage tunnel lining may be installed for speedy construction of the sewage facility. The method of construction we have recommended is much on the conservative side and is seen as safe without dramatically increasing cost. A conservative construction method has been recommended due to the undulating quality of the mass through which the tunnel is to be constructed.
  • 17.
    References Effect of Weatheringon Strength and Modulus of Basalt and Siltstone. (2008). ARMA, 08(207), 1-8. Northern Interception Sewer Borehole Image Processing System Final Report (April, 2006), Sinclair Kinght Merz PTY LTD. Boreholes: NDS-P3-214, NDS-P3-220, NDS-P3-181 NDS-P3-219 NDS-P3-214. NSP Stage 2 (NIS) Borehole Data (April, 2006), SKM, Borhole No. NDS-P3-214, NDS-P3-220, NDS-P3- 227, NDS-P3-181, NDS-P3-219. NSP Stage 2 (NIS) Geotechnical Lab Data (April, 2006), SKM, Borhole No. NDS-P3-214, NDS-P3-220, NDS-P3-227, NDS-P3-181, NDS-P3-219. NSP Stage 2 (NIS) Geotechnical Lab Data (April, 2006), SKM, Borhole No. NDS-P3-214, NDS-P3-220, NDS-P3-227, NDS-P3-181, NDS-P3-219. NSP Stage 2 (NIS) Core Photographs (April, 2006), SKM, Borhole No. NDS-P3-214, NDS-P3-220, NDS- P3-181, NDS-P3-219. Rock Mass Classification (2000), E. Hoek, Rocscience. 1-23. https://www.rocscience.com/hoek/corner/3_Rock_mass_classification.pdf Rock mass properties for underground mines (2001) E. Hoek, Underground Mining Methods: Engineering Fundamentals and International Case Studies. 10-15 https://rocscience.com/hoek/references/H2001d.pdf
  • 18.
  • 19.
    Appendix B Rock MassRating System (After Bieniawski 1989).
  • 20.
    Appendix C Classification ofindividual parameters used in the Tunnelling Quality Index Q (After Barton et al 1974).