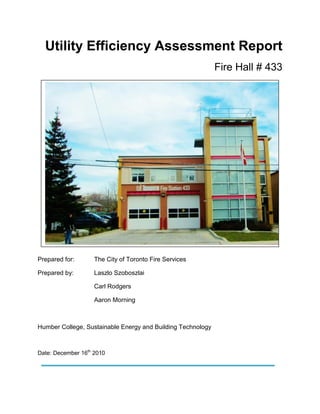
1. Utility Efficiency Assessment Report
Fire Hall # 433
Prepared for
Prepared for: The City of Toronto Fire Services
Prepared by: Laszlo Szoboszlai
Carl Rodgers
Aaron Morning
Humber College, Sustainable Energy and Building Technology
Date: December 16th
2010
3. Utility Efficiency Assessment Report
Table of Contents
Fire Hall #
City of Toronto Fire Services Page 3
Contents
1. Executive Summary...........................................................................................................................5
2. Building Description and Systems...................................................................................................6
2.1 Site................................................................................................................................................6
2.1.1 Exterior.................................................................................................................................7
2.1.2 Elevations ............................................................................................................................8
2.1.3 Sections ...............................................................................................................................8
2.1.4 Floor Plans ........................................................................................................................10
2.2 Envelope....................................................................................................................................11
2.3 Mechanical ................................................................................................................................12
2.4 Electrical ....................................................................................................................................14
2.5 Water..........................................................................................................................................15
3. Energy Analysis................................................................................................................................16
3.1 Utility...........................................................................................................................................16
3.1.1 Electricity ...........................................................................................................................17
3.1.2 Natural Gas .......................................................................................................................18
3.1.3 Water..................................................................................................................................19
3.1.4 End Use .............................................................................................................................20
3.1.5 Energy Intensity................................................................................................................21
4. Energy Model – EE4........................................................................................................................23
4.1 Introduction................................................................................................................................23
4.2 Results .......................................................................................................................................26
5. Utility Conservation Measures........................................................................................................28
5.1 Site..............................................................................................................................................28
5.2 Envelope....................................................................................................................................28
5.3 Mechanical ................................................................................................................................29
5.4 Electrical ....................................................................................................................................29
5.5 Water..........................................................................................................................................30
5.6 Summary of Utility Conservation Measures.........................................................................30
6. Financial Incentives .........................................................................................................................31
7. Conclusions and Recommendations.............................................................................................33
4. Utility Efficiency Assessment Report
Table of Contents
Fire Hall #
City of Toronto Fire Services Page 4
This page is left blank.
5. Utility Efficiency Assessment Report
Executive Summary
Fire Hall #
City of Toronto Fire Services Page 5
1. Executive Summary
This report aims to fully outline and provide utility conservation measures for fire hall
433 in Toronto, Ontario, located on 615 Royal York Road. The fire hall was built in 1953
and went through a renovation in 2004. This renovation gutted the walls, increased
insulation and added a new 3-storey tower addition to the building. The present status
of the building envelope is outlined providing site, exterior, elevations, sections, floor
plan, building envelope, mechanical, electrical and water run downs of the building.
A utility analysis is done to compare utility usage and outline trends or anomalies
during the fire halls recorded operating time. These figures including the building
envelope is then inputted into an energy modelling software called EE4 released by
NRCan (Natural Resources Canada). This software aims to help designers model
buildings to be 25 percent more efficient than the MNECB reference building. The
model results indicated what the utility analysis showed, that the building uses far too
much electricity.
These findings led to recommended utility conservation measures. It was suggested
that the fire hall install a permeable driveway, utilize and add additional operable
windows, add a low-e coating on existing windows, install a Heating Recovery Ventilator
(HRV), a Building Automation System (BAS) and decrease lighting load by adding
controls and reducing ballast counts. To reduce the water usage of the fire hall it was
suggested that low flow fixtures and reheat coils be installed and a grey water recovery
system to be implemented.
Most of these measures yielded on average a 5-10 year payback period, which may
not be attractive to businesses, but to a city municipal government with ownership of a
large aging building stock, it makes economic sense. To help offset costs and reach
these payback period values a collection of rebate and incentive programs were
considered such as the EcoEnergy Retrofit program offered by NRCan and the Better
Buildings Partnership offered by the City of Toronto.
Finally, further usage recommendations were made to the fire men, the occupants of
the building. These included simple usage and consumption strategies that would help
curb the high utility costs, create for a more comfortable living space and at the end of
the day reduce the impact on the environment.
6. Utility Efficiency Assessment Report
Building Description and Systems
Fire Hall #
City of Toronto Fire Services Page 6
2. Building Description and Systems
The fire hall was first built in 1953. After this date there was one extension built,
and a full retrofit with a new tower added in 2004. The building is 5,000 square feet.
Figure 1: Before Retrofit
Figure 2: After Retrofit
2.1 Site
The building is located just west of Toronto on Royal York and Queensway. The
facility has 6 individual paved parking spots on site. Two paved driveways for the
garages, a back-up power system, storage shed and a paved basketball surface on site
as well. There are plenty of obstructing trees as well as adjacent buildings on the south
and east. The main entrance to the facility is on the west elevation of the building. Site
includes landscaped areas connected to the adjacent west and south paved city
sidewalks. All areas surrounding the building are visible and easily accessible. The total
footprint of the building takes up 75-80% of the total area of the site. All drainage is
directed towards the south of the building into the city drainage system.
7. Utility Efficiency Assessment Report
Building Description and Systems
Fire Hall #
City of Toronto Fire Services Page 7
The site includes relative shading from nearby trees and buildings but no solar
analysis was conducted for the building roofs. It is important to note that the levels for
the buildings are at different heights which give the roofs a varied amount of shading as
well.
Figure 3: Fire hall 433 Site
2.1.1 Exterior
The majority of the exterior of the building is made from stucco following a 2004
renovation; this is present mainly on the north elevation as part of the old building. The
expanded series of the building is extended towards the south and is covered with brick
veneer to match the adjacent buildings present nearby. The exterior cladding here is
purely veneer based and are not accounted as structural components to the building.
The exterior of the building is all relatively new in the building, besides the stucco
and brick veneer the buildings have mainly new windows and roof to floor glazing in the
new building. The glazing in both buildings is double pane with no Low-E coating. This
contributes much of the overheating experienced in the summer in the relative small
spaces it covers.
8. Utility Efficiency Assessment Report
Building Description and Systems
Fire Hall #
City of Toronto Fire Services Page 8
2.1.2 Elevations
Elevations of the building do not differ vastly from each other; the structure of the
building resembles a rectangular footprint with flat roofs. The expansion section of the
building is extended into an extra third floor while the rest of the building only goes as
high as the second floor. The displacements between the levels of the old and new
buildings are present partly because the higher garage ceilings are required to fit a fire
truck. The majority of the glazing is present on the west elevation of the building. Due to
the adjacent building on the south elevation the new building has no glazing present on
this elevation making it the only one missing windows.
Figure 4: West Elevation
2.1.3 Sections
The sections between both the buildings indicate the change in complexity
between the new and old sections of the facility. Sections also identify the difference in
structure between the two as the old building uses most of the existing wooden beams
and Concrete Masonry Units while the new building uses a metal frame structure with
steel studs and tubular beams. The sections developed on Revit show the
interdependence of zones in with the new building identifying a key flaw in the HVAC
design. This is further investigated and discussed in the utility conservation measures
section of the report.
9. Utility Efficiency Assessment Report
Building Description and Systems
Fire Hall #
City of Toronto Fire Services Page 9
Figure 5: West Section (Old Building)
The sections in these buildings are quite complex but are mainly different from
one another. In the old building the levels go from the first floor to the top of the garage
to the roof with a total of two floors. In the newer buildings the levels don’t include the
added height needed for the garages and therefore end shorter than the roof of the old
building. The expansion section stretches this second floor all the way to the roof of the
old building giving it a much higher ceiling which is used to house the staircase and
gym. The new building also extends into a complete higher floor giving it a total of three
storeys.
Figure 6: Wireframe Section (New Building)
10. Utility Efficiency Assessment Report
Building Description and Systems
Fire Hall #
City of Toronto Fire Services Page 10
2.1.4 Floor Plans
As discussed the levels between the buildings are not the same making the floor
plans for the buildings much more complicated. The first floor of the building has a very
small footprint in terms of the total amount of conditioned space being used which
predominately includes the equipment room, office, washroom and hallway. The
majority of the first floor is used up as the garage space that houses two trucks. The first
floor also houses the main electrical room which is accessible from the outside for
maintenance purposes.
Figure 7: First Floor Plan
The second floor houses the majority of the living quarters that includes two
washrooms with attached bath and shower, kitchen, sleeping quarters and main living
room. The new building adjacent to this level houses a gym and staircase leading to the
third and last floor. This floor has the smallest footprint out of all three floors and mainly
made up the house tower room and another two desk office.
Figure 8: Second Floor Plan
11. Utility Efficiency Assessment Report
Building Description and Systems
Fire Hall #
City of Toronto Fire Services Page 11
The density of rooms between both the buildings is very different. The new
building is part of the expansion the fire hall. There was a need for many more room
types and functions and this was compensated for by the higher concentration of small
rooms that mainly include bedrooms, offices/work spaces and the gym.
Figure 9: Density of Spaces in Tower Extension
2.2 Envelope
As discussed earlier the envelope of the building differs from the old and new
buildings. The wall thickness in the old building is 15” while the thickness in the new
building is only 8” inches. The older envelope although going through renovation in
2004 still uses the main concrete masonry unit it originally did before. This structural
component added with the new rigid board insulation, framing and stucco give the wall
its width. The overall envelope of both the buildings are about only 6 years old and
received major renovation by gutting all the existing walls and adding new insulation.
12. Utility Efficiency Assessment Report
Building Description and Systems
Fire Hall #
City of Toronto Fire Services Page 12
Figure 10: Makeup of Old Wall
This is a key consideration during the site visits and analysis. The walls shouldn’t
be retrofitted as part of the report’s recommendations because they are very new. The
envelope of the new building is mainly composed of a steel structure (beams and studs)
with rigid board insulation and brick veneer.
2.3 Mechanical
The building has an abundance of mechanical systems serving the spaces.
Heating is supplied by three rooftop packaged units, 2 natural gas fired furnaces and
electric radiators. During our analysis we found that the electric radiators provide a lot of
the needed heating during the winter months. Cooling is served by the 3 rooftop units
and a standalone air conditioner in the control office.
The three rooftop units are as follows:
50, 000 BTUH
Heating Output 11.7KW
Cooling Output 8.6 KW
80 % Efficiency
13. Utility Efficiency Assessment Report
Building Description and Systems
Fire Hall #
City of Toronto Fire Services Page 13
90, 000 BTUH
Heating Output 21.1KW
Cooling Output 8.6KW
80% Efficiency
120, 000 BTUH
Heating Output 29.3 KW
Cooling Output 8.6 KW
80% Efficiency
All of these units are Lennox models.
The 2 natural gas fired forced air furnaces are also Lennox models. One furnace
supplies heating exclusively to the hose tower for the function of drying the hose and
the other supplies heating to the first floor storage rooms, dressing rooms and control
office. The models are of the Elite Series brand and have a model number of G51MP-
24B-045. This model is rated at the following specifications:
Heating Input 44,000 Btuh
Heating Output 41,000 Btuh
92.1 AFUE
Multiple electric radiators serve each zone as well. It was found that these were
left on during the heating season, and much of the required heating is delivered by
these radiators.
Another Infrared radiator is found in the garage to heat the trucks.
Figure 11: Infrared truck bay radiator
14. Utility Efficiency Assessment Report
Building Description and Systems
Fire Hall #
City of Toronto Fire Services Page 14
2.4 Electrical
Much of the electrical requirements of the building go to the lighting load of the building
and as previously mentioned, the electric radiators for heating.
Most lighting in the building is supplied by fluorescent and incandescent lights. While
surveying the building it was clear there was far too much lighting in the building.
The lighting breakdown of the building is as follows:
Fluorescent T8:
Ballast Count: 144
Power Rating: 32W
Control: None
Incandescent:
Fixture Count: 60
Power Rating: 100W
Control: Some dimming
There were 3 CFLs installed.
Air Conditioning is also supplied by electricity. The appliances in the building
included 2 stoves, 3 toaster ovens, 2 refrigerators, 3 toasters and 4 televisions. Other
electric loads include 3 desktop computers, humidifiers and central vacuum systems.
None of these loads were Energy Star compliant.
Later on in our Utility Analysis it will be clear that electricity is the biggest load on
the building. This is partly due to the air conditioning needs of the fire hall and the
heating supplied by the electric radiators. The excess lighting load also puts a demand
on the electricity usage of the building.
15. Utility Efficiency Assessment Report
Building Description and Systems
Fire Hall #
City of Toronto Fire Services Page 15
2.5 Water
The building uses regular flow water fixtures. There are 4 bathrooms in total. Of these 4
bathrooms, 3 have showers. The kitchen also uses a standard flow faucet. Water usage
peaks when the trucks are washed. This truck washing is done daily as part of the
firemen’s routine. We learned this while talking to the firemen. The source of water is
the City of Toronto’s municipal water source.
The domestic hot water is heated by a Rheem natural gas fired boiler. The model has a
listed input rate of 150,000 BTUH and a thermal efficiency of 80%. The tank holds
295.2L of water.
Figure 12: Natural Gas Fired Boiler
16. Utility Efficiency Assessment Report
Energy Analysis
Fire Hall #
City of Toronto Fire Services Page 16
3. Energy Analysis
3.1 Utility
A large factor contributing to having an energy audit completed is the utility use, or
more so how energy conservation measures can be applied to the utilities to reduce use
and waste. To better understand the patterns of consumption, we as a group analyzed
the electricity consumption and demand, natural gas use, and water consumption. With
the following graphs we will be able to highlight trends and seek ways to conserve.
In 2007 there was only data for May through December, but it seemed
concurrent around twenty-seven to thirty-one KW. There was a little spike between July,
August and September which was likely the air conditioning units.
Throughout 2008 it seems as though the demand is around thirty-two KW and on
every alternate month it is around twenty-six KW. This is extremely odd due to the fact
that June and August are lower that they should be. This could be a result of weather
patterns or the patterns of the fire fighters.
Flowing into 2009 the pattern seemed to continue until September where it
spiked, and no data was available in October and November. This could have been the
result of a credit that was applied to the bill in September.
0.0
5.0
10.0
15.0
20.0
25.0
30.0
35.0
40.0
45.0
May
Jul
Sept
Nov
Jan
Mar
May
Jul
Sept
Nov
Jan
Mar
May
Jul
Sept
Nov
Jan
Mar
May
2008 2009 2010
KW
Month - Year
Billed Demand (kW)
Billed Demand…
17. Utility Efficiency Assessment Report
Energy Analysis
Fire Hall #
City of Toronto Fire Services Page 17
There was only half the data available for 2010, but all the demands are coming
in as lower numbers all remaining under 25 KW. July and August are usual increases in
the demand where the cooling system may be improved and it also rises similarly in the
cold months such as, January, February and March.
3.1.1 Electricity
Looking at the electricity consumption may be more relevant and useful to our
needs. The profile has remained the same for the data collected over the four years,
with one exception in 2009 where there was an assumed credit applied to the bill and it
is shown below in the green line where consumption is zero or less between August and
November. The only reason we could think that this would happen was through their
billing cycle and that they billed out a 119 day bill for that period because of possible
error on their behalf.
-4000
-2000
0
2000
4000
6000
8000
10000
12000
14000
16000
18000
Jan Feb Mar Apr May Jun Jul Aug Sept Oct Nov Dec
kWh
Yearly Electricity Consumption
2007
2008
2009
2010
18. Utility Efficiency Assessment Report
Energy Analysis
Fire Hall #
City of Toronto Fire Services Page 18
Weather conditions may play a role in the defining points between years, 2009
seems to be the year where it was most off, but on average the electricity consumption
trends are similar for all the years. There are noticeable spikes in December, January,
February and March when cooler weather comes in again helping define an area of
conservation. The summer months did not seem to be affected as much as the winter
months and it shows as 07-09 are very similar loads, while 2010 seems as low it is
going to follow. Having more data on 2010 would result in a better understanding if this
year will remain constantly lower than the others.
3.1.2 Natural Gas
Natural gas in the building is only used for heating and that is apparent when
looking at the gas consumption as it follows a U-shaped trend. The fire hall looks like it
starts to get some gas use in September and November it really picks up and begins to
fade off in April through to the end of May. This was very reliable as we did not have to
change their billing periods to incorporate it into our spreadsheet, because they were
already in one and two month periods. This meant that on a monthly basis it is assumed
to be more accurate.
In 2007 there are large spikes and lows when the heating season kicks in,
possibly related to the billing patterns transition from cooling to heating season. 2008
was the most uniform year and potentially the most efficient as they constantly used
less, aside from January. There was a large spike in April of 2009, most likely to do with
some sort of weather patterns, or human complications.
The building houses a few different types of HVAC systems, where some are at
the highest efficiencies, but the other systems may be changed to allow for conservation
of natural gas. Inputting other measures should hopefully already lessen the load and
potentially create a more uniform shape on the graph with fewer spikes.
19. Utility Efficiency Assessment Report
Energy Analysis
Fire Hall #
City of Toronto Fire Services Page 19
3.1.3 Water
Water patterns will be more difficult to come across as there are different shifts of
firefighters through different times of the day and the severity of their calls will also
affect the amount of time spent in the hall using sinks, toilets, showers, and washing the
trucks.
The first two years of 07 and 08 are defiantly higher on average and the use of
older appliances/products may have played a role or just the unawareness that was
around then. On a better note, for which ever reasons, 2009 was very constant and
much lower on average than the previous years. The lack of data involved with 2010
makes it hard to determine if it will follow patterns of 07/08 or those of 2009.
A retrofit on all plumbing fixtures, to install low-flow ones would eliminate a large
portion of the demand on the city of Toronto by this station, and will create new patterns
much lower than years before due to the fact that the new fixtures use much less.
0.000
500.000
1000.000
1500.000
2000.000
2500.000
3000.000
3500.000
4000.000
4500.000
Jan Feb Mar Apr May Jun Jul Aug Sept Oct Nov Dec
m3
Yearly Natural Gas Consumption
2007
2008
2009
2010
20. Utility Efficiency Assessment Report
Energy Analysis
Fire Hall #
City of Toronto Fire Services Page 20
Installing a cistern is another good conservation measure as it will make up for a
large portion of the water demand in the building. Many other fire stations have had
cisterns installed at a large capacity and under the assumption it rains once every few
weeks there should be next to no city water use.
Since our water was billed in four month periods we assumed the average usage
per day in between the specified periods they billed could be multiplied by the number
of days per month to achieve the proper usage per month; but that is based on every
day using an averaged amount, which may not be one-hundred percent true all the
time.
3.1.4 End Use
Electricity is our biggest concern in this building, it is the largest cost and most
frequently used. There are numerous amounts of conservation measures available to
reduce demand and consumption.
Natural gas is definitely used more carelessly than it should and certain
conservation measures will be put in place to alter the amount of natural gas used.
0.00
20.00
40.00
60.00
80.00
100.00
120.00
Jan Feb Mar Apr May Jun Jul Aug Sept Oct Nov Dec
m3
Yearly Water Consumption
2007
2008
2009
2010
21. Utility Efficiency Assessment Report
Energy Analysis
Fire Hall #
City of Toronto Fire Services Page 21
Water is a resource used too carelessly and harvesting it has great potential for
conservation and through all of these energy conservation measures we will see that
the costs of all these utilities go down on a monthly average as does the amount of
each utility’s consumption.
3.1.5 Energy Intensity
Our building’s EPI was 411 kWh/m2
/year and a EUI of 1.13 kWh/m2
.
With an Energy Performance Index value of roughly 400 kWh/m2
/year we found
ourselves compared to the majority of the other groups, performing the third worst. That
is not too much of a concern as there are many ways to improve the old building and
once updated it might even come a head of today’s standards.
In terms of our Energy Use Index, we calculated it to equal 1.13. This is higher
than most groups EUIs. The following chart and graphs show where our fire hall #433
stands compared to other groups.
60%
33%
7%
Utility End Use
Electricity Natural Gas Water
22. Utility Efficiency Assessment Report
Energy Analysis
Fire Hall #
City of Toronto Fire Services Page 22
Group # EPI EUI
3 292 0.8
4 406 1.11
5 560 1.23
6 289 0.79
7 411 1.13
8 304 0.83
9 404 1.1
10 358 0.982
0
100
200
300
400
500
600
3 4 5 6 7 8 9 10
EPI(kWh/m2/year)
Group Number
Group EPIs
3
4
5
6
7
8
9
10
0
0.2
0.4
0.6
0.8
1
1.2
1.4
3 4 5 6 7 8 9 10
EUI(kWh/m2)
Group Number
Group EUIs
3
4
5
6
7
8
9
10
23. Utility Efficiency Assessment Report
Energy Model – EE4
Fire Hall #
City of Toronto Fire Services Page 23
4. Energy Model – EE4
4.1 Introduction
For fire hall 433 we used EE4 to do our Energy Model analysis. This was chosen
because we wanted to see how well or how bad our building performs compared to the
reference building in EE4. EE4 is an energy modelling software that was developed by
NRCan (Natural Resources Canada) to help building designers meet at least 25 percent
more efficient buildings than the Model National Energy Code for Buildings (MNECB)
standards set in 1997.
We were curious to see what allocation of utilities is used to fulfill all of the
buildings required functions. EE4 lets you do this by giving you a breakdown of natural
gas and electricity end use after the model has been run.
To understand the energy model here is a basic breakdown of the inputs that we
entered in EE4 to achieve our model.
The image above shows the breakdown of our systems and our zones. We have
5 systems serving our building as described in the mechanical section. These consist of
the 3 rooftop units and the 2 furnaces. The electric radiators were modelled by selecting
electric zone reheat settings. There is no central plant serving the building other than
the natural gas fired boiler.
24. Utility Efficiency Assessment Report
Energy Model – EE4
Fire Hall #
City of Toronto Fire Services Page 24
The zones were chosen as they were designed on the building. We felt it was
appropriate to follow the current zoning of the building and not develop our own zones.
The building envelope was modelled to as close as possible accuracy based on
the existing building. We were unable to exactly verify the type of insulation in the walls,
so we made an assumption on this based on the wall structure and thickness. The
model entries of the walls of the building are found below:
This is the inputs for the fire hall’s old wall. As explained in the building description
section, the fire hall has two main types of walls, based on pre-renovation existing walls
retrofitted, and pro-renovation new walls.
The model entries of the new walls are found below:
25. Utility Efficiency Assessment Report
Energy Model – EE4
Fire Hall #
City of Toronto Fire Services Page 25
As can be seen, the new wall has a lower R-Value than the old wall. The old wall is
calculated at an R-Value of 5.6 and the new wall an R-Value of 4.0. This is because the
old wall has a greater thickness due to the later addition of rigid board insulation while
the new walls are thinner and made up of less layers.
The following model input outlines our roof assembly that is calculated to have an R-
value of 6.4:
26. Utility Efficiency Assessment Report
Energy Model – EE4
Fire Hall #
City of Toronto Fire Services Page 26
4.2 Results
After all of our inputs were finalized and checked we sized the building using the
EE4 sizing tool. This enabled us to input the proper airflows for each zone, and select
the appropriate heating outputs delivered by our system to meet the heating
requirements of each zone.
The results of our sizing calculations are as follows:
After the proper heating outputs and airflows were entered into the model, we
were ready to run the model. This calculation compares the proposed building which is
fire hall 433 to a reference building 25 percent more efficient than the MNECB
standards.
27. Utility Efficiency Assessment Report
Energy Model – EE4
Fire Hall #
City of Toronto Fire Services Page 27
The results calculated by the energy model did not surprise us. First of all, the
model calculated that our lighting load exceeds the requirements for our building as
shown below:
The energy utilities comparison was calculated as shown below:
These results also were not surprising. From these calculations it is clear to see that
our electrical load is very large. This result is already discussed in the previous utility
analysis section of this report.
The heating provided by the electric radiators, the cooling provided by the air
conditioner units and the lighting load of the building contribute to a large proportion of
the building’s energy use being electrical.
The rooftop units heating outputs do not provide enough heating to meet the
demands of the building, and therefore the building relies on using the electric radiators
during the heating season. In comparison to our Utility Analysis energy end use, it is
clear that electricity is the largest load.
28. Utility Efficiency Assessment Report
Utility Conservation Methods
Fire Hall #
City of Toronto Fire Services Page 28
5. Utility Conservation Measures
5.1 Site
The site that the fire hall occupies is surrounded by low density low rise
commercial and residential building. There is a park on the west side across the street.
The site has made significant improvements since the renovation. There was some
landscaping done to cover previously paved areas, and two trees were planted.
Replacing the current driveway with a permeable driveway will help divert some of
the water surface run off during outdoor truck washes and storms, from the municipal
sewer system. Although this does not count as a utility conservation measure, it does
help reduce the strain on the city’s water treatment plants, which use a lot of energy as
well.
No payback period can be calculated on this measure.
5.2 Envelope
The current building has an adequate amount of insulation. This was all added
after the 2004 retrofit of the building. There are however some improvements that can
be made on the overall building envelope.
Installing 6 new operable windows throughout the tower and rooms adjacent to the
tower will allow for the fire fighters to make use of the stack affect to passively cool the
building in times of proper wind patterns. The windows will not cost more than $6000
and with a $240 incentive it would be possible to shave the payback from 10-5 years.
Applying low-e coatings to the front of the windows will result in the windows
reflecting much more heat waves; especially in the new tower which suffers from
significant solar heat gain in the summer. This is a complaint voiced by the fire fighters
themselves and they also noted that the installed blinds do not help solve this problem.
At a cost of $3000 it is hard to determine how long it will take for the coatings to
return the payback, but it is expected that it will take 5-10 years before the coatings
breakeven.
29. Utility Efficiency Assessment Report
Utility Conservation Methods
Fire Hall #
City of Toronto Fire Services Page 29
5.3 Mechanical
Heat recovery ventilators can save up to 50% of the heat being rejected out the
exhaust of the building and it is a good idea to install them on even the most efficient
boilers and furnaces. At a low cost of $1800 there should be well over that earned back
in savings to make the payback come in less than a year. It all depends on the heating
season and how many days are cold enough that the inside heat transfers with the
incoming heat.
Our systems are large, unbalanced, and use more than they should. There are electric
baseboard heaters, infrared heaters, the natural gas packaged units and furnaces that
all work together, however in an inefficient way. A BAS could be installed so that
someone may monitor the building and run the various equipment efficiently. At a cost
of $38 000 we expect the controller to save a few hundred a month but have a payback
period in over 20 years. This makes the retrofit less feasible. Our little experience with
BAS makes it difficult to put actual numbers on the system, and only about 10% or less
can be expected to be saved.
5.4 Electrical
The lighting power density of our building is too great and reducing the ballast
count throughout the building would be one measure taken to reduce the lighting load.
We would currently need to install compact fluorescents throughout the building before
understanding how much energy the ballast removal will save at the end of the audit.
Finally to make the lighting system more efficient motion and day light censors
may be installed to monitor the lighting situation once the fire hall is empty, and after
installation it would be easier to monitor how much lighting there is.
The three steps should not take any longer than a few weeks and it would come
at a cost of $2100-$2500, but a $400 incentive would cut back the payback period to
2.5-5 years. It is hard to determine actual numbers for the pay back as the fire fighters
all act in a different way and would want certain ballasts removed over others, and
finally the motion/day sensors effectiveness are all dependant on the firefighters and
other occupancy schedules.
30. Utility Efficiency Assessment Report
Utility Conservation Methods
Fire Hall #
City of Toronto Fire Services Page 30
5.5 Water
The fire station must have low-flow fixtures installed throughout the building for a total
cost of $2500. We are hoping that this will cut the water usage by 66%; saving us
$1100/year with a $260 grant for the new toilets.
We do not want to stop there though; a 20 000 litre cistern may be installed over a week
at a cost of $15 000. This would help supply the toilets and truck washing hoses with
greywater and we expect it to save seventy five percent of the remaining two-thirds of
water demand; saving $2000 a month. This means that we will break even just after 7
years. As the water that is wasted returns back to the cistern or the city connection it
should pass through a reheat coil to help the water heater remain at a higher
temperature and use less natural gas throughout the year.
At a cost of $290 for installed service the water heater will be able to save $50/year and
would only take 6 years to break even.
5.6 Summary of Utility Conservation Measures
The following chart summarizes the utility conservation measures listed above:
ECM ECM Description Cost Savings Incentives
Estimated
Payback
Lighting Reduce Ballast Count/LPD $ - Dependant on how many reduced 0 years
Change to CFL's $ 100.00 Dependant on how many changed 1-2 years
Daylight/Motion Sensors $ 2,000.00 Dependant on schedule and use $ 400.00 1.5-3 years
Water Low Flow Fixtures $ 2,500.00 $ 1,100.00 $ 260.00 1.8 years
Rain Water Recovery $ 15,000.00 $ 2,000.00 7.1 years
Reheat Coil $ 290.00 $ 25.00 12 years
Mechanical HRV $ 1,800.00 $ 2,900.00 < 1 year
BAS $ 38,000.00 Dependant on controls 20+ years
Windows 6 New Operable $ 6,000.00 Dependant how often they are used $ 240.00 5-10 years
Low-e Coating $ 3,000.00 Dependant on amount of sun/year 5-10 years
31. Utility Efficiency Assessment Report
Financial Incentives
Fire Hall #
City of Toronto Fire Services Page 31
6. Financial Incentives
The federal government has offered the EcoEnergy Retrofit for homeowners and
commercial and institutional buildings for numerous years now. As of March 2011 this
incentive will end, however it is still possible to apply for this incentive. The Eco Energy
Retrofit offers the following incentives:
- Up to $10/GJ of saved energy
- 25% Initial cost (50,000 for retrofit >200,000)
The key requirements for being approved for this incentive are listed as:
The area of each building cannot exceed 20 000 square metres (215 279 square
feet).
You can include up to 10 buildings in a project.
Each building must be occupied for a similar purpose for at least 3 years.
You need to arrange a pre-project energy audit as described in the Application
Guide.
After NRCan has signed the Contribution Agreement, you will have a specified
amount of time to complete your project as indicated in clause 4.2 of the
contribution agreement. Please note that in order to be eligible for an incentive all
projects must be completed by March 31, 2011, even if a contribution agreement
has been signed by both NRCan and the company.
Do not start the project or incur any related costs until you receive written
approval from the OEE.
The Better Building Partnership also is a great portal for financial incentives and
collaborative programs to help increase the energy efficiency of Toronto’s building stock
and curtail emissions.
It helps building owners find the right jurisdiction in which their project fits into and
what sorts of assistance is available to them.
32. Utility Efficiency Assessment Report
Financial Incentives
Fire Hall #
City of Toronto Fire Services Page 32
In the case of the fire hall retrofit, the following incentive programs were found:
- The OPA Conservation Fund under the provincial government
- Energy Retrofit Program under the municipal government
- Water Buyback Program under the municipal government
- Sewer Surcharge Rebate Program under the municipal government
Additional listed retrofits listed under the NRCan website include:
- Every energy star window installed = $40/window
- Low flow toilets = $65X 4 toilets
- Audit cut in half = $ 150
The incentives and rebates were used in parts of our calculations to determine the
payback period of our energy conservation measures.
33. Utility Efficiency Assessment Report
Conclusions
Fire Hall #
City of Toronto Fire Services Page 33
7. Conclusions and Recommendations
Fire hall 433 is a newly renovated building. The renovations done in 2004
increased the efficiency of the building tenfold. For this very reason when it came to
providing energy efficient upgrades, it seemed like a lost cause at first. However,
after further analysis we found that the building was actually performing terribly;
even compared to other older fire halls. This was caused by a wealth of different
reasons as discussed throughout the report.
We found that the worst performing aspects of the building were the non-
synchronized, unbalanced mechanical systems. The second worst aspect of the
building was the large lighting load. After hearing fire men’s complaints, it was
obvious that the most uncomfortable part of the building was the new tower addition.
Due to high solar heat gain, high room density and little circulation of air, the area
was either too hot, too cold or too stale. Water conservation could also be increased
by installing low flow fixtures, to make up for the high traffic in the bathrooms.
We chose our ECM’s because they were the most obvious to us at the time of
the analysis. There are however multiple other things that can be done to make sure
the building performs better and the occupants are comfortable.
Most of these recommendations are based on changes in occupant building
usage and control. By making sure to not leave the bay doors open as often as they
are open, it will ensure less cooling or heating is wasted through this large opening.
Taking advantage of cross ventilation using the already present operable windows
will reduce cooling load during the mild days. Lighting is usually not necessary in
parts of the building where the curtain wall provides an excess of natural daylight
coming in to the spaces. Finally, washing the trucks less often and possibly
supplementing this with a different daily routine will help save large amounts of
water.
It is recommended that a follow up analysis is performed at that utility
conservation measures are looked at and applied where possible. The City of
Toronto has a lot of property under their ownership, and by making sure that its
building stock performs efficiently and effectively, not only will it reduce its energy
costs to run the building, but it will also be able to allocate these savings to serve
new services.