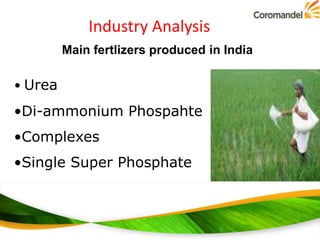
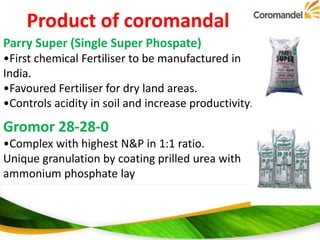
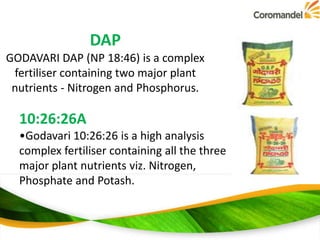
Presented by:
Karhale sunil.B
Roll No.: 80
Batch : 2013-15 PGDABM
Chairman

A Vellayan

Corporate office – Secunderabad , Andhra Pradesh
Establishment – 1961
Coromandel International Ltd. is among
the top fertilizer companies in India
manufacturing phosphate fertilizers, Crop
Protection products which includes
Insecticides, Fungicides, Plant Growth
Regulators and Herbicides and specialty
nutrients. the top 20 best companies to
work for by Business Today.
Industry Analysis
Main fertlizers produced in India

• Urea
•Di-ammonium Phospahte
•Complexes
•Single Super Phosphate
Industry Analysis
• 65 large-sized fertilizer plants in India
• 32 units-urea
• 20 units-DAP & complex fertilizers
• 13 units-ammonium phosphate & CAN

• Nitrogenous fertilizers-88% urea ,10%
DAP & 2% ammonium fertilizers.
Product of coromandal
Parry Super (Single Super Phospate)
•First chemical Fertiliser to be manufactured in
India.
•Favoured Fertiliser for dry land areas.
•Controls acidity in soil and increase productivity.

Gromor 28-28-0
•Complex with highest N&P in 1:1 ratio.
Unique granulation by coating prilled urea with
ammonium phosphate lay
DAP
GODAVARI DAP (NP 18:46) is a complex
fertiliser containing two major plant
nutrients - Nitrogen and Phosphorus.

10:26:26A
•Godavari 10:26:26 is a high analysis
complex fertiliser containing all the three
major plant nutrients viz. Nitrogen,
Phosphate and Potash.
12:32:16
Godavari 12:32:16 is a complex
fertiliser containing all three major
plant nutrients viz. Nitrogen,
Phosphate and Potash.
------------------ in Rs. Cr. ------------------Mar '13

Sources Of Funds
Total Share Capital
Equity Share Capital
Share Application Money
Preference Share Capital
Reserves

28.26
28.26
0.00
0.00

Mar '11

28.18
28.18
0.00
0.00

Mar '10

Mar '09

28.05
28.05
0.00
0.00

27.98
27.98
0.00
0.00

2,147.30 2,342.93 1,875.93 1,406.93 1,099.16

Revaluation Reserves
Networth

Mar '12

28.31
28.31
0.00
0.00

Particulars

0.00

0.00

0.00

0.00

0.00

2,175.61 2,371.19 1,904.11 1,434.98 1,127.14

Secured Loans

424.57

733.64

387.69

465.60

297.05

Unsecured Loans

1,815.01 1,683.90

Total Debt

2,239.58 2,417.54 1,369.76 1,819.73 1,627.00

Total Liabilities

4,415.19 4,788.73 3,273.87 3,254.71 2,754.14
12 mths

12 mths

12 mths

982.07 1,354.13 1,329.95

12 mths

12 mths
------------------ in Rs. Cr. ------------------1. Application Of Funds
1. Gross Block

1. 1,767.7 1. 1,397.3 1. 1,344.2 1. 1,299.6 1. 1,204.9
2
2
1
0
8

1. Less: Accum. Depreciation

1. 625.67 1. 590.22 1. 550.51 1. 495.56 1. 440.94

1. Net Block

1. 1,142.0
1. 807.10 1. 793.70 1. 804.04 1. 764.04
5

1. Capital Work in Progress

1. 27.94

1. Investments

1. 879.55 1. 627.94 1. 642.30

1. Inventories

1. Sundry Debtors

1. 163.52 1. 59.49

1. 13.28

1. 27.80

1. 1,071.0 1.
0
1. 1,264.8 1. 1,855.6 1. 1,513.1
1.
1. 926.42
9
1
2
1. 1,610.8
1. 887.02 1. 205.18 1. 142.71 1.
9

1,043.6
0
1,347.5
1

104.33

1. Cash and Bank Balance

1. 452.76 1. 413.81 1. 352.01 1. 89.51

1. 340.95

1. Total Current Assets

1. 3,328.5 1. 3,156.4 1. 2,070.3 1. 1,158.6 1. 1,792.7
4
4
1
4
9
------------------ in Rs. Cr. ------------------Loans and Advances

1,969.20 2,073.19 1,129.46

Fixed Deposits

0.00

Total CA, Loans & Advances

Deffered Credit

550.04

720.35

0.55

5,297.74 5,733.67 3,749.81 2,513.07 2,862.63

0.00

Current Liabilities

504.04

634.08 1,069.29

0.00

0.00

0.00

0.00

2,733.49 2,394.87 1,839.16 1,052.29 1,821.97

Provisions

198.60

148.63

132.27

94.39

121.96

Total CL & Provisions

2,932.09 2,543.50 1,971.43 1,146.68 1,943.93

Net Current Assets

2,365.65 3,190.17 1,778.38 1,366.39

Miscellaneous Expenses
Total Assets

0.00

0.00

0.00

0.00

918.70
0.00

4,415.19 4,788.73 3,273.87 3,254.71 2,754.14

Contingent Liabilities
Book Value (Rs)

441.50
76.86

418.98
83.92

Source : Dion Global Solutions Limited

555.83
67.56

321.18
102.30

376.11
80.57
Particulars

Mar '13

Income

Mar '12

Mar '11

Mar '10

Mar '09

------------------ in Rs. Cr. -------------------

Sales Turnover

8,665.52 9,838.88 7,670.85 6,500.53 9,585.58

Excise Duty

105.28

Net Sales

8,560.24 9,744.29 7,613.92 6,464.64 9,538.91

Other Income
Stock Adjustments

67.03
-129.18 34.71
-147.20 258.87 219.97

Total Income

8,480.07 9,873.98 7,868.60 6,396.43 9,962.06

12 mths

12 mths

12 mths

94.59

12 mths

56.93

35.89

46.67

85.47
117.81
-153.68 305.34

12 mths

Source : Dion Global Solutions Limited
Expenditure

------------------ in Rs. Cr. -------------------

Raw Materials

6,437.52 7,845.51 5,952.23 4,810.16 8,326.57

Power & Fuel Cost
Employee Cost

107.18
205.02

90.54
188.22

86.88
181.72

66.84
166.79

63.05
133.39

Other Manufacturing Expenses 20.09

18.37

50.08

35.96

37.14

Selling and Admin Expenses

0.00

506.53

485.17

424.56

301.80

Miscellaneous Expenses

908.72

151.26

59.20

78.06

158.21

Preoperative Exp Capitalised

0.00

0.00

0.00

0.00

0.00

Total Expenses

7,678.53 8,800.43 6,815.28 5,582.37 9,020.16

Source : Dion Global Solutions Limited
------------------ in Rs. Cr. -------------------

Operating Profit

734.51

1,202.73 1,018.61 728.59

824.09

PBDIT

801.54

1,073.55 1,053.32 814.06

941.90

Interest

176.67

116.51

84.22

75.37

84.72

PBDT

624.87

957.04

969.10

738.69

857.18

Depreciation

58.54

56.16

61.74

59.23

56.13

Other Written Off

0.00

0.00

0.00

0.00

0.00

Profit Before Tax

566.33

900.88

907.36

679.46

801.05

Extra-ordinary items

0.00

68.89

81.10

28.98

7.13

PBT (Post Extra-ord Items)

566.33

969.77

988.46

708.44

808.18

Tax

122.34

276.50

294.00

240.24

311.80

Source : Dion Global Solutions Limited
------------------ in Rs. Cr. -------------------

Reported Net Profit

443.99

693.27

694.46

468.20

496.38

Total Value Addition

1,241.01 954.92

863.05

772.21

693.59

Preference Dividend

0.00

0.00

0.00

0.00

0.00

Equity Dividend

127.45

197.78

197.30

140.26

139.90

Corporate Dividend Tax

21.66

32.08

32.44

23.62

23.78

Per share data (annualised)
Shares in issue (lakhs)

2,830.58 2,825.70 2,818.34 1,402.73 1,398.97

Earning Per Share (Rs)

15.69

24.53

24.64

33.38

35.48

Equity Dividend (%)

450.00

700.00

700.00

500.00

500.00

Book Value (Rs)

76.86

83.92

67.56

102.30

80.57

Source : Dion Global Solutions Limited
• Nutrient Based Subsidy (NBS) policy
introduced in April’10 has been received
well by
all stakeholders- farmers/Industry/Govt.
• Ensured timely availability of fertilizers
through out the year supplemented by
New Nutrient based Subsidy Policy
imports
• Subsidy reimbursement reasonably on time to
meet the liquidity ( delay in last
qtr. of FY 11)
• International prices were stable throughout the
yr.
• MRP revised to offset the cost increases
Through this term assignment, we have attempted to use the
understanding of environmental, industrial, situational,
organisational analysis to develop strategies for the
companies.
compare both companies with respect to their
strengths, weaknesses, opportunities and threats, and also
arrive at the business strategies.
Findings from this assignment on the fertilizers industry
using Coromandel Fertilizers Limited
The report has been prepared using data, inferences and
understanding from:

Ministry of Chemicals & Fertilizers - Department of
Fertilizers
Annual reports and business reports Coromandel
Fertilizers Limited
Fertilizer Association of India - Fertilizer Scenario
2012
Fertilizer industry

Fertilizer industry

  • 2.
    Presented by: Karhale sunil.B RollNo.: 80 Batch : 2013-15 PGDABM
  • 3.
    Chairman A Vellayan Corporate office– Secunderabad , Andhra Pradesh Establishment – 1961
  • 4.
    Coromandel International Ltd.is among the top fertilizer companies in India manufacturing phosphate fertilizers, Crop Protection products which includes Insecticides, Fungicides, Plant Growth Regulators and Herbicides and specialty nutrients. the top 20 best companies to work for by Business Today.
  • 5.
    Industry Analysis Main fertlizersproduced in India • Urea •Di-ammonium Phospahte •Complexes •Single Super Phosphate
  • 6.
    Industry Analysis • 65large-sized fertilizer plants in India • 32 units-urea • 20 units-DAP & complex fertilizers • 13 units-ammonium phosphate & CAN • Nitrogenous fertilizers-88% urea ,10% DAP & 2% ammonium fertilizers.
  • 7.
    Product of coromandal ParrySuper (Single Super Phospate) •First chemical Fertiliser to be manufactured in India. •Favoured Fertiliser for dry land areas. •Controls acidity in soil and increase productivity. Gromor 28-28-0 •Complex with highest N&P in 1:1 ratio. Unique granulation by coating prilled urea with ammonium phosphate lay
  • 8.
    DAP GODAVARI DAP (NP18:46) is a complex fertiliser containing two major plant nutrients - Nitrogen and Phosphorus. 10:26:26A •Godavari 10:26:26 is a high analysis complex fertiliser containing all the three major plant nutrients viz. Nitrogen, Phosphate and Potash.
  • 9.
    12:32:16 Godavari 12:32:16 isa complex fertiliser containing all three major plant nutrients viz. Nitrogen, Phosphate and Potash.
  • 10.
    ------------------ in Rs.Cr. ------------------Mar '13 Sources Of Funds Total Share Capital Equity Share Capital Share Application Money Preference Share Capital Reserves 28.26 28.26 0.00 0.00 Mar '11 28.18 28.18 0.00 0.00 Mar '10 Mar '09 28.05 28.05 0.00 0.00 27.98 27.98 0.00 0.00 2,147.30 2,342.93 1,875.93 1,406.93 1,099.16 Revaluation Reserves Networth Mar '12 28.31 28.31 0.00 0.00 Particulars 0.00 0.00 0.00 0.00 0.00 2,175.61 2,371.19 1,904.11 1,434.98 1,127.14 Secured Loans 424.57 733.64 387.69 465.60 297.05 Unsecured Loans 1,815.01 1,683.90 Total Debt 2,239.58 2,417.54 1,369.76 1,819.73 1,627.00 Total Liabilities 4,415.19 4,788.73 3,273.87 3,254.71 2,754.14 12 mths 12 mths 12 mths 982.07 1,354.13 1,329.95 12 mths 12 mths
  • 11.
    ------------------ in Rs.Cr. ------------------1. Application Of Funds 1. Gross Block 1. 1,767.7 1. 1,397.3 1. 1,344.2 1. 1,299.6 1. 1,204.9 2 2 1 0 8 1. Less: Accum. Depreciation 1. 625.67 1. 590.22 1. 550.51 1. 495.56 1. 440.94 1. Net Block 1. 1,142.0 1. 807.10 1. 793.70 1. 804.04 1. 764.04 5 1. Capital Work in Progress 1. 27.94 1. Investments 1. 879.55 1. 627.94 1. 642.30 1. Inventories 1. Sundry Debtors 1. 163.52 1. 59.49 1. 13.28 1. 27.80 1. 1,071.0 1. 0 1. 1,264.8 1. 1,855.6 1. 1,513.1 1. 1. 926.42 9 1 2 1. 1,610.8 1. 887.02 1. 205.18 1. 142.71 1. 9 1,043.6 0 1,347.5 1 104.33 1. Cash and Bank Balance 1. 452.76 1. 413.81 1. 352.01 1. 89.51 1. 340.95 1. Total Current Assets 1. 3,328.5 1. 3,156.4 1. 2,070.3 1. 1,158.6 1. 1,792.7 4 4 1 4 9
  • 12.
    ------------------ in Rs.Cr. ------------------Loans and Advances 1,969.20 2,073.19 1,129.46 Fixed Deposits 0.00 Total CA, Loans & Advances Deffered Credit 550.04 720.35 0.55 5,297.74 5,733.67 3,749.81 2,513.07 2,862.63 0.00 Current Liabilities 504.04 634.08 1,069.29 0.00 0.00 0.00 0.00 2,733.49 2,394.87 1,839.16 1,052.29 1,821.97 Provisions 198.60 148.63 132.27 94.39 121.96 Total CL & Provisions 2,932.09 2,543.50 1,971.43 1,146.68 1,943.93 Net Current Assets 2,365.65 3,190.17 1,778.38 1,366.39 Miscellaneous Expenses Total Assets 0.00 0.00 0.00 0.00 918.70 0.00 4,415.19 4,788.73 3,273.87 3,254.71 2,754.14 Contingent Liabilities Book Value (Rs) 441.50 76.86 418.98 83.92 Source : Dion Global Solutions Limited 555.83 67.56 321.18 102.30 376.11 80.57
  • 13.
    Particulars Mar '13 Income Mar '12 Mar'11 Mar '10 Mar '09 ------------------ in Rs. Cr. ------------------- Sales Turnover 8,665.52 9,838.88 7,670.85 6,500.53 9,585.58 Excise Duty 105.28 Net Sales 8,560.24 9,744.29 7,613.92 6,464.64 9,538.91 Other Income Stock Adjustments 67.03 -129.18 34.71 -147.20 258.87 219.97 Total Income 8,480.07 9,873.98 7,868.60 6,396.43 9,962.06 12 mths 12 mths 12 mths 94.59 12 mths 56.93 35.89 46.67 85.47 117.81 -153.68 305.34 12 mths Source : Dion Global Solutions Limited
  • 14.
    Expenditure ------------------ in Rs.Cr. ------------------- Raw Materials 6,437.52 7,845.51 5,952.23 4,810.16 8,326.57 Power & Fuel Cost Employee Cost 107.18 205.02 90.54 188.22 86.88 181.72 66.84 166.79 63.05 133.39 Other Manufacturing Expenses 20.09 18.37 50.08 35.96 37.14 Selling and Admin Expenses 0.00 506.53 485.17 424.56 301.80 Miscellaneous Expenses 908.72 151.26 59.20 78.06 158.21 Preoperative Exp Capitalised 0.00 0.00 0.00 0.00 0.00 Total Expenses 7,678.53 8,800.43 6,815.28 5,582.37 9,020.16 Source : Dion Global Solutions Limited
  • 15.
    ------------------ in Rs.Cr. ------------------- Operating Profit 734.51 1,202.73 1,018.61 728.59 824.09 PBDIT 801.54 1,073.55 1,053.32 814.06 941.90 Interest 176.67 116.51 84.22 75.37 84.72 PBDT 624.87 957.04 969.10 738.69 857.18 Depreciation 58.54 56.16 61.74 59.23 56.13 Other Written Off 0.00 0.00 0.00 0.00 0.00 Profit Before Tax 566.33 900.88 907.36 679.46 801.05 Extra-ordinary items 0.00 68.89 81.10 28.98 7.13 PBT (Post Extra-ord Items) 566.33 969.77 988.46 708.44 808.18 Tax 122.34 276.50 294.00 240.24 311.80 Source : Dion Global Solutions Limited
  • 16.
    ------------------ in Rs.Cr. ------------------- Reported Net Profit 443.99 693.27 694.46 468.20 496.38 Total Value Addition 1,241.01 954.92 863.05 772.21 693.59 Preference Dividend 0.00 0.00 0.00 0.00 0.00 Equity Dividend 127.45 197.78 197.30 140.26 139.90 Corporate Dividend Tax 21.66 32.08 32.44 23.62 23.78 Per share data (annualised) Shares in issue (lakhs) 2,830.58 2,825.70 2,818.34 1,402.73 1,398.97 Earning Per Share (Rs) 15.69 24.53 24.64 33.38 35.48 Equity Dividend (%) 450.00 700.00 700.00 500.00 500.00 Book Value (Rs) 76.86 83.92 67.56 102.30 80.57 Source : Dion Global Solutions Limited Source : Dion Global Solutions Limited
  • 17.
    • Nutrient BasedSubsidy (NBS) policy introduced in April’10 has been received well by all stakeholders- farmers/Industry/Govt. • Ensured timely availability of fertilizers through out the year supplemented by
  • 18.
    New Nutrient basedSubsidy Policy imports • Subsidy reimbursement reasonably on time to meet the liquidity ( delay in last qtr. of FY 11) • International prices were stable throughout the yr. • MRP revised to offset the cost increases
  • 19.
    Through this termassignment, we have attempted to use the understanding of environmental, industrial, situational, organisational analysis to develop strategies for the companies. compare both companies with respect to their strengths, weaknesses, opportunities and threats, and also arrive at the business strategies. Findings from this assignment on the fertilizers industry using Coromandel Fertilizers Limited
  • 20.
    The report hasbeen prepared using data, inferences and understanding from: Ministry of Chemicals & Fertilizers - Department of Fertilizers Annual reports and business reports Coromandel Fertilizers Limited Fertilizer Association of India - Fertilizer Scenario 2012