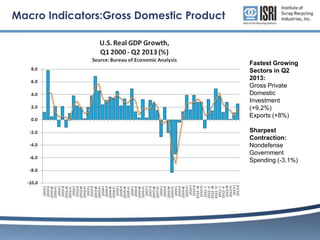
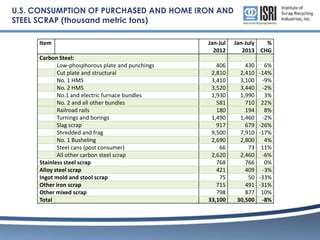
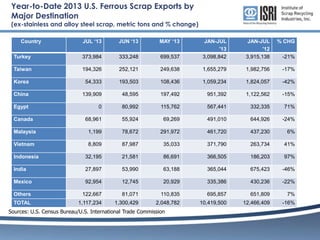
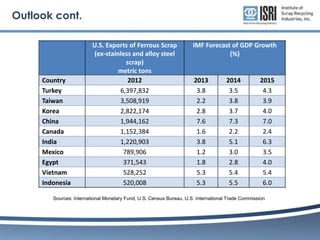
Economic and Ferrous Metal Market Trends
Ferrous Division Executive Committee

ISRI 2013 Fall Committee and Board Meetings
San Francisco, CA
October 22, 2013
Macro Indicators:Gross Domestic Product

Fastest Growing
Sectors in Q2
2013:
Gross Private
Domestic
Investment
(+9.2%)
Exports (+8%)
Sharpest
Contraction:
Nondefense
Government
Spending (-3.1%)
Macro Indicators: Unemployment
Macro Indicators: Inflation
Raw Material Prices
China Continues to Drive Global Steel Output Higher
U.S. CONSUMPTION OF PURCHASED AND HOME IRON AND
STEEL SCRAP (thousand metric tons)
Item
Carbon Steel:
Low-phosphorous plate and punchings
Cut plate and structural
No. 1 HMS
No. 2 HMS
No.1 and electric furnace bundles
No. 2 and all other bundles
Railroad rails
Turnings and borings
Slag scrap
Shredded and frag
No. 1 Busheling
Steel cans (post consumer)
All other carbon steel scrap
Stainless steel scrap
Alloy steel scrap
Ingot mold and stool scrap
Other iron scrap
Other mixed scrap
Total

Jan-Jul
2012
406
2,810
3,410
3,520
1,930
581
180
1,490
917
9,500
2,690
66
2,620
768
421
75
715
798
33,100

Jan-July
%
2013 CHG
430
2,410
3,100
3,440
1,990
710
194
1,460
679
7,910
2,800
73
2,460
766
409
50
491
877
30,500

6%
-14%
-9%
-2%
3%
22%
8%
-2%
-26%
-17%
4%
11%
-6%
0%
-3%
-33%
-31%
10%
-8%
Year-to-Date 2013 U.S. Ferrous Scrap Exports by
Major Destination

(ex-stainless and alloy steel scrap, metric tons and % change)
JUL ‘13

JUN ‘13

MAY ‘13

Turkey

373,984

333,248

Taiwan

194,326

Korea

Country

JAN-JUL
'12
3,915,138

% CHG

699,537

JAN-JUL
'13
3,098,842

252,121

249,638

1,655,279

1,982,756

-17%

54,333

193,503

108,436

1,059,234

1,824,057

-42%

China

139,909

48,595

197,492

951,392

1,122,562

-15%

Egypt

0

80,992

115,762

567,441

332,335

71%

Canada

68,961

55,924

69,269

491,010

644,926

-24%

Malaysia

1,199

78,672

291,972

461,720

437,230

6%

Vietnam

8,809

87,987

35,033

371,790

263,734

41%

Indonesia

32,195

21,581

86,691

366,505

186,203

97%

India

27,897

53,990

63,188

365,044

675,423

-46%

Mexico

92,954

12,745

20,929

335,386

430,236

-22%

Others

122,667

81,071

110,835

695,857

651,809

7%

TOTAL

1,117,234

1,300,429

2,048,782

10,419,500

12,466,409

-16%

Sources: U.S. Census Bureau/U.S. International Trade Commission

-21%
Outlook
• With the firming of domestic sheet prices and rising Chinese net steel exports,

market participants will be keeping an eye on steel import competition in the
fourth quarter.

• In the U.S., the construction and transportation sectors continue to exhibit signs
of strength and U.S. real GDP growth accelerated to 2.5% in 2Q 2013.

• In the near term, cutbacks in U.S. government spending, on-going budget and
debt ceiling showdowns, the implementation of new regulations, and the timing
of potential shifts in U.S. monetary policy are likely to have important implications
for investment, growth and the US Dollar while adding to uncertainty.
• Among the key overseas markets in the medium term, the International
Monetary Fund expects GDP growth in Turkey will increase 3.4% in 2013 and rise
3.7% in 2014, while “developing Asia” is expected to grow 7.1% this year and
7.3% in 2014.
Outlook cont.

Country
Turkey
Taiwan
Korea
China
Canada
India
Mexico
Egypt
Vietnam
Indonesia

U.S. Exports of Ferrous Scrap
(ex-stainless and alloy steel
scrap)
metric tons
2012
6,397,832
3,508,919
2,822,174
1,944,162
1,152,384
1,220,903
789,906
371,543
528,252
520,008

IMF Forecast of GDP Growth
(%)

2013
3.8
2.2
2.8
7.6
1.6
3.8
1.2
1.8
5.3
5.3

2014
3.5
3.8
3.7
7.3
2.2
5.1
3.0
2.8
5.4
5.5

2015
4.3
3.9
4.0
7.0
2.4
6.3
3.5
4.0
5.4
6.0

Sources: International Monetary Fund, U.S. Census Bureau, U.S. International Trade Commission

Economic and Ferrous Metal Market Trends

  • 1.
    Economic and FerrousMetal Market Trends Ferrous Division Executive Committee ISRI 2013 Fall Committee and Board Meetings San Francisco, CA October 22, 2013
  • 2.
    Macro Indicators:Gross DomesticProduct Fastest Growing Sectors in Q2 2013: Gross Private Domestic Investment (+9.2%) Exports (+8%) Sharpest Contraction: Nondefense Government Spending (-3.1%)
  • 3.
  • 4.
  • 5.
  • 6.
    China Continues toDrive Global Steel Output Higher
  • 7.
    U.S. CONSUMPTION OFPURCHASED AND HOME IRON AND STEEL SCRAP (thousand metric tons) Item Carbon Steel: Low-phosphorous plate and punchings Cut plate and structural No. 1 HMS No. 2 HMS No.1 and electric furnace bundles No. 2 and all other bundles Railroad rails Turnings and borings Slag scrap Shredded and frag No. 1 Busheling Steel cans (post consumer) All other carbon steel scrap Stainless steel scrap Alloy steel scrap Ingot mold and stool scrap Other iron scrap Other mixed scrap Total Jan-Jul 2012 406 2,810 3,410 3,520 1,930 581 180 1,490 917 9,500 2,690 66 2,620 768 421 75 715 798 33,100 Jan-July % 2013 CHG 430 2,410 3,100 3,440 1,990 710 194 1,460 679 7,910 2,800 73 2,460 766 409 50 491 877 30,500 6% -14% -9% -2% 3% 22% 8% -2% -26% -17% 4% 11% -6% 0% -3% -33% -31% 10% -8%
  • 8.
    Year-to-Date 2013 U.S.Ferrous Scrap Exports by Major Destination (ex-stainless and alloy steel scrap, metric tons and % change) JUL ‘13 JUN ‘13 MAY ‘13 Turkey 373,984 333,248 Taiwan 194,326 Korea Country JAN-JUL '12 3,915,138 % CHG 699,537 JAN-JUL '13 3,098,842 252,121 249,638 1,655,279 1,982,756 -17% 54,333 193,503 108,436 1,059,234 1,824,057 -42% China 139,909 48,595 197,492 951,392 1,122,562 -15% Egypt 0 80,992 115,762 567,441 332,335 71% Canada 68,961 55,924 69,269 491,010 644,926 -24% Malaysia 1,199 78,672 291,972 461,720 437,230 6% Vietnam 8,809 87,987 35,033 371,790 263,734 41% Indonesia 32,195 21,581 86,691 366,505 186,203 97% India 27,897 53,990 63,188 365,044 675,423 -46% Mexico 92,954 12,745 20,929 335,386 430,236 -22% Others 122,667 81,071 110,835 695,857 651,809 7% TOTAL 1,117,234 1,300,429 2,048,782 10,419,500 12,466,409 -16% Sources: U.S. Census Bureau/U.S. International Trade Commission -21%
  • 9.
    Outlook • With thefirming of domestic sheet prices and rising Chinese net steel exports, market participants will be keeping an eye on steel import competition in the fourth quarter. • In the U.S., the construction and transportation sectors continue to exhibit signs of strength and U.S. real GDP growth accelerated to 2.5% in 2Q 2013. • In the near term, cutbacks in U.S. government spending, on-going budget and debt ceiling showdowns, the implementation of new regulations, and the timing of potential shifts in U.S. monetary policy are likely to have important implications for investment, growth and the US Dollar while adding to uncertainty. • Among the key overseas markets in the medium term, the International Monetary Fund expects GDP growth in Turkey will increase 3.4% in 2013 and rise 3.7% in 2014, while “developing Asia” is expected to grow 7.1% this year and 7.3% in 2014.
  • 10.
    Outlook cont. Country Turkey Taiwan Korea China Canada India Mexico Egypt Vietnam Indonesia U.S. Exportsof Ferrous Scrap (ex-stainless and alloy steel scrap) metric tons 2012 6,397,832 3,508,919 2,822,174 1,944,162 1,152,384 1,220,903 789,906 371,543 528,252 520,008 IMF Forecast of GDP Growth (%) 2013 3.8 2.2 2.8 7.6 1.6 3.8 1.2 1.8 5.3 5.3 2014 3.5 3.8 3.7 7.3 2.2 5.1 3.0 2.8 5.4 5.5 2015 4.3 3.9 4.0 7.0 2.4 6.3 3.5 4.0 5.4 6.0 Sources: International Monetary Fund, U.S. Census Bureau, U.S. International Trade Commission

Editor's Notes

  • #7 Areport from Goldman Sachs indicates that steel market fundamentals are not attractive in the near to medium term given the “unbalanced supply/demand conditions that prevail globally and in the US,” although the bank makes the case that conditions could improve in the longer term, forecasting that U.S. steel mill shipments will improve 4.3% in 2014 as apparent steel demand is expected to rise 2.9% next year and 2.8% in 2015.