Download to read offline
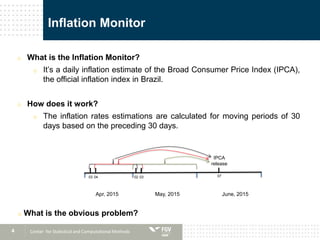
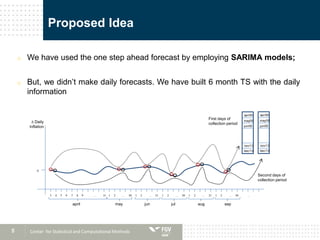
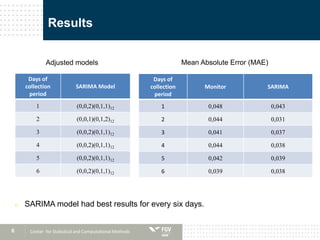


This document discusses applying daily inflation forecasts to predict Brazil's Broad Consumer Price Index (IPCA). It motivates the importance of forecasting CPI for monetary policy. Currently an "Inflation Monitor" provides daily estimates but has limitations in predicting the first 6 days of collection periods. The authors propose using SARIMA models on daily data to improve initial forecasts. Their results found SARIMA models produced better predictions than the Inflation Monitor for each of the first 6 days. Future work could involve forecasting index components individually and aggregating them or estimating SARIMA models directly on daily data.


