Download to read offline


![23
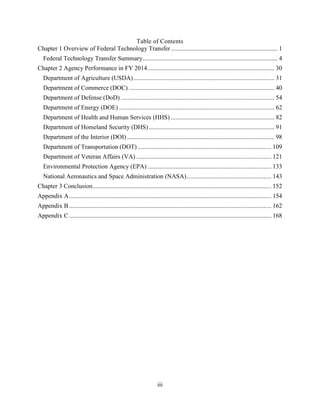
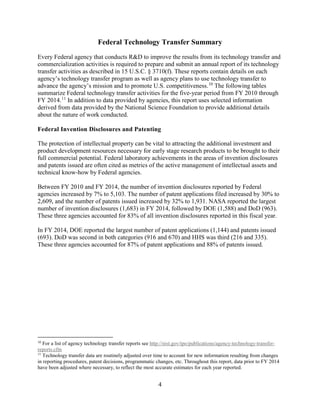
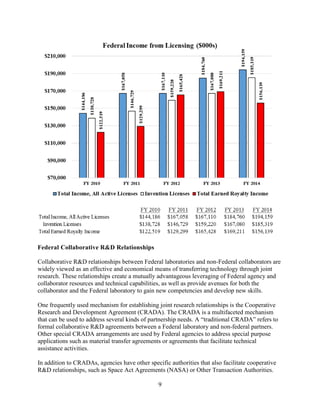
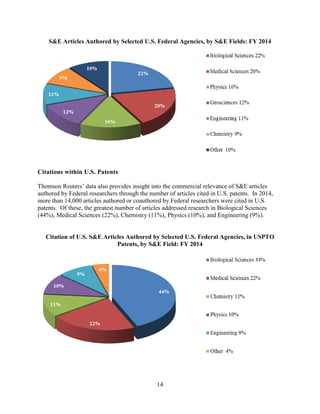
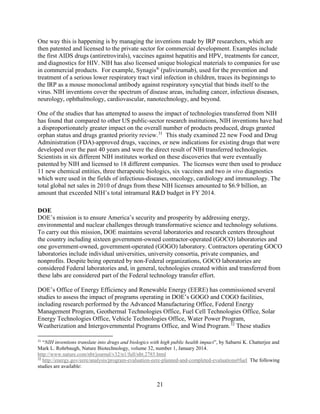
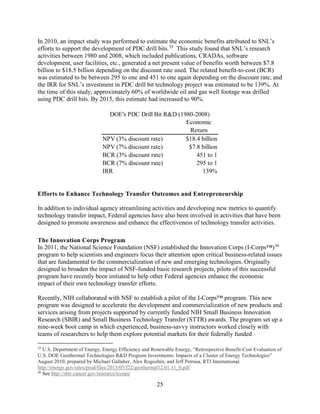
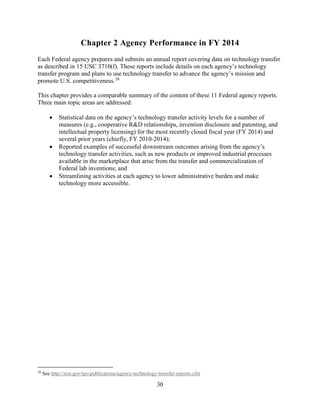
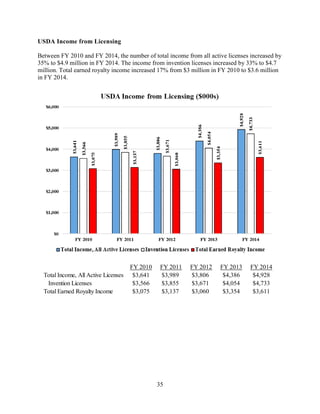
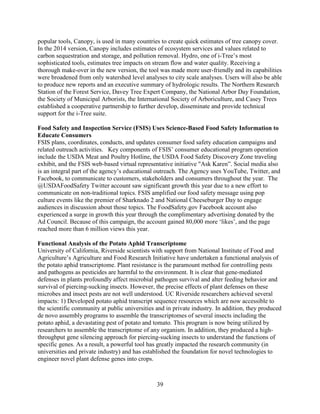
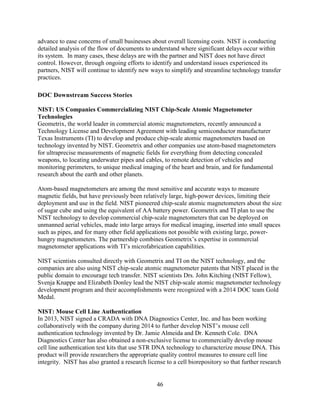
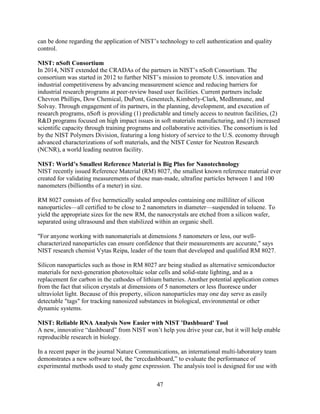
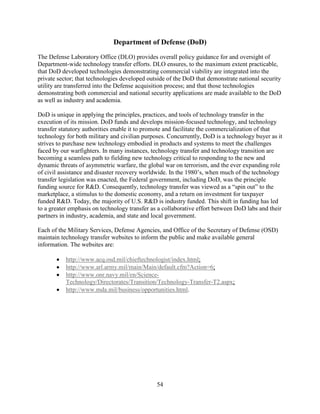
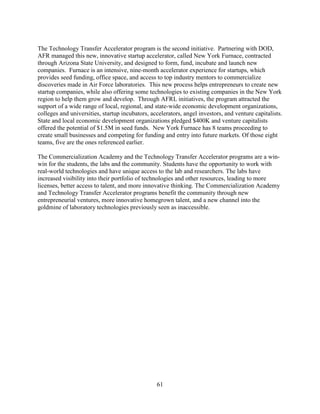
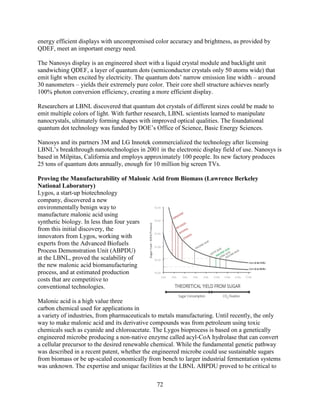
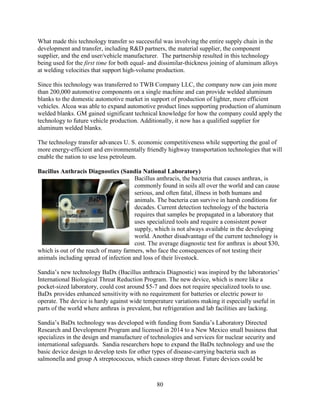
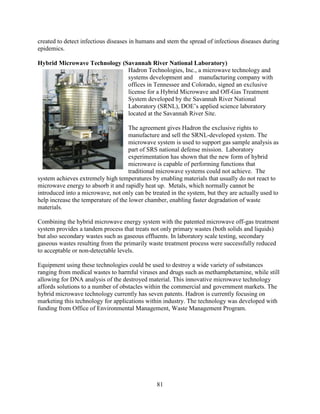
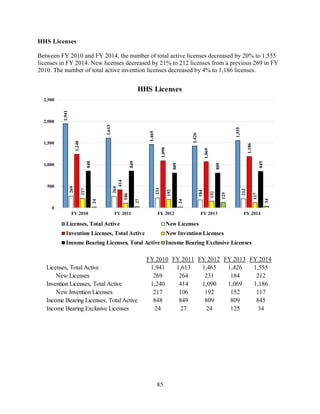
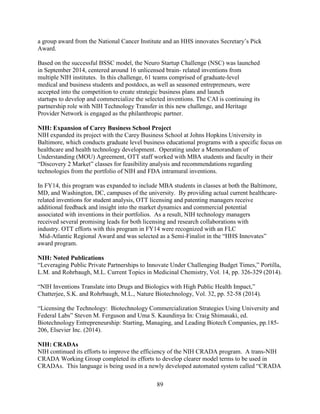
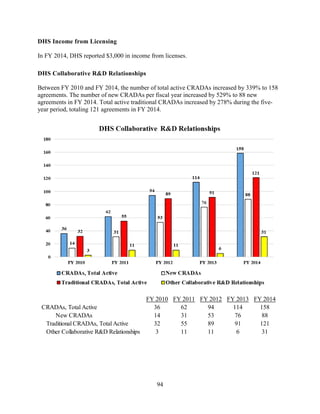
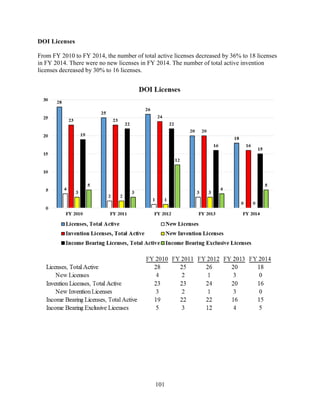
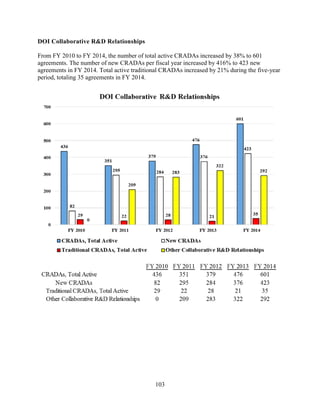
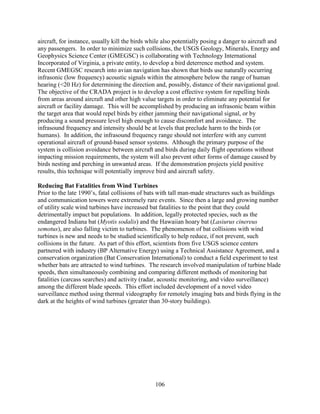
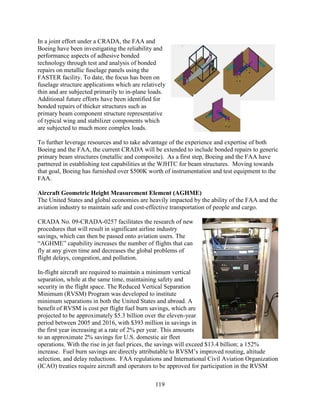
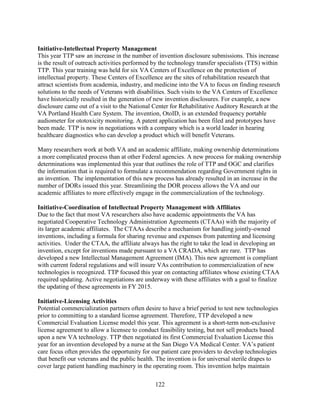
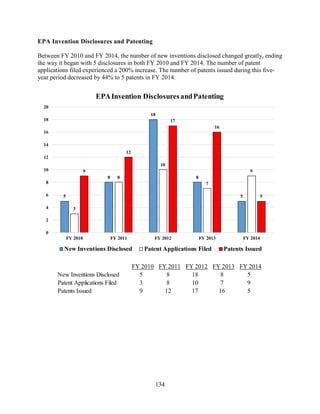
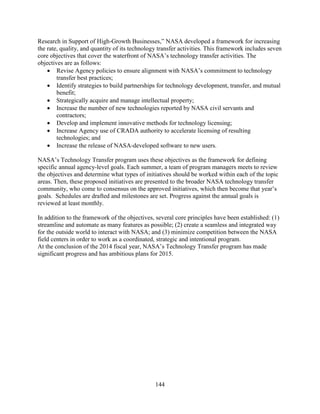
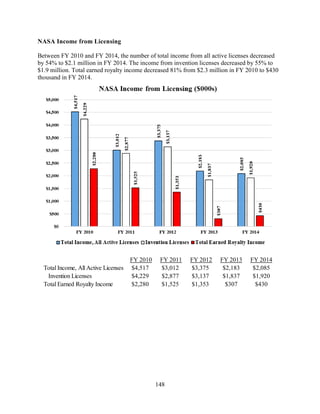
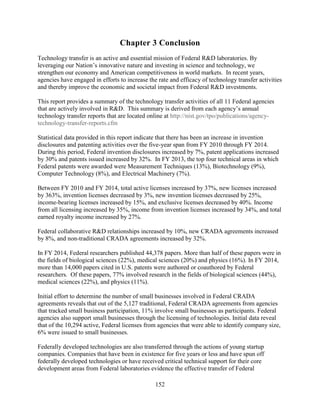
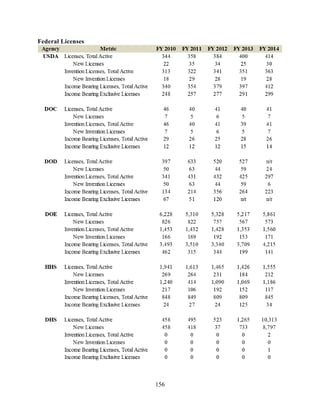
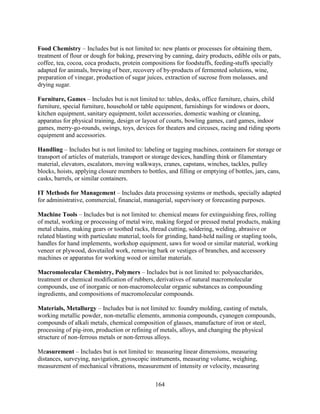
(a) EPA’s Co-Benefits Risk Assessment (COBRA) model is a tool used to estimate the health and economic benefits of air quality
policies.
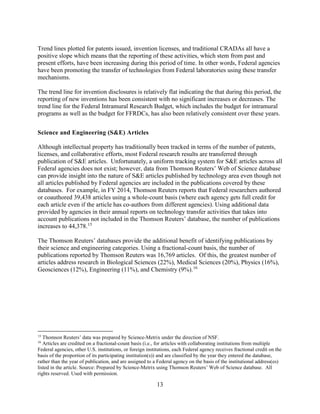
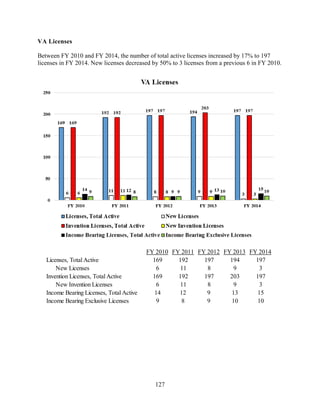
Another DOE study which does focus on Federally developed technologies illustrates the
important role of different types of technology transfer mechanisms. This study assessed the
impact of DOE’s effort to support the development of Polycrystalline Diamond Compact (PDC)
drill bits. Until the late 1970s, most oil and gas wells were drilled using a device called the roller-
cone drill bit. In 1977, a new drill bit design, using a synthetic material made of diamond grains,
was invented by General Electric. This Polycrystalline Diamond Compact (PDC) drill bit was
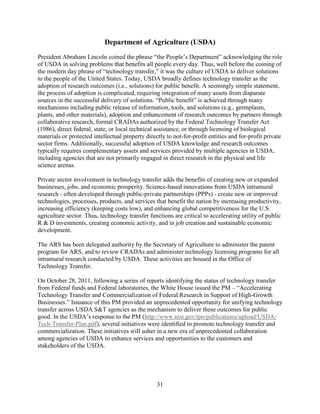
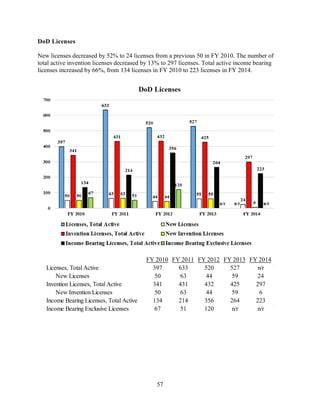
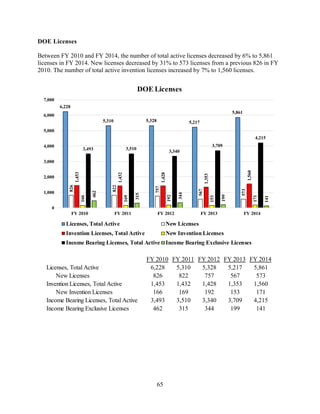
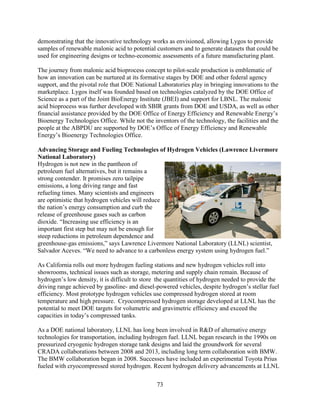
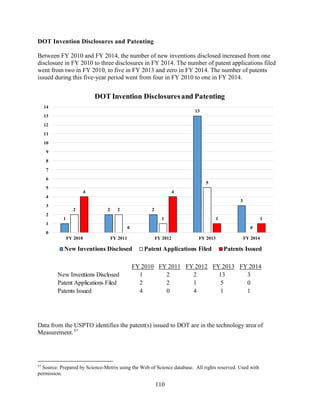
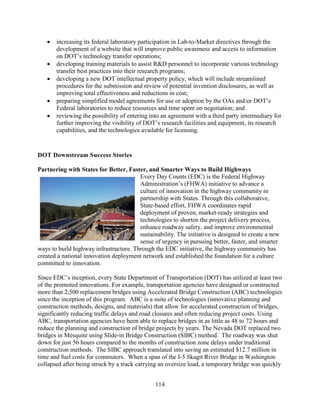
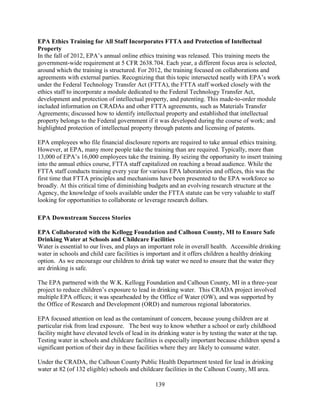
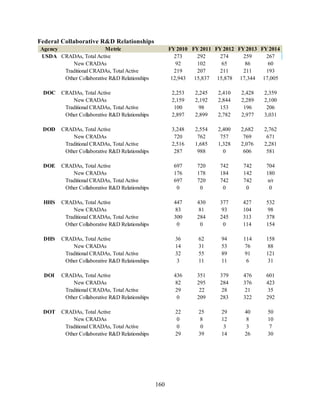
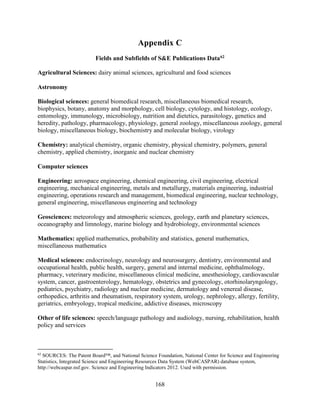
Quantified
Benefit
Minimum
Attribution to DOE
Unit of
Measure
Economic Benefits
Net economic benefits $15,024.90 $15,024.90 Million, 2008$
Public rate of return 17%
Net present value at 7% [Base year = 1975] $1,458.90 Million, 2008$
Net present value at 3% [Base year = 1975] $5,724.70 Million, 2008$
Benefit-to-cost ratio at 7% 1.83
Benefit-to-cost ratio at 3% 3.24
Environmental Health Benefits
Monetized via COBRA
(a)
$237.23 $39.80 Million, 2008$
Avoided mortality 32.65 5.48 Deaths
Avoided infant mortality 0.07 0.01 Deaths
Avoided chronic bronchitis 21.98 3.69 Cases
Avoided nonfatal heart attacks 51.03 8.57 Attacks
Avoided resp. hospital admissions 7.63 1.28 Admissions
Avoided CDV hospital admissions 15.88 2.67 Admissions
Avoided acute bronchitis 54.87 9.2 Cases
Avoided upper respiratory symptoms 490.69 82.29 Episodes
Avoided lower respiratory symptoms 650.84 109.15 Episodes
Avoided asthma ER visits 29.52 4.99 Visits
Avoided minor restriced activity (MRAD) days 27,036.52 4,535.47 Incidences
Avoided work loss days 685.87 123 Days
Greenhouse Gas Emissions Benefits
Avoided carbon dioxide emissions (CO2) 6,815,103 1,062,473 Tons
Avoided methane emissions (CH4) 132 21 Tons
Avoided nitrous oxide emissions (N2O) 583 90 Tons
Avoided particulate matter emissions (PM) 1,232 207 Tons
Avoided sulfur dioxide emissions (SO2) 2,634 463 Tons
Avoided ammonia emissions (NH3) 16 3 Tons
Avoided volatile organic compounds emissions (VOCs) 1,090 181 Tons
Energy Security Benefits
Equivalent avoided petroleum consumption 4,790,478 827,189 Barrels of oil
equivalent
Knowledge Benefits
DOE-attributed patent families in photovoltaics 274 Patent families
DOE publications in photovoltaics 900 Publications
Percentage of leading U.S. PV company patents linked to DOE 30%
Evaluation of DOE's Investment in Photovoltaic Energy System
Summary Cost-Benefit Analysis Results, 1975-2008](https://image.slidesharecdn.com/fy2014federaltechtransferreport-240925035823-426b0bcb/85/Federal-Laboratory-Technology-Transfer-Report_FY2014-pdf-29-320.jpg)


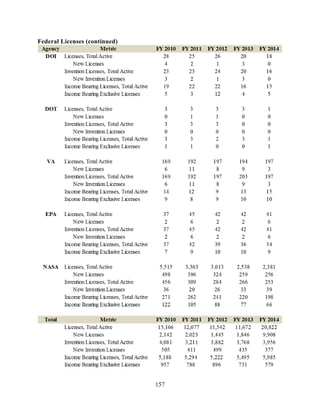
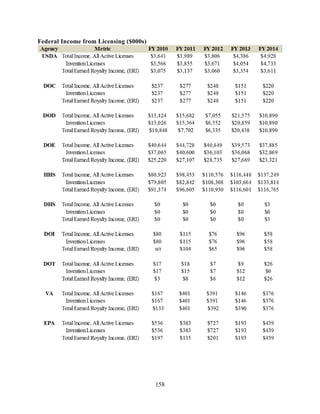
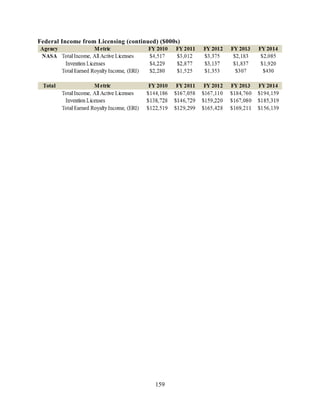


The FY 2014 Technology Transfer Summary Report outlines the efforts of federal laboratories to facilitate the transfer of innovative research to the American public, emphasizing collaboration with industry and academia. It highlights the increase in invention disclosures, patent applications, and licenses as key metrics of technology transfer activities, alongside the significant R&D investments made by various federal agencies. The report serves to keep the President and Congress informed about ongoing efforts and advancements in technology transfer aimed at bolstering the nation's economic growth.


