The document is a debate brief that outlines arguments for both sides of whether the US should adopt a carbon tax. The brief includes sections on the affirmative arguments around the social cost of carbon, inducing a switch to renewable energy, and deficit reduction. It also includes negative arguments around outsourcing emissions, emissions trading being preferable, failures of carbon taxes in Australia, and economic and precipitation harms. The document provides context and evidence for considering the social cost of carbon in debates on climate policy.


![THE SOCIAL COST OF CARBON
1. What is the Social Cost of Carbon? (Referred to as either SCC or
SC‐CO2)
[US Environmental Protection Agency] EPA Fact Sheet: Social Cost of Carbon
EPA and other federal agencies use the social cost of carbon (SC-CO2) to estimate the climate benefits of rulemakings. The SC-CO2 is an estimate of
the economic damages associated with a small increase in carbon dioxide (CO2) emissions, conventionally one
metric ton, in a given year. This dollar figure also represents the value of damages avoided for a small emission
reduction (i.e. the benefit of a CO2 reduction). The SC-CO2 is meant to be a comprehensive estimate of climate
change damages and includes, among other things, changes in net agricultural productivity, human health, property
damages from increased flood risk and changes in energy system costs, such as reduced costs for heating and
increased costs for air conditioning. However, it does not currently include all important damages. The IPCC Fifth
Assessment report observed that SC-CO2 estimates omit various impacts that would likely increase damages. The models
used to develop SC-CO2 estimates do not currently include all of the important physical, ecological, and economic
impacts of climate change recognized in the climate change literature because of a lack of precise information on
the nature of damages and because the science incorporated into these models naturally lags behind the most
recent research. Nonetheless, the SC-CO2 is a useful measure to assess the benefits of CO2 reductions. The timing of the
emission release (or reduction) is key to estimation of the SC-CO2, which is based on a present value calculation. The integrated assessment models first
estimate damages occurring after the emission release and into the future, often as far out as the year 2300. The models then discount the value of those
damages over the entire time span back to present value to arrive at the SC-CO2. For example, the SC-CO2 for the year 2020 represents the present value of
climate change damages that occur between the years 2020 and 2300 (assuming 2300 is the final year of the model run); these damages are associated with
the release of one ton of carbon dioxide in the year 2020. The SC-CO2 will vary based on the year of emissions for multiple reasons. In model runs where the
last year is fixed (e.g., 2300), the time span covered in the present value calculation will be smaller for later emission years— the SC-CO2 in 2050 will include
40 fewer years of damages than the 2010 SC-CO2 estimates. This modeling choice—selection of a fixed end year—will place downward pressure on the
SC-CO2 estimates for later emission years. Alternatively, the SC-CO2 should increase over time because future emissions are expected to produce larger
incremental damages as physical and economic systems become more stressed in response to greater levels of climatic change. One of the most important
factors influencing SC-CO2 estimates is the discount rate. A large portion of climate change damages are expected to occur many decades into the future and
the present value of those damages (the value at present of damages that occur in the future) is highly dependent on the discount rate. To understand the
effect that the discount rate has on present value calculations, consider the following example. Let’s say that you have been promised that in 50 years you
will receive $1 billion. In “present value” terms, that sum of money is worth $291 million today with a 2.5 percent discount rate. In other words, if you
invested $291 million today at 2.5 percent and let it compound, it would be worth $1 billion in 50 years. A higher discount rate of 3 percent would decrease
the value today to $228 million, and the value would be even lower—$87 million-- with a 5 percent rate. This effect is even more pronounced when looking
at the present value of damages further out in time. The value of $1 billion in 100 years is $85 million, $52 million, and $8 million, for discount rates of 2.5
percent, 3 percent, and 5 percent, respectively. Similarly, the selection of a 2.5 percent discount rate would result in higher SC-CO2 estimates than would the
selection of 3 and 5 percent rates, all else equal.
3. There is debate on the exact number for the SCC, mostly attributable
to differences in the applications of discount rates, but the current,
prevailing number is $220/ton
Ker Than [Stanford University] Estimated social cost of climate change not accurate, Stanford
scientists say
The economic damage caused by a ton of carbon dioxide emissions – often referred to as the "social cost" of carbon – could actually be six times higher than
the value that the United States now uses to guide current energy regulations, and possibly future mitigation policies, Stanford scientists say. A recent U.S.
government study concluded, based on the results of three widely used economic impact models, that an additional ton of carbon dioxide emitted in 2015
would cause $37 worth of economic damages. These damages are expected to take various forms, including decreased agricultural yields, harm to human
health and lower worker productivity, all related to climate change. But according to a new study, published online this week in the journal Nature Climate
Change, the actual cost could be much higher. "We estimate that the social cost of carbon is not $37 per ton, as previously
estimated, but $220 per ton," said study coauthor Frances Moore, a PhD candidate in the Emmett Interdisciplinary Program in Environment and
Resources in Stanford's School of Earth Sciences. Based on the findings, countries may want to increase their efforts to curb greenhouse gas emissions, said
study co-author Delavane Diaz, a PhD candidate in the Department of Management Science and Engineering at Stanford's School of Engineering. "If the
social cost of carbon is higher, many more mitigation measures will pass a cost‐benefit analysis," Diaz said. "Because
carbon emissions are so harmful to society, even costly means of reducing emissions would be worthwhile." For their](https://image.slidesharecdn.com/33964e0d-f6bf-4a01-b800-ecf75306434d-160207051202/85/February-Carbon-Tax-Brief-compressed-4-320.jpg)
![study, Moore and Diaz modified a well-known computer model for calculating the economic impacts of climate change, known as an integrated assessment
model, or IAM. Their alternative formulation incorporated recent empirical findings suggesting that climate change could substantially slow economic growth
rates, particularly in poor countries. IAMs are important policy tools. Because they include both the costs and benefits of reducing emissions, they can inform
governments about the optimal level of investment in emission reduction. The U.S. Environmental Protection Agency, for example, uses the $37 average value
from three IAMs to evaluate greenhouse gas regulations. Canada, Mexico, the United Kingdom, France, Germany and Norway have also used IAMs to analyze
climate and energy policy proposals. While useful, IAMs have to make numerous simplifying assumptions. One limitation, for example, is that they fail to
account for how the damages associated with climate change might persist through time. "For 20 years now, the models have assumed that climate change
can't affect the basic growth rate of the economy," Moore said. "But a number of new studies suggest this may not be true. If climate change affects not only
a country's economic output but also its growth, then that has a permanent effect that accumulates over time, leading to a much higher social cost of
carbon." In the new study, Moore and Diaz took a widely used IAM, called the Dynamic Integrated Climate-Economy (DICE) model, and modified it in three
ways: They allowed climate change to affect the growth rate of the economy; they accounted for adaptation to climate change; and they divided the model
into two regions to represent high- and low-income countries.
4. Scientists almost universally agree that the SCC, while providing
monetization of carbon reduction, is always an underestimation.
Jason Schwartz & Peter Howard [Institute for Policy Integrity] Foreign Action, Domestic
Windfall
Though these estimates reflect much of the latest, peer-reviewed scientific and economic literature, experts widely acknowledge that these
SCC numbers are almost certainly underestimates of true global damages—perhaps severe underestimates. Using
different discount rates; selecting different models; applying different treatments to uncertainty, climate sensitivity,
and the potential for catastrophic damages; and making other reasonable assumptions could yield very different,
and much larger, SCC estimates.19 For example, a recent report found current SCC estimates omit or poorly quantify
damages to the following sectors: agriculture, forestry, and fisheries (including pests, pathogens, and weeds,
erosion, fires, and ocean acidification); ecosystem services (including biodiversity and habitat loss); health impacts
(including Lyme disease and respiratory illness from increased ozone pollution, pollen, and wildfire smoke);
inter-regional damages (including migration of human and economic capital); inter-sector damages (including the
combined surge effects of stronger storms and rising sea levels); exacerbation of existing non-climate stresses
(including the combined effect of the over pumping of groundwater and climate-driven reductions in regional water
supplies); socially contingent damages (including increases in violence and other social conflict); decreasing growth
rates (including decreases in labor productivity and increases in capital depreciation); weather variability (including
increased drought and inland flooding); and catastrophic impacts (including unknown unknowns on the scale of the
rapid melting of Arctic permafrost or ice sheets).20 Nevertheless, the interagency numbers provide a useful starting point to calculate the
benefits of worldwide greenhouse gas reductions, including the benefits experienced by the United States.
5. The true SCC only increases with time.
[International Panel on Climate Change] Climate Change 2007: Working Group II: Impacts,
Adaptation and Vulnerability
Climate change will result in net costs into the future, aggregated across the globe and discounted to today; these costs will grow over time [20.6.1, 20.6.2]
(very high confidence). More than 100 estimates of the social cost of carbon are available. They run from US$-10 to US$+350 per tonne of carbon.
Peer-reviewed estimates have a mean value of US$43 per tonne of carbon with a standard deviation of US$83 per tonne. Uncertainties in climate sensitivity,
response lags, discount rates, the treatment of equity, the valuation of economic and non-economic impacts and the treatment of possible catastrophic losses
explain much of this variation including, for example, the US$310 per tonne of carbon estimate published by Stern (2007). Other estimates of the social cost
of carbon span at least three orders of magnitude, from less than US$1 per tonne of carbon to over US$1,500 per tonne [20.6.1]. It is likely that the
globally-aggregated figures from integrated assessment models underestimate climate costs because they do not include significant impacts that have not yet
been monetised [20.6.1, 20.6.2, 20.7.2, 20.8, Chapter 17 Section 17.2.3, Chapter 19]. It is virtually certain that aggregate estimates mask significant
differences in impacts across sectors and across regions, countries and locally [20.6, 20.7, 20.8, Chapter 17 Section 17.3.3]. It is virtually certain that
the real social cost of carbon and other greenhouse gases will rise over time; it is very likely that the rate of increase will be 2%
to 4% per year [20.6, 20.7]. By 2080, it is likely that 1.1 to 3.2 billion people will be experiencing water scarcity
(depending on scenario); 200 to 600 million, hunger; 2 to 7 million more per year, coastal flooding [20.6.2].](https://image.slidesharecdn.com/33964e0d-f6bf-4a01-b800-ecf75306434d-160207051202/85/February-Carbon-Tax-Brief-compressed-5-320.jpg)
![6. A recent meta‐analysis finds strong publication bias in favor of higher
rates of increase than lower rates.
Tomas Havranek, Zuzana Irsova, Karel Janda, and David Zilberman [UC Berkeley] Selective
Reporting and the Social Cost of Carbon
We examine potential selective reporting in the literature on the social cost of carbon (SCC) by conducting a meta-analysis of 809 estimates of the SCC
reported in 101 studies. Our results indicate that estimates for which the 95% confidence interval includes zero are less
likely to be reported than estimates excluding negative values of the SCC, which creates an upward bias in the
literature. The evidence for selective reporting is stronger for studies published in peer-reviewed journals than for unpublished papers. We show that the
findings are not driven by the asymmetry of confidence intervals surrounding the SCC and are robust to controlling for various characteristics of study design
and to alternative definitions of confidence intervals. Our estimates of the mean reported SCC corrected for the selective reporting bias are imprecise and
range between 0 and 130 USD per ton of carbon in 2010 prices for emission year 2015.
7. Experimentally, it has been determined that taxing at the lower SCC
rate estimates reduces emissions and taxing at the higher SCC rate
estimates induces switching to alternative energy sources.
Anthony Paul, Blair Beasley, and Karen Palmer [Resources for the Future] Taxing Electricity
Sector Carbon Emissions at Social Cost
Concerns about budget deficits, tax reform, and climate change are fueling discussions about taxing carbon emissions to generate revenue and reduce
greenhouse gas emissions. Imposing a carbon tax on electricity production based on the social cost of carbon (SCC) could
generate between $21 and $82 billion in revenues in 2020 and would have important effects on electricity markets. The
sources of emissions reductions in the sector depend on the level of the tax. A carbon tax based on lower SCC estimates reduces
emissions by reducing demand and through the substitution of gas for coal, whereas taxes based on higher SCC
estimates induce switching to wind and nuclear generation. The slow rate of growth of the SCC estimates means that any SCC-based
carbon tax trajectory provides weaker long-run incentives for expanded renewable and nuclear generation than a cap-and-trade program that achieves an
equivalent level of cumulative carbon dioxide emissions reductions. Taxing carbon at the SCC is welfare enhancing, but the SCC may not be
the optimal tax rate.
8. Even starting a carbon tax below the SCC and gradually moving it
upward reduces emissions to the tune of 30 percent.
Robert Shapiro, Nam Pham, and Arun Malik [The George Washington University] The
Economics and Environmental Science of Combining a CarbonBased Tax and Tax Relief
The need to address the risks of climate change is clear and pressing. Without taking serious steps to reduce emissions of CO2 and other greenhouse gases,
their concentrations in the atmosphere will reach levels in a few decades that will change the world’s weather, and the patterns of people’s economic and
social lives across the globe. The primary sources of the rising atmospheric concentrations of CO2 and other GHG are the carbon-based fossil fuels used to
power the economies of every country, so serious measures to reduce the growth of those emissions could have far-reaching economic and social effects.
This study has examined a strategy that promises to reduce those emissions to a path that should be able to sustain the world’s climate, at comparatively
modest costs to the U.S. economy and to American households. This strategy would apply a new tax to the use of energy based on its carbon content and
return 90 percent of the revenues in tax relief to the people and businesses using the energy and paying the tax, and use 10 percent of those revenues for
additional investments in energy and climate-related research and development, and in the deployment of climate-friendly fuels and technologies. The
package analyzed here would apply a new tax that would rise gradually from $14 per metric ton of CO2 in 2010 to
$50 per metric ton in 2030. We use the NEMS modeling system employed by the U.S. Department of Energy to
project the various effects of this proposed new tax, and its accompanying tax rebates and public investments. The NEMS model
found that this tax-based strategy would steadily move businesses and households to prefer less carbon-intensive
fuels, to use less energy-intensive technologies and products, and to conduct their businesses and lives in other
ways that use less energy generally and especially less carbon-intensive energy. By 2030, these shifts would drive](https://image.slidesharecdn.com/33964e0d-f6bf-4a01-b800-ecf75306434d-160207051202/85/February-Carbon-Tax-Brief-compressed-6-320.jpg)
![INDUCES SWITCH TO / INVESTMENT
IN RENEWABLE ENERGY
1. A Carbon tax is the best way to ween private firms off of fossil fuels
and encourage investment in alternatives
Eduardo Porter [New York Times] A Carbon Tax Could Bolster Green Energy
There is one tool available to trim carbon emissions on a relevant scale: a carbon tax. That solution, however, remains off the
table. If a carbon tax were to be imposed next year, starting at $25 and rising by 5 percent a year, the Energy
Information Administration estimates, carbon dioxide emissions from American power plants would fall to only 419
million tons by 2040, about one fifth of where they are today. Total carbon dioxide emissions from energy in the
United States would fall to 3.6 billion tons — 1.8 billion tons less than today. By providing a monetary incentive, economists
say, such a tax would offer by far the most effective way to encourage business and individuals to reduce their use
of fossil fuels and invest in alternatives. Is this enough? No. This proposal still leaves the United States short of the 80 percent cut in
greenhouse gas emissions that the White House is aiming for and that experts consider necessary by 2050 to prevent climatic havoc. But at least it’s in the
same order of magnitude. Most important, perhaps, the Energy Information Administration’s estimates make clear that the real constraint lies not in our
ability to develop the necessary technologies but in our political will to deploy them.
2. A carbon tax directly encourages the search for alternatives to carbon
energy, thus acting as a net gain to society
Bruce Nels Stram [World Federation of Scientists] A new strategic plan for a carbon tax
The economist's logic for a carbon tax (or any externalities tax) starts with the premise that increasing carbon dioxide concentration in the atmosphere causes
warming; the physics of this are fairly (though not entirely) incontrovertible. Continued warming will risk substantial harm to ecosystems and the world
economy. Carbon concentration increases may have other adverse impacts on ocean Ph (acidity) and other effects. A carbon tax can theoretically
create a net gain to world society over the long term as it provides an incentive to reduce emissions directly and
encourages the search for alternatives to carbon energy (Helm, 2012). These actions impose a cost to the economy, but
that cost is more than offset by reduced harm based on wise policy. There is also the matter of revenues collected by governments through
the tax. George Schultz and Gary Becker recently offered support to a long standing proposal for “revenue neutrality” that involves returning the funds to
taxpayers (by a formula unrelated to their use of carbon fuels) (Schultz and Becker, 2013). This is offered as a means of making a carbon tax more palatable
to citizens. In considering these and like proposals, one should clearly understand that despite such a return of funds, today's consumers are not better off.
The higher costs they will bear for energy directly, and the products that require energy to be produced (virtually everything), is greater than the rebate they
will receive in total, though there might be some short term gainers. The benefits that more than offset the cost of carbon reduction will accrue to future
generations who will be spared some global warming harm and who will be the beneficiaries of new energy technologies. In any case, for a carbon tax to
make sense, those likely benefits must exceed probable costs. This cost benefit analysis goes to the heart of the debate over estimates of harm from warming
and the timing of that harm. The further in the future we might expect harm, the less those damages should be weighed in current policy. That is one big
reason why the recent flattening of future global temperature estimates matter. The case for urgent climate change action depends not on current
temperature levels but rather that temperature and other impacts that are expected for the future.
3. Making emissions costlier allows alternative energy to become a
more competitive option for emitting firms
[New England Aquarium] Policies that tackle the issues of global climate change
A carbon tax is a tax on emissions of carbon dioxide and other greenhouse gases. The purpose of a carbon tax is to reduce emissions of carbon dioxide by
making it more expensive to pollute. A carbon tax can be implemented “upstream” on oil producers or refiners, or “downstream” on consumers who buy
gasoline for their cars. It can be placed on selected industries, such as power plants that use fossil fuels, or implemented economy-wide on many industries.
Proponents like this form of direct taxation because is straightforward and easy to understand, and doesn’t require extensive monitoring and enforcement.
Many carbon tax schemes use a portion of the revenue generated by the taxes to reduce other taxes (e.g. income or property taxes) or to fund worthy
projects such as green energy alternatives. The overall aim is to encourage energy producers and/or consumers to shift their spending to lower carbon](https://image.slidesharecdn.com/33964e0d-f6bf-4a01-b800-ecf75306434d-160207051202/85/February-Carbon-Tax-Brief-compressed-8-320.jpg)
![activities. By making carbon-based fuels more expensive, the tax will enable non carbon fuels or technologies such as
solar or wind power to compete more successfully. However, the carbon tax has to be pretty steep before consumers will be induced to
change their habits (In 2008, it wasn’t until the price of gas reached $4.00 per gallon that people started buying more cars than SUVs.) If the Senate approves
a carbon cap and trade system later this year, we are unlikely to see any congressional action on a carbon tax.
4. Empirically, taxing carbon at higher SCC estimates induces the switch
to wind and nuclear energy sources
Anthony Paul, Blair Beasley, and Karen Palmer [Resources for the Future] Taxing Electricity
Sector Carbon Emissions at Social Cost
Concerns about budget deficits, tax reform, and climate change are fueling discussions about taxing carbon emissions to generate revenue and reduce
greenhouse gas emissions. Imposing a carbon tax on electricity production based on the social cost of carbon (SCC) could generate between $21 and $82
billion in revenues in 2020 and would have important effects on electricity markets. The sources of emissions reductions in the sector depend on the level of
the tax. A carbon tax based on lower SCC estimates reduces emissions by reducing demand and through the substitution of gas for coal, whereas taxes
based on higher SCC estimates induce switching to wind and nuclear generation. The slow rate of growth of the SCC estimates
means that any SCC-based carbon tax trajectory provides weaker long-run incentives for expanded renewable and nuclear generation than a cap-and-trade
program that achieves an equivalent level of cumulative carbon dioxide emissions reductions. Taxing carbon at the SCC is welfare enhancing, but the SCC may
not be the optimal tax rate.
5. Empirically, taxing carbon at higher SCC estimates induces the switch
to wind and nuclear energy sources
Anthony Paul, Blair Beasley, and Karen Palmer [Resources for the Future] Taxing Electricity
Sector Carbon Emissions at Social Cost
Concerns about budget deficits, tax reform, and climate change are fueling discussions about taxing carbon emissions to generate revenue and reduce
greenhouse gas emissions. Imposing a carbon tax on electricity production based on the social cost of carbon (SCC) could generate between $21 and $82
billion in revenues in 2020 and would have important effects on electricity markets. The sources of emissions reductions in the sector depend on the level of
the tax. A carbon tax based on lower SCC estimates reduces emissions by reducing demand and through the substitution of gas for coal, whereas taxes
based on higher SCC estimates induce switching to wind and nuclear generation. The slow rate of growth of the SCC estimates
means that any SCC-based carbon tax trajectory provides weaker long-run incentives for expanded renewable and nuclear generation than a cap-and-trade
program that achieves an equivalent level of cumulative carbon dioxide emissions reductions. Taxing carbon at the SCC is welfare enhancing, but the SCC may
not be the optimal tax rate.
6. A Carbon tax is more widely supported when revenue is allocated to
renewable and alternative energy development
Barry Rabe [Unviersity of Michigan] Public Views on a Carbon Tax Depend on the Proposed
Use of Revenue
Most Americans oppose a carbon tax when the use of tax revenue is left unspecified. Overall support for such a tax
is 34% in the latest NSEE survey. Attaching a specific cost to the carbon tax reduces overall support to 29%. 2. A revenue-neutral
carbon tax, in which all tax revenue would be returned to the public as a rebate check, receives 56% support. The largest gains in support come from
Republicans. 3. A carbon tax with revenues used to fund research and development for renewable energy programs
receives 60% support, the highest among tax options that we presented. Majorities of Democrats, Republicans, and
Independents each express support for this tax. 4. Most respondents oppose a carbon tax with revenues used to reduce the federal budget
deficit. Overall support for such a tax is 38% with a majority of Democrats, Republicans, and Independents each expressing opposition to this tax. 5. When
asked which use of revenue they prefer if a carbon tax were enacted, pluralities of Democrats, Republicans, and Independents each prefer renewable energy
over tax rebate checks or deficit reduction.](https://image.slidesharecdn.com/33964e0d-f6bf-4a01-b800-ecf75306434d-160207051202/85/February-Carbon-Tax-Brief-compressed-9-320.jpg)
![PREFERABLE TO CAP‐AND‐TRADE
1. What is Cap‐And‐Trade?
[Environmental Defense Fund] How cap and trade works
Cap and trade is the most environmentally and economically sensible approach to controlling greenhouse gas emissions, the primary driver of global warming.
The “cap” sets a limit on emissions, which is lowered over time to reduce the amount of pollutants released into
the atmosphere. The “trade” creates a market for carbon allowances, helping companies innovate in order to meet,
or come in under, their allocated limit. The less they emit, the less they pay, so it is in their economic incentive to pollute less.
A cap: The only sure way to limit pollution
A cap sets a maximum allowable level of pollution and penalizes companies that exceed their emission allowance. No other system can guarantee to lower
emissions.
The cap is a limit on the amount of pollution that can be released, measured in billions of tons of carbon dioxide (or equivalent) per year. It is set based on
science.
It covers all major sources of pollution. The cap should limit emissions economy-wide, covering electric power generation, natural gas, transportation, and
large manufacturers.
Emitters can release only limited pollution. Permits or “allowances” are distributed or auctioned to polluting
entities: one allowance per ton of carbon dioxide, or CO2 equivalent heat-trapping gases. The total amount of
allowances will be equal to the cap. A company or utility may only emit as much carbon as it has allowances for.
Industry can plan ahead. Each year, the cap is ratcheted down on a gradual and predictable schedule. Companies can plan well in advance to be allowed
fewer and fewer permits – less global warming pollution – each year.
Trading: Leads to investment and innovation
Some companies will find it easy to reduce their pollution to match their number of permits; others may find it more difficult. Trading lets companies buy and
sell allowances, leading to more cost-effective pollution cuts, and incentive to invest in cleaner technology.
Unlike with some pollutants, all CO2 goes into the upper atmosphere and has a global — not local — effect. So it doesn’t matter whether the factory making
the emission cuts is in Boston, Baton Rouge, or Berlin, it reduces global emissions.
Companies can turn pollution cuts into revenue. If a company is able to cut its pollution easily and cheaply, it can end up with extra allowances. It can then
sell its extra allowances to other companies. This provides a powerful incentive for creativity, energy conservation and investment — companies can turn
pollution cuts into dollars.
The option to buy allowances gives companies flexibility. On the other hand, some companies might have trouble reducing their emissions, or want to make
longer-term investments instead of quick changes. Trading allowances gives these companies another option for how to meet each year’s cap.
The same amount of pollution cuts are achieved. While companies may exchange allowances with each other, the total number of allowances remains the
same and the hard limit on pollution is still met every year.
2. General advantages of carbon taxes over a cap‐and‐trade system
Bruce Yandle [Clemson University] THOUGHTS ON THE RELATIVE MERITS OF
CAPANDTRADE VERSUS EMISSION TAXES FOR CONTROLLING CARBON EMISSIONS
The Use of Taxes for Emission Control Oddly enough, the United States has never adopted emission fees or taxes as
a federal instrument for controlling emissions, although emission taxes have been used at the regional level of state
government. Experience with emission taxes elsewhere demonstrates their effectiveness in reducing unwanted
emissions. Unsuccessful U.S. efforts to control by taxation reach as far back as the Nixon administration and are as recent as the Clinton administration.
However, every attempt to regulate by taxation has been rebuffed by an antitax objection that taxes raise costs, as though commandandcontrol regulation or
capandtrade does not. Since any form of regulation will raise costs, the antitax objection apparently hides a real objection that may in fact be the preference
for regulations that cartelize and raise profits, which is something taxes or fees cannot do. It is also possible that political preferences for commandandcontrol
or even capandtrade rest on preferences for the possibilities that some sectors and industries will be treated advantageously when the controls are imposed
and the permits for pollution caps are granted. Controlling Carbon Emissions When approaching the design of institutions for controlling carbon emissions, it
is understandable that policy makers would be attracted to consider capandtrade as an appropriate mechanism for achieving the overall goal of reducing
emissions, especially during times of fiscal stress when there is the possibility of auctioning off the rights to pollute. The political preference may be explained
by the following reasons: Capandtrade has been shown to work in the United States in the control of sulfur dioxide emissions from major sources of that
pollutant. Capandtrade, unlike commandandcontrol, induces costeffective control thereby minimizing the technical cost for achieving a particular level of
emission reduction. The initial sale of emission permits when installing capandtrade can be the source of a large amount of onetime revenue. Differential
treatment of firms, industries, regions of the country and even interest groups is possible. Huge wealth grants can be provided to favored organizations by an
initial free grant of permits that can then be sold. The support of environmental organizations can be predicted, since the "cap" component of capandtrade](https://image.slidesharecdn.com/33964e0d-f6bf-4a01-b800-ecf75306434d-160207051202/85/February-Carbon-Tax-Brief-compressed-10-320.jpg)
![means that the allowable level of emissions is fixed below the current level. As indicated, the expected political support rests largely on the possibility of
transferring wealth to favored groups, at the expense of the forgotten and disregarded groups. Capand trade is an excellent example of my theory of
Bootleggers and Baptists in action. Industrial groups and firms that are low carbon emitters, for example nuclear powered electricity producers as opposed to
coalfired producers, play the role of bootleggers who favor laws that limit carbon. The environmental groups are the obvious Baptists who take the moral
high ground. Those who might object to the Bootlegger/Baptist political threat can be bought off by giving them an allocation of emission permits that can
then be sold at auction. Assessment of the relative merits of capandtrade for carbon control are based on critically important assumptions or no statement at
all about the cost of determining the initial allowable level of carbon emissions for sources, the cost of monitoring outcomes, and the cost of enforcing and
managing the standard. Put another way, the proponents of capandtrade generally behave as if there is no cost associated
with the operating the trading institution. Attention paid to the sad European Union experience with capandtrade
carbon control might lift the importance of assessing the prospects for successfully designing a trading institution
that actually works. CapandTrade versus Taxation Under a set of well specified conditions, it can be shown analytically that a properly designed carbon
tax can induce the same level of carbon emission reductions as a capandtrade system and do so at the identical cost per ton of carbon emissions eliminated,
assuming the cost of operating the two institutions is the same. Put another way, in a classroom setting with full information on production, production costs,
and energy costs for all industries, an approach using either system can be shown to generate identical results, in a static situation. Of course, when
politicians speak of adopting one approach or another, they are not operating in a classroom environment. The world is full of unknowns, uncertainties and
continuous change. When a tax approach is compared to capandtrade, the tax approach offers the following advantages:
Taxes can be raised and lowered with relative ease when market and environmental conditions change in ways that
call for more or less carbon reduction from particular sources. Once allocated, it is politically and economically
difficult to recall permits or to increase the number of permits in use. Taxes allow for entry and exit of carbon
emitters without resort to petition for emission rights. If emissions are expanded, the tax bill rises. If emissions fall,
the bill goes down. There is no Bootlegger/Baptist effect with emission taxes, although there can be political favor seeking for those who seek special
tax treatment. Taxation provides a readily available source of information on the annual cost of allowing carbon
emissions, since the total taxes paid will be a proxy for that cost. Just as in the case of capandtrade, the cost of operating an emission
tax institution is unknown and unknowable.
[Yale School of Forestry and Environmental Studies] Putting a Price on Carbon: An Emissions
Cap or a Tax?
Jeffrey D. Sachs, director of the Earth Institute at Columbia University.
Cap-and-trade emissions trading seems to politicians to be the ideal solution. It is “market-based,” does not require
the T-word (taxes), and can be worked out with special-interest groups in back-room negotiations. For the rest of
us, however, cap-and-trade seems a funny way to do business. A straightforward carbon tax has vast advantages. It
can be levied upstream at a few dozen places — at the wellhead, the mine face, and the liquid natural gas depot —
rather than at thousands or tens of thousands of businesses. A carbon tax covers the entire economy, including
automobiles, household use, and other units impossible to reach in cap-and-trade. A carbon tax puts a clear price
on carbon emissions for many years ahead, while a cap-and-trade system gives a highly fluctuating spot price. A
carbon tax raises a clear amount of revenue, which can be used for targeted purposes (R&D for sustainable energy)
or rebated to the public in one way or another, while the revenues from a cap-and-trade system are likely to be
bargained away well before the first trade ever takes place. It’s sometimes claimed that cap-and-trade will lead to
more certain emissions reductions than a tax. In theory this could be true, but in practice it’s likely to be false. In
fact, a cap-and-trade system can be more easily manipulated to allow additional emissions; if the permits become
too pricey, regulators would likely sell or distribute more permits to keep the price “reasonable.” Since the
long-term signals from cap-and-trade are less powerful than a multi-year carbon tax, the behavioral changes (e.g.
choice of the type of power plant) brought about by cap-and-trade could well turn out to be far fewer, as well. Let
me be clear, though. Cap-and-trade is a big improvement over the do-nothing status quo, even if it’s less desirable than a carbon tax. If politicians insist on
cap-and-trade, we shouldn’t let the best be the enemy of the good.
Fred Krupp, president of the Environmental Defense Fund.
President Obama got it exactly right when he called on Congress for a market-based cap on greenhouse gas emissions “to truly transform our economy, to
protect our security and save our planet from the ravages of climate change.”From an environmental point of view, the advantage of an emissions cap over a
carbon tax is clear: A cap puts a legal limit on pollution. A tax does not. Guessing what level of tax might drive the pollution cuts we need to avert runaway
climate change is a risk we simply can’t afford to take. Only a cap with strong emissions reduction targets — and clear rules for meeting them — can
guarantee that we achieve the environmental goal. Cap-and-trade also has the upper hand on the economics. When we create a market that rewards
emissions reductions, we put the vast know-how, manufacturing base, and investment capital of the private sector to work. Nothing can match the immense
resources that the private sector can bring to bear — and nothing beats a cap when it comes to driving sustained investment in the jobs and technologies
that will solve the problem. We know from the EPA that cap-and-trade will mean as little as $98 a year — about a dime a day — for American households.
Those costs are small, but they are real. Fortunately, Congress has options for ensuring that the cap is equitable and that consumers are treated fairly as the
country makes the long-term transition to a low-carbon economy. President Obama has proposed putting revenue generated by the auction of emissions
allowances back into Americans’ wallets. The U.S. Climate Action Partnership, of which the Environmental Defense Fund is a member, has a blueprint for
legislation that would enable regulated energy suppliers to offset costs for consumers. The bottom line is that cap-and-trade gives us an affordable](https://image.slidesharecdn.com/33964e0d-f6bf-4a01-b800-ecf75306434d-160207051202/85/February-Carbon-Tax-Brief-compressed-11-320.jpg)
![environmental guarantee that you can’t get with a tax. The dime a day we’ll spend is the hardest working dime in America: It cleans the air, reduces our oil
dependence, creates jobs, and averts a looming environmental crisis.
Roger A. Pielke Jr., professor of environmental studies at the University of Colorado.
Cap-and-trade is doomed to failure. It might lead to some new and substantial revenues for the government, but it can never succeed at
limiting carbon dioxide emissions. The reason is very simple: A hard cap on emissions would inevitably lead to
increases in the costs of energy, which will lead to increasing costs throughout the economy. If these costs are felt
by consumers (which is of course what such a policy is designed to do) then they will complain. No elected official
will want unhappy constituents, so they will work hard to help people avoid the increasing costs. This fundamental
political reality will consequently turn the theory of a hard cap into the practice of a very soft cap that has
backdoors and safety valves that allow the cap to be evaded in order to reduce the effect on costs, ultimately
defeating the purpose of the policy. Putting a price on carbon, however, makes good sense. A straight carbon tax —
at whatever level would be politically acceptable — is a far better place to start than with a fully gamed
cap-and-trade system. The point of such a tax would not be to change behavior, but to start the process of pricing
carbon directly and to raise some significant revenue for clean-energy investments. Some experts suggest that $5-per-barrel oil
tax would not be noticed by consumers but would raise $500 billion over five years to fund investments in a new green economy. With progress in
de-carbonizing the economy, a steadily rising carbon tax should be politically possible, thereby creating a virtuous
circle where the price of carbon rises with — and reinforces — progress made in increasing energy efficiency and
expanding the role of carbon-neutral energy sources. With Exxon Mobil supporting a low carbon tax, I reject the
contention by some who argue that a carbon tax is politically impossible. Cap-and-trade is a big, fat political mess
that cannot succeed in reducing emissions, but can lead to lots of benefits to many special interests. Hence it has
many champions. A straight carbon tax, applied upstream in the energy economy, is a much preferable approach to
help bring about the long-term de-carbonization of the global economy.
Eleanor Revelle [League of Women Voters] CapandTrade Versus Carbon Tax: Two
Approaches to Curbing Greenhouse Gas Emissions
COMPARING THE TWO APPROACHES
A cap-and-trade system and a carbon tax are both market-based policy instruments that create incentives to reduce carbon emissions. A cap-and-trade
system is a quantity-based instrument; it fixes the total quantity of emissions and allows the price of energy and energy-related products to fluctuate
according to market forces. A carbon tax is a price-based instrument; it fixes the price of carbon-based energy and allows emissions levels to vary according to
economic activity.
Emissions certainty
The strength of the cap-and-trade approach is that it can set firm limits on emissions. The cap is set at a level designed to achieve a desired environmental
outcome (e.g., reduction of emissions to 80 percent of 1990 levels by 2050), and individual companies have the flexibility to choose how they will achieve
their emissions targets. (A "flexible cap" approach, on the other hand—one that includes a safety valve feature, for example—would no longer provide
certainty that emissions reduction targets will be met.) A carbon tax does not guarantee achievement of a particular emissions target. It allows the quantity of
emissions to fluctuate as the demand for energy rises or falls. Allowing emissions to vary from year to year gives firms the flexibility to abate less and pay
more in taxes when abatement costs are unusually high (and vice-versa when abatement costs are low). The tax could be designed to rise steadily over time
to achieve a certain stabilization target (e.g., a concentration of atmospheric CO2 of 450 ppm by 2100).
Price predictability
The advantage of a carbon tax is that it can fix the price of carbon emissions. It creates a permanent incentive to
reduce emissions, and if set at the appropriate level, it encourages investment in alternative fuels and
energy-efficient technologies that have high up-front costs. Under a cap-and-trade system, the price of emissions
permits may vary considerably from year to year. An especially cold winter, for example, or sudden growth in a
particular industry could increase the demand for energy and cause a spike in the price of permits. This potential
volatility could have a disruptive effect on markets for energy and energy products and could make business
planning more difficult. Both major cap-and-trade programs in existence today—the Acid Rain Program and the
European Union's Emissions Trading Scheme (ETS)—have experienced significant volatility in the price of emissions
permits. In the case of the Acid Rain Program, SO2 prices fluctuated considerably in the early years of the program
and then spiked dramatically in 2004-2005, despite a large bank of allowances. During the three-year ETS trial
period (2005-2007), allowance prices that were initially high dropped precipitously in April 2006—after it was
discovered that emissions were significantly lower than expected, causing the demand for allowances to plummet.16
Environmental effectiveness
The effectiveness of a cap-and-trade system depends on a variety of design features. (1) How stringent is the emissions reduction timetable? Will reductions
be deep enough to have a meaningful impact on climate change? (2) How will baseline emissions be measured and a corresponding and appropriate number
of emissions permits be determined and distributed? (3) Will the cap be applied economy-wide or to only certain sectors or sources? (4) What types of
cost-control measures, if any, are included? Are they set high enough to spur investment in clean energy technologies? (5) Will any revenues be generated?
Will any portion of these be invested in energy efficiency and low-carbon technologies? Similar issues must be addressed in designing a carbon tax system,
such as whether a credible commitment has been made to keep the tax in place, whether exemptions will be granted to certain sectors or industries, and](https://image.slidesharecdn.com/33964e0d-f6bf-4a01-b800-ecf75306434d-160207051202/85/February-Carbon-Tax-Brief-compressed-12-320.jpg)
![how revenues will be used. Basically, however, the effectiveness of the tax depends in large part on whether the tax rate is set high enough to create real
market incentives that lead to developing and adopting climate-friendly technologies. An economy-wide tax that is scheduled to rise steadily over time sends
a consistent and long-term price signal that encourages investment in clean energy technologies and energy efficiency.
Equity
Both a carbon tax and a cap-and-trade system raise the cost of products like electricity and gasoline. These price increases would disproportionately affect
lower-income households inasmuch as they spend a larger percentage of their income on energy products than do higher-income households. The way in
which the two regulatory systems handle any revenues they raise would determine the extent to which each is able to reduce this disparity. A carbon tax
directly raises substantial revenues. If the revenues were rebated equally to all citizens or used to reduce regressive
taxes (e.g., the federal payroll tax), it would return more money (in rebates or tax savings) to lower-income
households (and to people who take steps to reduce their energy consumption) than they would pay in carbon
taxes. In contrast, wealthier households, which use more energy on average (flying, driving, living in big houses),
would pay more in carbon taxes than they would receive in rebates or tax savings.17 Similarly, a cap-and-trade system that
auctioned permits to the capped entities would generate sizable revenues that could be rebated to citizens or used to reduce other taxes, thereby offsetting
the regressive effects of higher energy prices. Free distribution of the permits, on the other hand, could lead to significant windfall profits for the firms
receiving the permits. Research indicates that only a modest portion of the allowance value—less than 15 percent—is needed to compensate for the cost of
meeting the cap. The remainder would be passed along in higher prices to consumers "downstream."18
Simplicity and transparency
A cap-and-trade system would require a new administrative structure—a system to allocate emissions permits, markets where firms can buy and sell those
permits, and a means of monitoring emissions and trades. Free permit allocation would make it difficult to estimate the economic impact of the
cap-and-trade system on consumers and industries. Auctioning permits, on the other hand, would create a clear carbon price signal and provide greater
transparency to the system.19 A carbon tax could build on the well-developed administrative structure of existing taxes, such as the current excise taxes on
coal and petroleum.20 A tax based on BTU heat units—already standardized and quantifiable—would fairly reflect the carbon content of each type of fuel.21
The underlying premise of a carbon tax—that the price of energy and energy-intensive products should include the environmental costs associated with their
production and use—is transparent and readily understood
3. Robust economic analysis uncovers several comparative benefits of
carbon taxes over cap‐and‐trade
Lawrence Goulder and Andrew Schien [Stanford University] Carbon Taxes Versus Cap And Trade: A
Critical Review](https://image.slidesharecdn.com/33964e0d-f6bf-4a01-b800-ecf75306434d-160207051202/85/February-Carbon-Tax-Brief-compressed-13-320.jpg)
![REDUCES INEQUALITY
1. Leveraging a carbon tax experimentally leads to a decrease in
inequality that is reflected both by raw data and by the Gini index
Yazid Dissou and Muhammad Shahid Siddiqui [University of Ottawa] Carbon Taxes and Inequality
In this paper, we have investigated the incidence of pollution control policies on households’ income while incorporating equivalent incomes as the household
welfare metric and concentration indices as the decomposition method of illustrating inequality by components. The strength of equivalent incomes, for this
analysis, rests on their incorporation of both commodity and factor prices, while the concentration ratio approach allows for an assessment of the
contribution of each component of equivalent incomes to total inequality. The main focus of this paper has been to develop a methodology to disentangle
the components of the source and use sides of households’ equivalent incomes and to examine the continuation of individual factors in the total incidence of
a pollution tax policy. We have developed a multi-sector, multi-household general equilibrium model of the Canadian economy to assess the distributional
impact of a GHG mitigation policy in Canada by using a carbon tax as the policy instrument. The simulation results are then used to calculate the
concentration indices of the components of equivalent incomes. In calibrating the model to different carbon tax levels, our CGE results suggest strong impacts
of pollution control policies on relative factors and commodity prices. On the income-side, a carbon tax reduces both the wage rate and the rental rate on
capital. However, the capital earnings are more heavily affected than the wages as the ratio of the rental rate of capital to the wage rate declines
monotonically when we switch from a low (e.g., $15) to a high (e.g., $100) carbon tax. On the use-side, a carbon tax reduces the consumer prices of non
energy-intensive goods, while it increases the consumer prices of energy intensive goods relative to their BAU levels. However, due to a strong impact on
energy prices, the composite price of all commodities, on average, is monotonically increased with an increase in the carbon tax. The CGE results have also
addressed the impacts of post-policy variations in factor and commodity prices across 100 household groups. The results show that the post-[carbon
tax] decline in relative factor prices have higher negative impacts on upper quintile groups because they derive a
larger share of their income from capital earnings source in comparison to lower quintile groups. On the other
hand, the impact of a change in energy prices seems to have a relatively stronger effect on low income groups than
the higher income groups as the former spend more of their total expenditure on energy related goods than the
latter. Finally, we have analyzed the issue of income distribution by using the Gini index as an inequality measure. Our
estimation shows that the Gini values of variations in equivalent incomes decline as carbon prices increase,
implying that the overall impact of a pollution tax on household’s equivalent incomes is progressive. We have
decomposed total inequality by components of factor and commodity prices. Our estimates show that the incidence of a pollution tax
on relative factor prices accounts for a decline in the Gini coefficient, while its incidence on relative commodity prices accounts for
an increase in the Gini coefficient. In further decomposing the incidence on the above-mentioned relative prices, we find some interesting results. On the
income side, the inequality through wage earnings represents a U-shaped curve, as it changes from a progressive to a mild regressive impact when the carbon
tax levied exceeds a certain level, which in our numerical example is $90. On the other hand, the inequality through capital earnings declines monotonically
with an increase in the carbon tax. The overall impact through relative factor prices, nonetheless, is progressive. On the expenditure side, the
incidence of energy prices on household distribution is regressive. An interesting point is that the inequality through non-energy prices is also regressive as it
increases when we move from a low to a high carbon price, implying that the overall impact of a change in commodity prices is more concentrated among
the lower income group in the presence of increasing carbon prices. However, due to a stronger incidence from factor prices, the joint effects of factor and
commodity prices cause the overall impact of carbon prices on household’s equivalent incomes to be progressive. These findings suggest that the traditional
approach of assessing the impact of carbon taxes on inequality through changes in commodity prices alone may be misleading. Certainly, there are avenues to
undertake further research within the decomposition framework we discussed in this paper. There are several social, demographic, and economic factors,
which can be incorporated into this study. For example, the labour income can be categorized into different occupation groups or skilled/unskilled categories.
One can also introduce alternative policies of emissions and revenue allocations, as discussed by Rausch et al. (2009), within our analytical framework.
2. A carbon tax hits the wealthy hardest
Polly Cleveland [The Institute for Policy Studies] Taxing Carbon is Like Taxing Diamonds
In general, sales taxes are indeed regressive; moreover, as I recently argued, sales taxes are partly “passed back” onto suppliers, hitting small businesses
hardest. But wait… Imagine that we impose a sales tax on diamonds. Would we worry about the burden on middle class purchasers of one-fourth-caret
engagement rings? What about the part of the tax “passed back” onto the DeBeers Group? Not much sympathy for global monopolists either. Surprisingly, a
carbon tax would operate much like a diamond tax, for reasons both of demand and supply. Demand: The wealthy actually consume a
disproportionate amount of carbon. Discussions of a carbon tax usually focus on the price of gasoline. One gallon of](https://image.slidesharecdn.com/33964e0d-f6bf-4a01-b800-ecf75306434d-160207051202/85/February-Carbon-Tax-Brief-compressed-14-320.jpg)
![gas produces about 17 pounds of CO2. One metric ton is 2204 pounds. So a $100 tax on a ton of CO2 comes to
$0.77 per gallon—a significant cost to low-income commuters and small truckers. But the very poor don’t drive or
travel or occupy much space; the rich fly planes, including private jets; drive to low-density suburbs; occupy and
heat multiple houses and hotels; and buy lots of stuff. Clearly the rich consume much more carbon per capita than
the poor. Supply: Sellers and buyers of goods differ in their sensitivity to price changes; the greater the sensitivity, the more they can avoid a tax by selling
or buying less. Economists call this sensitivity elasticity of supply or demand; they measure it as the percent change in quantity sold or bought in response to
a one percent change in price. Demand elasticity for oil is low, about 0.5; so a 1% increase in oil price would cause a 0.5% decrease in consumption. That
makes sense, since in the short run, it’s hard for people to cut energy consumption, especially if they must drive to work. But, though numbers are hard to
come by, elasticity of supply is much, much lower, for two reasons. First, oil production takes decades and billions in capital investment; producers cannot
quickly increase or decrease supply. Second, oil producers form an international cartel, an organized mega-monopoly, which holds down production to drive
up prices. Since they’re already charging what the traffic will bear, they can’t much raise prices to cover a tax. As economists long ago figured out, buyers and
sellers share a tax in inverse proportion to elasticity. Therefore, if supply elasticity of carbon is, say, 0.1, while demand elasticity is 0.5, the suppliers will pay
five times as much of the tax as consumers. That reduces that $0.77 per gallon gas tax to only $0.13. Moreover, precisely because most of the tax
falls on suppliers, it will generate plenty of revenue to help those unfortunate long-distance commuters and small
truckers, to build more public transportation, to invest in renewable energy, and even to cut super-regressive taxes
like the payroll tax. Who owns the suppliers, anyway? According to Edward Wolff, in 2007, the top 1% in the US
owned 43% of non-home wealth, mostly securities, including of course energy company stocks and bonds. The top
10% of wealth holders owned 83%. The same folks who own DeBeers also own Exxon, Shell, and BP. A May 2013 federal study of the Social Cost
of Carbon estimated costs of additional CO2 emissions for 2010 to 2050 ranging from $27 to $221 per metric ton in 2050, depending on assumptions. I think
these numbers are low; in any case they tell us how much consumers and producers would have to compensate society for damage—not how much a tax of
that size would reduce emissions. Given the low elasticity of supply and demand, it might take a pretty whopping tax to keep our grandchildren medium rare.
So we have good news and bad news. Good news: the cost of reducing carbon emissions will fall hardest on the 1%, who
consume the most energy and own the energy companies. Bad news: ditto. Expect a fight!
3. A progressive tax solves for any regressive effects of a carbon tax and
reduces inequality below the starting point before the tax is levied
David Klenert, Gregor Schwerhoff, Ottmar Edenhofer, and Linus Mattauch [Potsdam Institute for
Climate Impact Research] Carbon Taxation, Inequality and Engel’s Law – The Double Dividend of
Redistribution
Empirical evidence shows that low-income households spend a high share of their income on carbon-intensive goods. This observation gives reason to the
concern that carbon taxation could have strong regressive effects. By modeling a subsistence level of carbon-intensive consumption, we show that the direct
incidence of carbon taxation is indeed regressive. We then proceed within a Mirrleesian framework to identify the optimal recycling of the carbon revenue,
taking into account distributional aspects. The regressive effect of carbon taxes can be mitigated by a progressive income tax
reform, financed by the carbon tax revenue. When inequality is at a suboptimally high level, a progressive income tax reform
does not just offset the regressive effect of carbon taxation, it reduces inequality even below the initial suboptimal
level. We call this effect the double dividend of redistribution. Furthermore we find that the optimal carbon tax level depends on the
way carbon revenues are recycled: progressive recycling leads to higher optimal levels of carbon taxation.
4. A long‐run analysis of a carbon tax uncovers that its regressivity is
neutralized
Kevin Hassett, Aparna Mathur, and Gilbert Metcalf [American Enterprise Institute] The Incidence of a
U.S. Carbon Tax: A Lifetime and Regional Analysis
This paper measures the incidence of carbon taxes using a lifetime incidence framework. We analyze the household burden of a $15 per metric ton tax on
CO2 in constant 2005 dollars at three different points in time. The burden is measured ranking households by current income, current consumption and
lifetime consumption as the basis for the incidence measures. The methodology involves first working with the economy-wide Input-Output tables from the
Bureau of Economic Analysis to assess how the $15 tax would affect the industrial sector, in particular the prices of energy goods and other industrial goods
in which these energy goods serve as inputs. We then use this information to calculate the increase in prices of consumer goods as a result of the tax. Once
we obtain the price increase in 42 categories of consumer goods, we calculate the burden of the tax on households using consumption data from the
Consumer Expenditure Survey. As the paper discusses, energy taxes have different incidence effects across the lifecycle. Therefore,](https://image.slidesharecdn.com/33964e0d-f6bf-4a01-b800-ecf75306434d-160207051202/85/February-Carbon-Tax-Brief-compressed-15-320.jpg)
![DEFICIT REDUCTION
1. A carbon tax would provide revenue for deficit reduction
Sebastian Rausch [MIT] Carbon Tax Revenue and the Budget Deficit: A WinWinWin Solution?
Bush-era tax cuts are scheduled to expire at the end of 2012, leading to interest in raising revenue through a carbon tax. This revenue could be
used to either cut other taxes or to avoid cuts in Federal programs. There is a body of economic research suggesting that such an
arrangement could be a win-win-win situation. The first win—Congress could reduce personal or corporate income
tax rates, extend the payroll tax cut, maintain spending on social programs, or some combination of these options.
The second win—these cuts in income taxes would spur the economy, encouraging more private spending and
hence more employment and investment. The third win—carbon dioxide (CO2) pollution and oil imports would be
reduced. This analysis uses the MIT U.S. Regional Energy Policy (USREP) model to evaluate the effect of a carbon tax as part of a Federal budget deal. A
baseline scenario where temporary payroll cuts and the Bush tax cuts are allowed to expire is compared to several scenarios that include a carbon tax starting
at $20 per ton in 2013 and rising at 4%. We find that, whether revenue is used to cut taxes or to maintain spending for social
programs, the economy is better off with the carbon tax than if taxes remain high to maintain Federal revenue. We
also find that, in addition to economic benefits, a carbon tax reduces carbon dioxide emissions to 14% below 2006
levels by 2020, and 20% below by 2050. Oil imports remain at about today’s level, and compared to the case with
no carbon tax, are 10 million barrels per day less in 2050. The carbon tax would shift the market toward
renewables and other low carbon options, and make the purchase of more fuel-efficient vehicles more
economically desirable.
2. This revenue would lead to substantial deficit reduction
Jonathan L. Ramseur [CRS] Carbon Tax: Deficit Reduction and Other Considerations
Carbon taxes have been proposed for many years by economists and some Members of Congress, including in the 112th Congress. If Congress were to
establish a carbon tax, policymakers would face several implementation decisions, including the point and rate of taxation. Although the point of taxation
does not necessarily reveal who bears the cost of the tax, this decision involves trade-offs, such as comprehensiveness versus administrative complexity.
Several economic approaches could inform the debate over the tax rate. Congress could set a tax rate designed to accrue a specific amount of revenues.
Some would recommend setting the tax rate based on estimated benefits associated with avoiding climate change impacts. Alternatively, Congress could set a
tax rate based on the carbon prices estimated to meet a specific GHG emissions target. Carbon tax revenues would vary greatly depending on the design
features of the tax, as well as market factors that are difficult to predict. One study estimated that a tax rate of $20 per metric ton of
CO2 would generate approximately $88 billion in 2012, rising to $144 billion by 2020. The impact such an amount
would have on budget deficits depends on which budget deficit projection is used. For example, this estimated
revenue source would reduce the 10-year budget deficit by 50%, using the 2012 baseline projection of the
Congressional Budget Office (CBO). However, under CBO’s alternative fiscal scenario, the same carbon tax would
reduce the 10‐year budget deficit by about 12%. When deciding how to allocate revenues, policymakers would encounter key trade-offs:
minimizing the costs of the carbon tax to “society” overall versus alleviating the costs borne by subgroups in the U.S. population or specific domestic
industries. Economic studies indicate that using carbon tax revenues to offset reductions in existing taxes—labor, income, and investment— could yield the
greatest benefit to the economy overall. However, the approaches that yield the largest overall benefit often impose disproportionate costs on lower-income
households. In addition, carbon-intensive, trade-exposed industries may face a disproportionate impact within a unilateral carbon tax system. Policymakers
could alleviate this burden through carbon tax revenue distribution or through a border adjustment mechanism. Both approaches may entail trade concerns.
3. There is significant need to address the current deficit
Carla Fried [CBS MoneyWatch] 4 Critical Reasons Why You Should Care About the Budget
Deficit
1. "We are running the risk of debt growing larger than the economy." Those are the exact words uttered by former Senator and BPC member Tom Daschle
when he kicked off the release of the BPC deficit reduction plan. That's not some dramatic political posturing; it's just the cold and sobering facts.](https://image.slidesharecdn.com/33964e0d-f6bf-4a01-b800-ecf75306434d-160207051202/85/February-Carbon-Tax-Brief-compressed-17-320.jpg)
![The standard way to measure the impact of our federal debt is to look at it relative to the country's Gross Domestic Product (GDP). Before the financial crisis,
our federal debt as a percentage of GDP was motoring along at 40 percent, not too much worse than the long-term average of 36 percent. This year,
however, the Congressional Budget Office (CBO) projects our debt will reach 62 percent of GDP. If we just sit on our
hands and do nothing, the CBO predicts that our debt will hit 90 percent of GDP by 2020, and eventually surpass
total economic output in 2025. By 2037, the debt would exceed 200 percent of GDP.
The BPC deficit reduction plan lays out the lovely fact that in 2020, the federal government will owe $1 trillion in
interest payments on our federal debt; that represents 17 percent of all our spending. "Viewed another way, the
federal government will have to allocate about half of all income tax receipts to pay interest, and interest payments
will exceed the size of the defense budget," is how the BPC puts it. Check out the BPC graphic below; the blue "Net Interest" payments are
what we will be shelling out to pay our debts. Other than Medicare and Medicaid (that's a topic for another day), our national debt will be the
fastest-growing problem.
2. Once federal debt exceeds 90 percent of GDP, history tells us growth slows dramatically. Ken Rogoff and Carmen
Reinhart are former IMF honchos and well-respected economic academics who wrote 2009's influential This Time is
Different that chronicles hundreds of years of global financial crises. The duo recently released a study that found
that once a developed country's debt exceeds 90 percent of GDP, its economic growth takes a serious hit. (Just a
reminder: we're currently scheduled to hit that figure by 2020). In their study, Growth in a Time of Debt, they write that:
"Over the past two centuries, debt in excess of 90 percent [of GDP] has typically been associated with [average]
growth of 1.7 percent, versus 3.7 percent when debt is low (under 30 percent of GDP)."
If you want to see our economy grow at a stronger pace, you should be rooting for Washington to figure out a way to reduce our debt. The BPC plan aims to
keep the long-term ratio at its current 60 percent level.
3. High debt loads make it more expensive to borrow and weaken our global position. The CBO recently weighed in on the
long-term impact of carrying around a whole lot of debt, saying that "if debt continued to rise rapidly relative to GDP, investors at some point would begin to
doubt the government's willingness to pay interest on that debt."
Now no one is suggesting the U.S. would default on its debt; that's not what's at play here. The more pressing problem is that those investors -- China, Japan,
and the other foreign countries that currently own about half of our federal debt -- would insist on getting paid more interest to keep financing our debt.
That's exactly what is happening in Europe right now; Ireland's bond yields have jumped amid its ongoing debt crisis and just yesterday Portugal saw the yield
on a new 1-year government bond pop up to 4.8 percent, compared to 3.3 percent on an offering from two weeks ago.
If we end up needing to lift our interest rates well beyond their historic norms, that's nothing but bad news for our economy and for jobs. At Wednesday's
BPC press conference, former Senator Pete Dominici, co-head of the group's Debt Reduction task force, repeatedly referred to the debt as our nation's "quiet
killer" and referenced an earlier statement from Joint Chiefs of Staff Chairman Mike Mullen that our nation's debt is "the single biggest threat to our national
security."
4. Kicking the deficit can down the road makes it even worse. There is no question Washington has an overabundance of issues to juggle right now, and in the
prioritizing process it's always natural to put your short-term worries up top and push the longer-term problems far down the to do list. But running away
from our debt and deficit problem is just going to make the eventual solution even more costly to all of us.
The General Accountability Office (GAO) has a handy calculation that measures how much we would need to increase taxes and reduce spending to bring our
revenue in line with spending (not just money spent on servicing our debt, but all our spending). In its latest "fiscal gap" calculation, the GAO estimates that if
we attacked the problem today, it would take either a 52 percent increase in revenue (i.e., taxes), or a 35 percent decrease in non interest-related spending.
But if we wait until 2020 to tackle the problem, we'd need either a 62 percent increase in revenues, or a 40 percent cut in spending. That's quite an
expensive trade-off for doing nothing today. And as the GAO points out, putting off action also raises the pain factor:
"The longer action to deal with the nation's long-term fiscal outlook is delayed, the greater the risk that the eventual changes will be disruptive and
destabilizing."](https://image.slidesharecdn.com/33964e0d-f6bf-4a01-b800-ecf75306434d-160207051202/85/February-Carbon-Tax-Brief-compressed-18-320.jpg)

![OUTSOURCING EMISSIONS
1. What are outsourced emissions?
[The Guardian] What are 'outsourced emissions'?
The standard way of measuring a nation's carbon footprint is to add up the greenhouse gas emitted each year
within its borders, plus – in a more comprehensive analysis – a proportion of the emissions from the ships and planes bringing people and products
into and out of the country. This approach has the advantage of being methodologically simple, but it means that
emissions caused in the process of manufacturing or growing an item are assigned to the country where that item
is produced, rather than the country where it is consumed. This, many commentators argue, is unfair, because it allows rich
countries to claim that they are reducing their emissions when in fact they're just "outsourcing" them – relying
increasingly on emerging economies such as China for carbon-intensive manufacturing processes. One 2009 study
suggested that 50% of the rise in Chinese emissions are the result of manufacturing goods for foreign markets. And a number of reports have
estimated that emissions cuts made in the UK and many other developed countries – including those cuts claimed
as successes under the Kyoto protocol – are more than cancelled out by the rise in emissions embodied in imported
goods. One of the challenges with measuring national carbon footprints by "consumption" as opposed to "production" is that it would be difficult to track
imported and exported emissions for the whole world with a high level of accuracy (the best international dataset, published in 2011, is available here). Even
if perfect and up-to-date data were available, however, a question would remain about whether it would be correct to assign all the responsibility for
manufacturing emissions to the consumer nations. Some commentators argue that the responsibility should in fact be shared, given that countries such as
China benefit economically from their export industries.
2. Applying a cost to carbon results in polluters moving elsewhere to
pollute
Rahel Aichele [University of Munich] Kyoto and Carbon Leakage: An Empirical Analysis of the
Carbon Content of Bilateral Trade
We have developed a gravity model for carbon embodied in trade. Stricter domestic climate policies reduce domestic emissions but
may raise them elsewhere as consumers switch suppliers. This phenomenon – carbon leakage – is equivalent to
more emissions embodied in imports and less emissions embodied in exports. Therefore we suggest to test for carbon leakage
with a gravity-type equation for CO2 embodied in trade within a novel data set of bilateral sectoral carbon flows embodied in trade flows. When
implementing this test for carbon leakage one has to acknowledge that commitment in the Kyoto Protocol might not be random. The structure of our data
allows us to use country-and-time effects to control for self-selection into treatment. Furthermore, it also allows us to control for country-pair specific
unobserved heterogeneity in carbon imports and exports. We show that carbon leakage is empirically relevant. Our within
estimations imply that sectoral carbon imports of a committed country from an uncommitted exporter are about
8% higher than if the country had no commitments. The carbon intensity of those imports is about 3% higher. The
empirical evidence also hints at technological cleaning-up in Kyoto countries. Sector-by-sector regressions show that some sectors
are more prone to carbon leakage than others. Note that the finding of increased carbon imports of committed importers from non-Kyoto countries is a
necessary and sufficient condition for the existence of carbon leakage. Nevertheless, we cannot compare our estimates with the carbon leakage measures
obtained in CGE studies. To this end, we would need an estimate of the average Kyoto country’s emission savings due to its climate policy. Due to the
problem of self-selection into treatment, this causal relationship is not easily uncovered in an econometric setup. The inclusion of country-and-time effects is
no feasible option for this problem since this makes identification of the coefficient of interest impossible. A convincing instrumental variable approach for
membership in the Kyoto Protocol would be needed. This is beyond the scope of the present paper.35 Nevertheless, our results suggest that the issue of
carbon leakage is a serious challenge to international climate saving programs. Since a multilateral agreement that commits all countries to binding emission
targets does not exist and looks increasingly unlikely, the first-best policy to combat climate change, namely a world-wide cap on emissions, is not feasible.
Policymakers in the European Union and the U.S. have called for border tax adjustments to tackle the problem. Establishing the empirical relevance
of carbon leakage as a result of unilateral climate policy, our analysis lends support to these policy positions. Since such taxes pose
important informational problems and may be conceived as protectionist, more research into their design is needed. Before closing, we want to stress that
our empirical strategy was geared toward identifying the average effect of unilateral climate policy. Our empirical results cannot straightforwardly be used for
the simulation of global CO2 emissions as a response to climate policy scenarios, e.g., the potential commitment to an emission cap by the U.S., or the
counterfactual situation of no global climate policy at all. To that end, one would need to use the estimated elasticities in a structural general equilibrium
model. We view this as a challenging but worthwhile avenue for further research](https://image.slidesharecdn.com/33964e0d-f6bf-4a01-b800-ecf75306434d-160207051202/85/February-Carbon-Tax-Brief-compressed-20-320.jpg)
![3. A carbon tax would lead to carbon leakage and emissions outsourcing
Ian Sheldon [The Ohio State University] “Competitiveness, Carbon Leakage, and Border Tax
Adjustments: Might Imperfect Competition Matter?”
In terms of competitiveness, if a country such as the United States unilaterally implements a carbon tax or some
type of emissions trading scheme, this will impact negatively the relative costs of domestic firms, which in turn will
constrain their ability to compete with imports from other countries with less stringent climate policies. While
competitiveness of firms is a difficult concept to define, it would typically be thought of in terms of their ability either to maintain market share and/or
profits. As the WTO/UNEP (2009) report notes, the competitiveness of industries subject to domestic climate policies will be a function of multiple factors,
including: first, the specific characteristics of an industry such as market structure, industry technology, the extent of import competition, and the incidence of
any explicit/implicit carbon price; and, second, the exact design of the domestic climate policy; and the design of other countries‟ climate policies. Related
to the expected impact of domestic climate policies on competitiveness is the issue of carbon leakage, which can be
thought of as the possibility that output of energy-intensive industries will either increase in, or production will
relocate to countries that have less restrictive climate policies. Essentially, a wedge will exist between the price of carbon in countries,
that either do not implement domestic climate policy or impose lower caps on carbon emissions, and countries that implement considerably tougher climate
policies. This lack of an international carbon price is expected to have two effects: first, carbon havens may develop in
those countries where less restrictive climate policies will attract carbon-intensive industries, resulting in globally
inefficient production of a public bad; second, the possibility of capital flight through relocation of industries to
countries with a lower carbon price will result in job losses in countries with a higher carbon price.
4. Why outsourcing emissions is harmful
Due to the fact that CO2 emissions will occur in one location or another despite the
implementation of a carbon tax, there can be no benefit to overall emissions because
emissions will continue to pollute the earth's environment and contribute to global
climate change. A carbon tax will succeed in incentivizing the outsourcing of industries
and jobs for economic reasons, leaving the United States with less jobs and a worse
economic situation while still having the issue of climate change to deal with.](https://image.slidesharecdn.com/33964e0d-f6bf-4a01-b800-ecf75306434d-160207051202/85/February-Carbon-Tax-Brief-compressed-21-320.jpg)
![EMISSIONS TRADING IS A
PREFERABLE STRATEGY
1. What is emissions trading?
[Guardian] What is emissions trading?
Emissions trading is a market-based approach to controlling pollution. By creating tradable pollution permits it attempts to add the
profit motive as an incentive for good performance, unlike traditional environmental regulation based solely on the threat of penalties. Developed in the 70s
and 80s, emissions trading was introduced in the US in 1990 to combat acid rain, but more recently it has grown in prominence as a way of tackling
greenhouse gas emissions linked to climate change. The main form of emissions trading is known as "cap and trade": a cap on
emissions is set and then permits are created up to the level of this cap. The companies or other entities covered
by the scheme need to hold one permit for every tonne of pollution (CO2e) they emit. Allowing a trade in these
permits puts a price on pollution – the cost of emitting one tonne of carbon dioxide is the cost of the permit – and
creates flexibility as to how and where pollution is reduced. The theory is that setting a limit on pollution and allowing the market to
decide how to stay within that limit is ideally suited to reducing carbon emissions, which come from almost all forms of economic activity and mix into the
atmosphere with global effect. The market should ensure that the emissions cuts happen at the lowest possible cost, and the cap can be lowered year by year
in a managed way
2. Emissions trading has reduced emissions in the EU
Jan Abrell [TU Dresden] ASSESSING THE IMPACT OF THE EU ETS USING FIRM LEVEL DATA
The purpose of this study was to shed light on the effect of the EU ETS at firm level. We have used a sample of 2101 European firms
covered by the ETS to study the effectiveness of the ETS during its first phase and the beginning of its second
phase, and its impact on company performance. We find evidence that the ETS in the second phase led to a
reduction in emissions. We also demonstrate that two sectors (non-metallic minerals and basic metals) contributed most to the reductions, while the
electricity and heat sectors did not at all. Furthermore, we find that initial allocation and ex-post emissions are correlated. The most plausible explanation is
that carbon markets deviate from the idealised market conditions assumed in the Coase theorem. Limited market liquidity and the high concentration of
initial allocation might be two of the deviations from Coase's assumptions responsible for the effect we found of allocation on emissions.
3. Emissions trading does not negatively impact the private sector
Jan Abrell [TU Dresden] ASSESSING THE IMPACT OF THE EU ETS USING FIRM LEVEL DATA
Analogous to previous studies on the competitiveness effects of the EU ETS (Demailly and Quirion, 2008; Anger and Oberndorfer, 2008), we found that being
subject to the ETS did not significantly affect profits, employment or added value during the first phase and the
beginning of the second phase. When we conducted analyses on different groups (under- versus over-allocated firms, sectoral analysis) we find
that certain sectors (eg non-metallic minerals) are disproportionately affected. These results have to be interpreted with caution as our counterfactual (similar
companies from non-regulated sectors) is far from perfect. Also, we have to note that this analysis only deals with the effect on companies under regulation
and thus completely ignores the effects on indirectly affected industries (eg, electricity-intensive companies). Various refinements and extensions are
desirable. Including more years of the ETS could increase confidence in the results and help to capture longer-term effects (such as investments). Analysing
the endogeneity of allocation in the second phase could help to disentangle the strategic mitigation behaviour of firms in the first phase
4. The EU ETS has achieved immediate and significant emissions
reductions at minimal cost.
Lucas Merrill Brown [Environmental Defense Fund] The EU Emissions Trading System](https://image.slidesharecdn.com/33964e0d-f6bf-4a01-b800-ecf75306434d-160207051202/85/February-Carbon-Tax-Brief-compressed-22-320.jpg)
![Independent studies at the regional, national, and firm levels have confirmed that the EU ETS has been a significant
contributor to the reduction in European emissions, independent of the effects of the 2009 recession.7 Despite the
modest ambitions of the EU ETS Phase I (2005–2007), the data suggest that from 2005 through 2007, the ETS reduced carbon emissions by 120
million to 300 million metric tons, or roughly 2–5% below the “business-as-usual” scenario.8 Phase II coincided with the
global economic recession but introduced tighter emissions targets and achieved additional reductions of approximately 340 million metric tons in its first two
years (2008–2009), or roughly 8% below projected business-as-usual emissions.9 Overall, from 2005 to 2009, these estimates indicate that the ETS was
responsible for reductions of more than 480 million tons of carbon dioxide (CO2), which is greater than the entire 2009 CO2 emissions of Mexico or
Australia.10 And while the economic recession has hit some European member states particularly hard, the ETS has succeeded in helping to decouple
emissions growth from economic growth even in those European countries where growth has continued.11 These emission reductions have
come at relatively low cost.12 No negative effects on the overall economy are evident, and even the effects on
energy-intensive sectors such as power, steel, and pulp-and-paper have been minimal.13 By design, cap-and-trade
programs like the EU ETS ensure that emission reduction objectives will be met at the lowest cost.
5. Emissions Trading has cut emissions sooner than expected.
[European Environment Agency] Trends and projections in the EU ETS in 2015
The European Union (EU) Emission Trading System (ETS) covers about 45% of the EU's total greenhouse gas (GHG) emissions. GHG emissions from
the installations included in the ETS decreased by 24% between 2005 and 2014. The emission level reached in 2014
was the lowest since 2005, when the system was launched. It was also lower than the 21% reduction target for the
year 2020. Between 2013 and 2014, emissions of stationary installations decreased by 5%. This latest decrease resulted mainly from a reduction in
emissions from power plants, driven by decreasing use of fossil fuels and a mild winter. At the same time, emissions from industrial activities such as iron,
steel and coke production, as well as from cement, clinker and lime production, increased compared to 2013 levels. Emissions from aviation have also been
covered by the EU ETS since 2012. These emissions increased by 3% between 2013 and 2014. In 2014, ETS emissions exceeded the quantity of ETS emission
credits (allowances) which had been auctioned or freely allocated to operators. It was the first time since 2008 that the demand for EU emission allowances
was greater than the existing supply. This was a direct consequence of the decision to postpone the auctioning of 400 million EU emission allowances (EUAs)
for the year 2014 ('backloading'). Taking into account the additional supply of allowances resulting from the use of international emission credits generated
under the Kyoto Protocol, overall supply and demand of allowances were balanced in 2014. The overall surplus of allowances (accumulated over recent years)
therefore remained at a level of about 2.1 billion EUAs. According to the projections Member States submitted in 2015 under the EU reporting regulation,
with the existing measures in place, emissions from stationary installations under the EU ETS will decrease by 8% between
2015 and 2020, and by 5% between 2020 and 2030 (compared to 2015 levels). In line with this projection, it is anticipated that in 2020 ETS
emissions will stand at least 26% below their 2005 levels, and in 2030 at least 31% below 2005 levels. Most of the projected reductions by 2020 and 2030 are
expected to occur in the sector of energy industries, while emissions from other activities are to remain relatively stable during this period. The European
legislators recently approved the use of a market stability reserve (MSR) from 2019 onwards. The supply of allowances in circulation will be regulated by
transferring surplus allowances into and out of the MSR, based upon a set of predefined rules. By adjusting the supply of allowances to be auctioned, the
MSR is expected to reduce the surplus of allowances available for trading, in order to support carbon prices. Based on national projections of ETS emissions
reported by Member States, the surplus of allowances is expected to start declining in 2015. Taking into account the proposed change in the linear reduction
factor of the ETS cap after 2020 (in order to achieve a 43% reduction of emissions by 2030 compared to 2005), the surplus could be completely absorbed by
the MSR by 2030.
6. Experts agree: Cap‐and‐trade and emissions trading strategies are a
better approach to reducing emissions than a carbon tax
[Yale School of Forestry and Environmental Studies] Putting a Price on Carbon: An Emissions
Cap or a Tax?
Frances Beinecke, president of the Natural Resource Defense Council.
A carbon cap is a more effective approach to solving global warming than a tax. First and most importantly, it sets a
clear goal for emissions reductions. With a tax, we are guessing about how much it will reduce carbon emissions,
and it may not be sufficient to change the course of global warming. A declining cap gives you firm reduction
targets and a system for measuring when you hit them.Second, we have on-the-ground experience in curbing global
warming pollution from cap programs, while the tax model remains entirely untested. Caps are already being used
in the European Union and in 10 Northeastern states. They are underway in California. Both the President and
Congressional leaders are focused on cap-and-trade. Despite the bubble of pundit interest, there is very little
support for a carbon tax among our nation's legislators. Some advocates claim that a tax would be simpler than a
cap. But Congress does not write simple tax bills. When it gets converted into reality, any tax legislation will be](https://image.slidesharecdn.com/33964e0d-f6bf-4a01-b800-ecf75306434d-160207051202/85/February-Carbon-Tax-Brief-compressed-23-320.jpg)
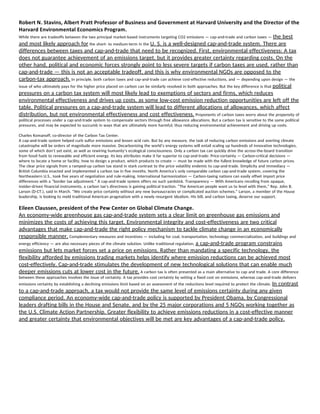
![AUSTRALIAN CARBON TAX WAS A
FAILURE
1. The carbon tax caused a high cost to the consumer
Siondueh D. Burnette [Bard College] A Costbenefit Analysis of the Australian Carbon Tax and the
Economics of Climate Change
Figure 10 reports that Australian electricity prices increased by an average of 17.78 US$ per megawatt hour between the year prior to the carbon tax and the
last year of the tax. Consuming an average of 16.39 megawatt hours annually, Australian electricity consumers spent an average of
343.98 US$ more each year of the carbon tax period. Monthly, this equates to a premium of 28.67 US$ on
electricity during this period.
2. The net economic effect of the carbon tax was very negative
Siondueh D. Burnette [Bard College] A Costbenefit Analysis of the Australian Carbon Tax and the
Economics of Climate Change
Additionally, as can be seen by comparing the calculations of Figure 9 to those of Figure 10, there is no scenario in which the benefits of the
carbon tax outweighs the costs. Utilizing the EPA’s SCC estimates and those of Marten and Newbold, this analysis produces benefits
peaking at 1,138,417,719 US$ while costs estimations total 3,291,323,631 billion US$, or nearly three times that of
benefits.
3. Generally a poor policy
Alex Robson [Griffith University] AUSTRALIA’S CARBON TAX: AN ECONOMIC EVALUATION
Poor policy processes tend to lead to poor policy outcomes. Australia’s carbon tax experience is an interesting case study in how
not to go about implementing climate change policy. Although a number of Australian reports examined the expected economic costs of
the carbon tax, there was never a full cost–benefit analysis of various options. In particular, there was never an assessment of the
incremental net benefits to Australia of limiting emissions relative to those of other measures such as adaptation.
The debate has been framed as a choice between limiting emissions on the one hand and doing nothing on the other. Although a number of official reports
examined the possible costs of the carbon tax, none of them assessed the incremental net benefits of the policy. Instead, proponents (including many
Australian economists) have been content to argue that ‘market mechanisms’ – that is, cap and trade schemes and carbon taxes – are always superior to
direct command and control alternatives.14 This argument, while intuitively appealing, ignores the fact that standard textbook results regarding the relative
efficiency of taxes, emissions caps and other measures depend on a critical but hidden assumption: taxes or caps must be chosen at some ex ante efficient
levels (i.e. where expected marginal benefits equal expected marginal costs). However, if a carbon tax or an emissions cap diverges from its hypothetical, ex
ante efficient level (as is likely in the Australian case), no general conclusions can be drawn regarding the welfare properties of various policy instruments.
Standard public choice considerations make it highly unlikely that the textbook assumption holds in reality. In other words, in a world of government and
bureaucratic failure, the presumed superiority of a market mechanism in which government either determines prices or directly controls the supply side of
the market is just that: a presumption. Unfortunately, in Australia’s case there has never been a full assessment of costs and
benefits of a carbon tax or a cap and trade scheme, or indeed any demonstration that either policy is better than
the other or that either is better than direct command and control alternatives or other policies. Australia’s
experience demonstrates that in the absence of such evidence the case for a carbon tax is severely – perhaps even
fatally – weakened.](https://image.slidesharecdn.com/33964e0d-f6bf-4a01-b800-ecf75306434d-160207051202/85/February-Carbon-Tax-Brief-compressed-26-320.jpg)
![4. A carbon tax decreases competitiveness
[Advanced Energy for Life] World's Largest Carbon Tax Hurts Australia's Ability to Compete
The Australian Carbon Tax is making industries non-competitive and pushing jobs overseas. Burdened with the world’s
largest tax on carbon, Australian export and import companies are paying a high price for public policy that is bad for business and must be reversed.At the
industry level, more than 80 percent of Australia’s merchandise exports have faced the full impact of carbon tax costs since the scheme was launched in
2012. Unless the tax is repealed, Australia’s minerals sector, for example, will incur tax costs of an estimated $25 billion by 2020. The carbon tax is
effectively encouraging Australia mining and manufacturing sectors to shift abroad. According to the Australian
Industry Group (Ai Group) , in its first six months, the Carbon Tax increased energy costs to businesses by an
average of 14.5 percent. At the same time, input prices increased immediately for 61 percent of manufacturing
businesses, 36 percent of services businesses and 52 percent of construction businesses. The impact of this one-two punch is
already being felt. Australia’s second largest exporter, the coal sector, has born additional costs of approximately $1.3
billion in the first 17 months of the carbon tax, adding an extra burden on an industry striving to stay competitive in a fragile global
economy. Environment Minister Greg Hunt introduced legislation to repeal the Carbon Tax in early November 2013, and shortly thereafter the lower House
voted to repeal it. The Carbon Tax can be reversed, and Australia can return to policies that bolster the economy, lower the cost of electricity and improve
the competitive strength of the business and resource sector.](https://image.slidesharecdn.com/33964e0d-f6bf-4a01-b800-ecf75306434d-160207051202/85/February-Carbon-Tax-Brief-compressed-27-320.jpg)
![ECONOMIC HARMS
1. Projected impact to the US
David W. Kreutzer [The Heritage Foundation] The Impacts of Carbon Taxes on the U.S. Economy
Testimony before Committee on Finance United States Senate
Hydrocarbon fuels provide 85 percent of energy in the U.S. So, a tax on carbon-dioxide will drive up energy costs.
These higher energy costs work their way through the economy raising costs of production, reducing income and
reducing employment. Analyses by both The Heritage Foundation and the Energy Information Administration
project impacts of carbon taxes that show employment losses exceeding 1,000,000 jobs and income losses (GDP)
exceeding a trillion dollars by 2030.
Taxes have two general categories of costs. The first is the tax revenue, called the direct burden in economic jargon. The second is the cost imposed by the
tax’s price distortions, called the excess burden in economic jargon. A simple (if extreme) example will illustrate these different impacts. Suppose there is a
$3,000,000 per gallon tax imposed on dairy products and with this tax in place a single gallon of ice cream is purchased each year. The tax revenue (direct
burden) is $3,000,000. The excess burden is the value lost by destroying the dairy industry—farmers, processors, vendors, etc.—minus any gains by those
who produce and sell whatever substitutes replace a portion of the lost dairy products. In addition the excess burden would include the lost value to
consumers who give up ice cream, milk, cheese, etc. for less appealing alternatives. The economic impacts outline above (and discussed further below)
include only the excess burden. At least in the Heritage analysis, the tax revenue is rebated immediately and directly to taxpayers. What remains is the
damage done to the economy.
2. Boxer‐Sanders carbon tax would have had disastrous effect
David W. Kreutzer [The Heritage Foundation] The Impacts of Carbon Taxes on the U.S. Economy
Testimony before Committee on Finance United States Senate
In 2013 Senators Barbara Boxer (D-CA) and Bernie Sanders (I-VT) proposed a carbon tax in their Climate Security Act of 2013.[1] The tax started at $20 per
metric ton and would rise by 5.6 percent per year, reaching $50 per metric ton by 2030 (the endpoint for the Heritage analysis).
Using the Heritage Energy Model (HEM), a derivative of the Energy Information Administration’s National Energy Modeling System (NEMS), Heritage projected
what the economic impacts would have been had the bill become law.[2]
The impacts would have included (dollar values are adjusted for inflation):
GDP loss of $146 billion in 2030
A family of four losing more than $1,000 of income per year,
Over 400,000 lost jobs by 2016,
Coal production dropping by 60 percent and coal employment dropping by more than 40 percent by 2030,
Gasoline prices rising $0.20 by 2016 and $0.30 before 2030, and
Electricity prices rising 20 percent by 2017 and more than 30 percent by 2030.
Though renewable energy grew compared to baseline levels, it wasn’t enough to make up for the lost hydrocarbon energy. In addition it is certain that
businesses and households economized on energy use both by doing without and by employing more energy efficient technologies. These responses would
stimulate employment in certain sectors, but the net effect is an overall loss in employment. The projected employment loss for 2016 was 400,000 jobs. Of
course the energy-dependent sectors would suffer relatively larger job losses. Chart 1 from the Heritage analysis shows job losses as a percent of baseline
employment.
3. A simple $25/ tonne carbon tax would have negative effects
David W. Kreutzer [The Heritage Foundation] The Impacts of Carbon Taxes on the U.S. Economy
Testimony before Committee on Finance United States Senate
In early 2013, a Heritage paper looked at the economic impacts of a carbon tax that was included as a side case in the EIA’s Annual Energy Outlook 2012.[3]
That analysis noted the following impacts of a $25 per ton tax on carbon dioxide: Cut the income of a family of four by
$1,900 per year in 2016 and lead to average losses of $1,400 per year through 2035; Raise the family-of-four energy
bill by more than $500 per year (not counting the cost of gasoline); Cause gasoline prices to increase by up to $0.50
gallon, or by 10 percent on an average gallon price; and Lead to an aggregate loss of more than 1 million jobs by
2016 alone. Again, it should be noted that the NEMS and the HEM both include the changes in behavior and investment in energy-saving technology that
firms and households will undertake to adjust to higher prices. So, the projected income and job losses are over and above any offsetting gains found in](https://image.slidesharecdn.com/33964e0d-f6bf-4a01-b800-ecf75306434d-160207051202/85/February-Carbon-Tax-Brief-compressed-28-320.jpg)
![industries and services that provide low-carbon and no-carbon alternatives. The Annual Energy Outlook 2014 (the most current edition) also has a $25 per ton
carbon-tax side case.[4] Again the GDP losses are significant, exceeding $150 billion for many years, and the jobs losses
are severe, with employment in some years falling below the no-carbon-tax reference case by more than one
million jobs. So, carbon taxes will drive up energy costs, reduce employment, and cut income.
4. A Carbon tax perpetuates inequality
Djamel Kirat [University of Orléans] Carbon tax, spatial heterogeneity and distribution: evidences
from the French energy consumption
This paper investigates empirically the distributional impacts of the French carbon tax project. We use a panel data of the 22 French administrative regions
over the period 1995-2009. We Örst focus on the economic and climatic characteristics that could explain energy consumption of households. We then
estimate the regional CO2 emissions per capita on the basis of a non-linear relationship between carbon emissions and GDP, but assuming a linear
relationship between carbon emissions and temperature, the number of frost days, heating technology and energy prices. We Önd a linear relationship
between CO2 emissions per capita and GDP per capita, showing no evidence of an Environmental Kuznets Curve. Finally, we assess the regional
consequences of implementing a carbon tax of 17e per metric ton of CO2. We found that this policy increases the
inequalities between regions. We then propose two region-speciÖc policies that equalize the burden among regions: uniform taxation with an
ex-post lump-sum redistribution and an ex-ante di§erentiated taxation. Both policies compensate these inequalities and enhance the environmental quality](https://image.slidesharecdn.com/33964e0d-f6bf-4a01-b800-ecf75306434d-160207051202/85/February-Carbon-Tax-Brief-compressed-29-320.jpg)
![HARMS OF INCREASED
PRECIPITATION
1. Less CO2 in the atmosphere, a likely outcome of the imposition of a
carbon tax, increases rainfall
Martin Leggett [EarthTimes] Decreasing CO2 concentrations in the atmosphere causes more
rain to be wrung from the clouds
A new paper in Geophysical Research Letters has zeroed-in on an important consequence of reducing atmospheric CO2 concentrations - it would actually
make the planet wetter. The work, undertaken by a pair of scientists from the Global Ecology department of The Carnegie Institute, also suggests that the
effect cuts both ways, and so helps to explain increased droughts seen as a result of elevated CO2 levels. Carbon dioxide is already well-known as a
greenhouse gas, one that helps to trap the sun's heat, and so warm the planet as its levels rise. But Long Cao and Ken Caldeira have been able to
demonstrate why periods of low CO2 have also been associated with rapid increases in precipitation. It all comes down to where
exactly the trapped heat from CO2 causes temperatures to rise. Their work suggests that this warming effect is most felt most in the middle of the
atmosphere. It also demonstrated how quickly the atmospheric temperature profile is changed as CO2 levels decrease - which causes rainfall levels to change
much more quickly than the overall global temperature. ''The direct effects of carbon dioxide on precipitation take place quickly,"
said Cao. "If we could cut carbon dioxide concentrations now, we would see precipitation increase within the year, but it
would take many decades for climate to cool.'' This change in atmospheric temperature profile causes a big difference in convective
rainfall - where warm air from beneath rises and cools - forming clouds and thunderstorms as the moisture
condenses out. If the middle of the atmosphere becomes cooler, because of less CO2, then this flow is stronger.
That wrings out more rain from the atmosphere. The opposite also applies - increasing CO2 concentrations warms that middle section of air,
suppressing the temperature contrasts that drive such rain clouds, and so reducing rainfall. Droughts in those areas where convective rainfall dominates are
one of the long-predicted, and observed, features of global warming. But does this study imply that cutting CO2 emissions will help solve the drought
problems that global warming is bringing to such areas? Unfortunately not - because of the fundamental difference between CO2 emissions and CO2 levels in
the atmosphere. Emissions represent the rate at which the global 'CO2 bath' is filling, whereas atmospheric concentration can be thought of as the height the
'CO2 bath'. Cutting CO2 emissions, which is the main human-response to global warming, will only slow the tap - or if we try very hard, turn it off completely.
But the bath is still full, and it's that which determines the temperature the planet will be forced to. Because this study looks a cutting atmospheric CO2
concentrations, it doesn't have a direct bearing on our efforts to slash emissions - that is, unless someone can find the plug.
2. There are several harms brought about by this rapid increase in
precipitation
i) Decreased voter participation and turnout
Brad T. Gomez, Thomas G. Hansford, and George A. Krause [University of South
Carolina] The Republicans Should Pray for Rain: Weather, Turnout, and Voting in U.S.
Presidential Elections
That the weather affects voter turnout has long been held as a truism of American presidential elections.
Indeed, come election day, it seems that no other possible correlate with voter turnout is discussed by the media as frequently as the weather. Yet,
to date, political scientists have provided little systematic evidence to substantiate this claim. For the most part, scholars of voter turnout have
simply treated the weather as part of the error term, perhaps assuming that it carries little weight in the decision calculus of voters. Our paper
puts the weather-turnout hypothesis to the test, and we find the linkage not only to be statistically significant,
but sometimes meaningful as well. We find that, when compared to normal conditions, rain significantly reduces voter
participation by a rate of just less than 1% per inch, while an inch of snowfall decreases turnout by almost .5%.
In a broad theoretical perspective, our results testify to the sensitivity of voters to the cost of participation. Some scholars, most notably Aldrich](https://image.slidesharecdn.com/33964e0d-f6bf-4a01-b800-ecf75306434d-160207051202/85/February-Carbon-Tax-Brief-compressed-30-320.jpg)
![(1993), argue that the costs of voting are actually quite low, suggesting that early scholarship may have exaggerated its significance. However, here
we find that voters seem to be rather sensitive to what is presumably a minor increase in participation costs—the weather.
ii) Automobile accidents
[US Department of Transportation Federal Highway Administration] How Do Weather
Events Impact Roads?
On average, there are over 5,760,000 vehicle crashes each year. Approximately 22% of these crashes –
nearly 1,259,000 – are weather-related. Weather-related crashes are defined as those crashes that occur in adverse weather (i.e.,
rain, sleet, snow, fog, severe crosswinds, or blowing snow/sand/debris) or on slick pavement (i.e., wet pavement, snowy/slushy pavement, or icy
pavement). On average, nearly 6,000 people are killed and over 445,000 people are injured in weather-related
crashes each year. (Source: Ten-year averages from 2004 to 2013 analyzed by Booz Allen Hamilton, based on NHTSA data). The vast
majority of most weather‐related crashes happen on wet pavement and during rainfall: 73% on wet
pavement and 46% during rainfall. A much smaller percentage of weather-related crashes occur during winter conditions: 17% during
snow or sleet, 13% occur on icy pavement and 14% of weather-related crashes take place on snowy or slushy pavement. Only 3% happen in the
presence of fog. (Source: Ten-year averages from 2004 to 2013 analyzed by Booz Allen Hamilton, based on NHTSA data). By crash type (not shown
in above table) for an average year, roughly 16% of fatal crashes, 19% of injury crashes, and 23% of property-damage-only (PDO) crashes occur in
the presence of adverse weather and/or slick pavement. That is on an annual basis, nearly 5,300 fatal crashes, over 314,600 injury crashes and
nearly 929,200 PDO crashes occur in adverse weather or on slick pavement. (Source: Ten-year averages from 2004 to 2013 analyzed by Booz Allen
Hamilton, based on NHTSA data).
iii) Flooding
[Natural Resources Defense Council] Flooding: Devastating Floods and Heavy Rains
Climate change has contributed to a rise in extreme weather events - including higher-intensity hurricanes in the North Atlantic and heavier
rainfalls across the country. Scientists project that climate change will increase the frequency of heavy rainstorms, putting
many communities at risk for devastation from floods. Flooding can cause a range of health impacts and
risks, including: death and injury, contaminated drinking water, hazardous material spills, increased
populations of disease-carrying insects and rodents, moldy houses, and community disruption and
displacement. As rains become heavier, streams, rivers, and lakes can overflow, increasing the risk of
waterborne pathogens flowing into drinking water sources. Downpours can also damage critical
infrastructure like sewer and solid waste systems, triggering sewage overflows that can spread into local
waters. Cities like New York City and Chicago, where older sewer systems carry sewage and rainwater in the
same pipes, are at greater risk for sewage spills. During heavy rains, these pipes cannot handle the volume
of stormwater and wastewater, and untreated sewage is often discharged into local waters where people
swim and play. Exposure to pathogens from sewage and unclean water can sicken vulnerable communities
with illnesses like cryptosporidiosis, giardiasis, and norovirus (which cause diarrhea, abdominal pain, nausea, vomiting,
headache, and fever). Local communities across the country can prevent floods and heavy rains from devastating their homes and buildings by
updating infrastructure, improving drinking water safeguards, and creating public plans for what to do in case disaster strikes. Eight states and
various local governments have developed public health preparedness measures to address increased flooding risks associated with climate change.
These measures are a good start at addressing some of the risks but comprehensive response plans addressing the multiple threats and hazards
highlighted above are lacking.
iv) Soil erosion and harms to agriculture
Emily Beach [Goucher College] Negative Effects of Rainy Weather
As raindrops splash against the ground, they loosen the soil. When the soil can no longer absorb any more
rain, the rain washes across the ground, carrying loose soil with it. This type of runoff carries fertilizers and](https://image.slidesharecdn.com/33964e0d-f6bf-4a01-b800-ecf75306434d-160207051202/85/February-Carbon-Tax-Brief-compressed-31-320.jpg)

![DISPROPORTIONATE EFFECT ON
THE POOR
1. Carbon taxes are regressive
[American Energy Alliance] 10 REASONS TO OPPOSE A CARBON TAX
The carbon tax is by nature regressive, because it will raise the prices of gasoline, electricity, and other goods by
the same dollar amount for all consumers, regardless of their incomes. This disproportionately affects the poor,
because energy costs are a bigger portion of their overall budgets. A carbon tax will therefore hurt low-income
families and seniors more than it will hurt middle- and upper-class households.
Corbett A. Grainger, Charles D. Kolstad [NBER] WHO PAYS A PRICE ON CARBON?
We use the Consumer Expenditure Survey and an augmented input-output model of the US economy to illustrate the regressive nature of a price on carbon
in the United States. We show that the costs of a price on borne by consumers are regressive by nature because
polluting goods are mostly energy-intensive and take up a large percentage of a low-income person’s budget. The
degree of regressivity varies with the breadth of the policy. The incidence of a carbon price applied only to final energy consumption is nearly twice as
regressive as a price applied to all CO2 emissions. Furthermore, taking into account differences in household size across income groups and equivalence
scales, the per-capita incidence suggests a much more regressive policy than calculations at the household level. We find that the costs of a
greenhouse gas policy in the United States are regressive, but there are a few caveats that deserve some attention. The direct burden is
22 only one channel through which a climate policy has distributional effects, and as discussed earlier, there are other factors that determine the overall
incidence of a carbon tax or emissions trading system (Fullerton, 2009). For example, we do not consider the distribution of the benefits of a greenhouse gas
policy. If low income groups have more to gain from a cap-and-trade program or a carbon tax, the ‘net’ incidence of the policy may actually be progressive;
alternatively, if wealthier households have more to gain, the ‘net’ incidence may be even more regressive. There are several other caveats from our analysis.
First, producers were assumed not to change production choices, costs were assumed to be fully passed through to consumers, and consumers are assumed
to be unresponsive to increased product prices. Other researchers have found that low-income consumers are more responsive to price increases of polluting
goods such as gasoline (West and Williams, 2004). Depending on the price elasticity of demand for other energy-intensive products, this could reduce the
regressivity of a price on carbon. Second, some of the costs may be borne by factors of production (Fullerton and Heutel, 2007). Environmental regulations
may change real wages and returns to capital, which would change the optimal production inputs (and hence emissions) for various sectors, and the
distribution of these costs across income groups affects the overall incidence of a price on carbon. Third, while we consider a broad price on carbon that
takes into account all emissions, in practice a carbon tax or emissions trading system may have exemptions for emissions from some industries due to political
considerations or high monitoring costs. The regressive nature of the costs of a price on carbon could be alleviated (or eliminated) by carefully recycling
revenues. This could be done by targeted transfers, 23 financing cuts in regressive payroll or excise taxes, targeting income tax cuts at lower income groups,
or by increasing spending on government programs targeted at lower income groups.
2. The regressive nature of carbon taxes quantified
Adele Morris [Brookings] Distributional Effects of a Carbon Tax in the Context of Broader Fiscal
Reform
This paper analyzes the distributional implications of an illustrative $15 carbon tax imposed in 2010 on carbon in fossil fuels. We analyze its incidence across
income classes and regions, both in isolation and when combined with measures that apply the carbon tax revenue to lowering other distortionary taxes in
the economy. The analysis first uses an input-output table approach to estimate the effect of the carbon tax on consumer prices, assuming that the tax is
passed through fully to retail prices. Then, using Consumer Expenditure Survey data on consumption patterns, we estimate the burdens across households,
assuming no behavioral response to the new prices. Consistent with earlier findings, we find that a carbon tax is regressive.
Taking into account both direct and indirect energy costs, the carbon tax burden would comprise 3.5 percent of the
income of the poorest decile of households and only 0.6 percent of the income of the highest decile. In the consumption
approach, the carbon tax is substantially less regressive, with the ratio of average taxes paid by the bottom and top deciles equal to about 1.7. In the tax
swap simulations, we subtract the burden of other taxes that the carbon tax revenue could displace, such as the corporate and personal income taxes, and
compute the net effect on households. We analyze revenue-neutral tax shifts under three assumptions about how those other taxes lower households’ capital
and labor income: all borne by labor, all borne by capital, and a 50/50 split. Although all of the tax swaps lower the overall burden of the carbon tax (as a
share of household income) on the poorest two deciles, tax swaps also exacerbate the regressivity of the carbon tax on the high end. This means that the
benefit to the highest income households of the reduction in other taxes is greater than their share of the burden of the carbon tax.](https://image.slidesharecdn.com/33964e0d-f6bf-4a01-b800-ecf75306434d-160207051202/85/February-Carbon-Tax-Brief-compressed-33-320.jpg)
![3. Basic economic impacts of income inequality
i) Income inequality hinders social mobility
Pablo Mitnik [Stanford Center on Poverty and Inequality] Social Mobility in a High
Inequality Regime
At several critical junctures in U.S. history, scholars and other commentators have become concerned that opportunities to get ahead may be
growing more unequal. Although these concerns have never been borne out, the recent takeoff in income inequality has revived them yet again.
There is strikingly little evidence on whether such concerns are warranted. Unfortunately, a host of methodological problems immediately emerge
in attempting to establish recent trends in social mobility. These obstacles can, however, be overcome by searching for trend among those age
groups and social classes that are most likely to evince trend. Although the data are sparse and caution is clearly warranted, the key conclusion
coming out of this analysis is that the General Social Survey data do indeed reveal a recent increase in intergenerational association among young
and even middle-age adults, driven by an increased advantage of the professional/managerial class relative to all other classes. The observed
pattern of trend is largely consistent with what we call the “top-income hypothesis” and, more generally,
with the predictions coming out of a two-factor model featuring the effects of (a) the expansion of mass education, and (b) the
takeoff in income inequality. Just as this model implies, the association-over-time curve has the expected convex shape in the two
younger age groups, while the change in association appears to be accelerating in the most recent decade. These results suggest that
the takeoff in income inequality accounts in part for the decline in mobility.
ii) Inequality has a negative effect on economic growth
Federico Cingano [OECD] Trends in Income Inequality and its Impact on Economic Growth
This paper contributes to a large empirical literature estimating the impact of inequality on growth. Drawing on harmonised data covering the
OECD countries over the past thirty years, the econometric analysis suggests that income inequality has a sizeable and
statistically significant negative impact on growth, and that redistributive policies achieving greater equality in disposable income
has no adverse growth consequences. Moreover, it suggests that it is inequality at the bottom of the distribution that hampers growth. Additional
analysis based on OECD PIAAC data suggests that one key channel through which inequality negatively affects economic performance is through
lowering investment opportunities (particularly in education) of the poorer segments of the population.](https://image.slidesharecdn.com/33964e0d-f6bf-4a01-b800-ecf75306434d-160207051202/85/February-Carbon-Tax-Brief-compressed-34-320.jpg)


