FAQ’s Sl. No. 2 : Regarding Power Procurement Costs
•
1 like•364 views

FAQ’s Sl. No. 2 : Frequently Asked Questions regarding Power Procurement Costs

Recommended
More Related Content
What's hot
What's hot (20)
Similar to FAQ’s Sl. No. 2 : Regarding Power Procurement Costs
Similar to FAQ’s Sl. No. 2 : Regarding Power Procurement Costs (20)
More from Tata Power Delhi Distribution Limited
More from Tata Power Delhi Distribution Limited (20)
Recently uploaded
Recently uploaded (20)
FAQ’s Sl. No. 2 : Regarding Power Procurement Costs
- 1. 1 | P a g e Frequently Asked Questions regarding Power Procurement Costs Question 1: Please elaborate the reasons for increase in the Power Procurement Cost of Discoms in the recent years? What are the key underlying parameters which have resulted in this price hike? Answer: Analyzing the cost structure of the discoms which ultimately translates into the retail tariffs for the end consumers, it is observed that 70- 80% of the costs pertain to Power Purchase. These costs are beyond the direct control of the discoms as the allocation of power to each State from Central Generating Stations such as NTPC, NHPC, DVC etc. is decided by the Government of India and from State Generating Stations by State Government. This power is transmitted from Generating Cos. to Discoms through Govt. owned Transmission companies (Power Grid and Delhi Transco Ltd.). The tariffs of these Generators and Transcos are determined by concerned Regulatory Commissions i.e. CERC/DERC as per prevailing regulations. The various parameters which influence the cost of Generation and inter alia the price at which the same is passed on to the Discoms include a) Fuel Prices b) Freight Charges for Fuel Transportation c) Regulatory Changes (Incentives, O&M Costs etc.) In addition, changes in Transmission charges for wheeling the power to the Discoms also affect the Power Procurement Prices. It is also pertinent to mention that since no peaking capacities are available in India for tie ups, it is necessary to tie up round the clock (RTC) power from all stations which makes discoms surplus during off peak periods. Further, in Delhi, there is a wide variation in the demand during summer months and winter months which also creates surpluses. In summer the demand surges to 5600 MW whereas in winters, the peak is around 3400 MW with off peak demand falling to 1300 MW. In case of TPDDL, while the summer peak is approx. 1600 MW, winter peak is only 1000 MW with offpeak requirements of only 500 MW. These surpluses created due to wide variation in demand need to be disposed through available short term options such as Bilateral Arrangements or Exchanges or Unscheduled Interchange (UI). In addition, during peak hours, TPDDL also needs to purchase power to meet demand surges. Hence, the prices discovered in the short term markets also impact the net Power Procurement Costs of the Discoms. Over the past few years, there has been a rapid and significant rise in the Power Purchase Costs primarily attributable to: a) Severe Domestic Coal & Gas shortage resulting in increased dependence on imported fuels which are prone to price volatility linked to, amongst others, demand supply situations in international markets together with any political uncertainties. Additionally, with the Rupee experiencing significant depreciation, the problem of escalating prices is being further compounded, b) Increase in charges of Generation and Transmission companies effected by CERC Regulations. c) Low sale price of surplus power available during off peak. Due to cash strapped State discoms resorting to load shedding rather than purchasing power to meet their energy demand, rates of Short term power have fallen progressively creating an
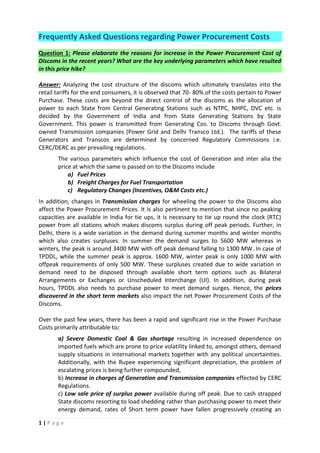
- 2. 2 | P a g e anomalous situation where long term power is presently more expensive than short term power. The factors explained above have significantly impacted the overall Power Purchase Cost of the Discom which has increased by around 90% over the past 4 years. Such a situation of spiraling Generation costs if not controlled through effective interventions can only result in tariffs going up in the future. Details FY 08-09 FY 09-10 FY 10-11 FY 11-12 FY 12-13 Incr. / Decr. over the yrs Power Purchase from Central Generating Stations 2.45 2.69 3.02 3.83 3.77 54% Power Purchase from Delhi Genco 2.84 3.05 3.67 4.67 5.19 83% Bilateral Purchases 4.35 5.25 5.56 3.93 3.57 -18% Surplus Sale 5 4.11 2.96 2.94 2.83 -43% Transmission Costs 0.24 0.26 0.34 0.83 0.69 188% Power Purchase Cost 2.86 3.68 4.25 5.29 5.45 91% A drill down analysis of individual parameters impacting the Power Procurement Prices indicates that Gas prices have increased by 135% since 2008-09. Coupled with the adverse variation in exchange rates the Variable Costs from Gas Based Plants have correspondingly increased by 161% creating an impact of Rs. 155 Crs in net Power Purchase Costs in FY 2012- 13 over FY 2008-09. Further, with gas prices set to be doubled from April 2014, the impact shall increase to 440% with additional financial impact of Rs. 268 Crs. Similarly, use of costlier imported coal and increase in freight charges have made coal based generation costlier by 48-52% with an impact of approx. 315 Crs considered for major plants such as Dadri 1,2 and BTPS supplying to Delhi. In addition to the above, Regulatory changes such as moving to an incentive mechanism based on Availability rather than actual generation (PLF) has resulted in further impact of Rs. 30 Crs. Also, the O&M Costs from coal based and gas based generation plants have increased by 33-158% depending on plant type and capacity. Further, transmission charges to wheel the power to Discoms have increased manifolds with an increase of approx. 244% over 2008 prices creating an impact of Rs. 370 Crs (approx.). It 0 1 2 3 4 5 6 FY 08-09 FY 09-10 FY 10-11 FY 11-12 FY 12-13 Rs./kwh Power Procurement and Sale Power Purchase from Central Generating Stations Power Purchase from Delhi Genco Surplus Sale Transmission Costs Power Purchase Cost
- 3. 3 | P a g e is also to be noted that artificial suppression of demand through load shedding by cash strapped discoms have distorted the short term market prices creating an additional impact of Rs. 500 Crs in Net Procurement Costs with gains in surplus sale during 08-09 progressively dwindling down to huge losses in 2012-13. A brief summary in enclosed below: Factor Period % increase Impact in Rs. Crs (Approx.) Gas Prices* 2008-09 to 2012-13 135% Variable Cost of Gas Based Plants 2008-09 to 2012-13 161% 155 Coal Prices 2008-09 to 2012-13 48-52% Variable Cost of Coal Based Plants** 2008-09 to 2012-13 45-55% 315 O&M Costs of Coal Based Plants as per CERC Regulations 2008-09 to 2012-13 34-86% O&M Costs of Gas Based Plants as per CERC Regulations 2008-09 to 2012-13 100-150% Incentive on Generation – PLF to Availability 2008-09 to 2012-13 80% 30 Transmission Charges 2008-09 to 2012-13 244% 367 Surplus Sale 2008-09 to 2012-13 268% (reduction) 520 Total 1387 *With Gas Prices doubling to USD 8.4/MMBTU from Apr 2014 leading to an increase of 369% over 2008-09 prices, the Variable Costs shall increase by approx. 440% with an additional impact of Rs. 268 Crs **Coal Prices increase for Dadri1, 2 and BTPS supplying approx. 30% requirements of Delhi considered Question 2: Can you please elaborate on the Key Policy and Regulatory Changes which have impacted Power Procurement Costs for the Discoms ? Answer : Detailed analysis of Key Policy and Regulatory Changes affecting the Generation and Transmission Prices and inter- alia the Power Procurement Costs of the discoms are presented below: 1. Gas Pricing and Its Impact on Prices: Natural gas pricing in India has evolved over time, and currently several pricing regimes exist in India Administered Pricing Mechanism (APM): APM gas refers to natural gas produced by state-owned ONGC and OIL, from fields provided to them on a nomination basis. Administered Price Mechanism (APM) gas constitutes about 60 per cent of current domestic production of about 110 million standard cubic metres per day. Pre-NELP PSC pricing: The Panna-Mukta, Mid & South Tapti (PMT) and Ravva fields are under this pricing regime. The price of natural gas is determined by the provisions of the PSC, signed by the consortium with the government NELP gas pricing: This pricing mechanism is applicable to gas fields that were awarded by the government under the new exploration licensing policy (NELP). The pricing of JV gas is governed by the terms of PSC provisions, which are determined on the basis of arm’s length prices (market prices), subject to the government’s approval. The government fixed the price for KG-D6 field at USD 4.2 per mmbtu for five years starting 2009 Coal Bed Methane (CBM) gas pricing: CBM has a small share (less than one percent) in India’s total gas production.
- 4. 4 | P a g e Plants supplying to TPDDL such as Anta, Auriya, Dadri GPS and GT, Pragati and PPCL III (Bawana) are dependent on APM gas and/or KG D6 gas for their production. As can be seen from analysis below, APM Gas Prices have increased by 135% in June 2010 and shall increase by 369% in Apr 2014 over prices in 2006. Coupled with the adverse variation in exchange rates the Variable Costs have correspondingly increased by 161% in June 2010 and shall increase by 440% from Apr 2014 over 2006. APM Gas Price Trend Unit/ Year 2006-2010 2010-2013 April 2014 onwards Rs./MSCM 3840 USD/MMBTU 1.79 4.2 8.4 % increase over previous period 135% 100% Net % increase (2005 to 2014- 9ys) 369% Units (kwh)produced/MMBTU Assuming heat rate of 2100 kcal/kwh 120 120 120 VC @ 2100kcal/kwh SHR for Combined Cycle in Rs./unit ** 0.8055 2.1 4.34 % increase in VC including impact of exchange prices and Gas prices increase (Y-o-Y) 161% 107% Net % increase in VC including impact of exchange prices and Gas prices increase (2005 to 2014 – 9 years) 439% Cost of approx.1200 MUs Sourced from Gas Plants such as Anta, Auriya, Dadri, GT, Bawana and Rithala in Rs. Crs 96.66 252.00 520.80 * Prices converted to USD/MMBTU in initial years from Rs./MSCM ** Exchange Rate of Rs. 54/USD in 2006-10, Rs. 60/USD in 2010-13 and Rs. 62/USD considered 2014 onwards Conversion Factor 1 MMBTU 252000 kcal 1 SCM 10000 kcal 1 MMBTU 25.2 SCM Key Policy Issues: 1. As per Gas Utilization Policy of Ministry of Petroleum and Natural Gas and EGOM, gas supply to power plants sourcing from KG D6 basin has been completely curtailed since Mar 2013 leaving capacities stranded. 2. Upward revision in Gas prices to USD 8.4/MMBTU from Mar 2014, will render Gas Based Generation Plants as non dispatchable in merit order with utilities forced to bear fixed charges against claimed availabilities on expensive Spot Gas/ RLNG arrangements. 3. One sided Gas Transportation Contracts with Ship or Pay provisions with Transporters (RGTIL and GAIL) forcing beneficiaries to pay 90-95% of the charges even when gas supplies are completely curtailed and capacities are stranded. For TPDDL, the same
- 5. 5 | P a g e translates into a monthly bill of Rs. 6 Crs approx. to RGTIL and GAIL on account of Ship- or-Pay payments. In addition, the burden of the same is also passed on by its Generators such as PPCL III who are sourcing gas from KG D6. 4. Non availability of gas till 2016-17 needs to be addressed 2. Impact of CERC Regulations (2009-14 Vs 2004-09) A) Incentives allowed to Generation Plants 2004-09 Regulations: Incentive: Incentive shall be payable at a flat rate of 25.0 paise/kWh for ex-bus scheduled energy corresponding to scheduled generation in excess of ex-bus energy corresponding to target Plant Load Factor. Target Plant Load Factor for Incentive - (a) All thermal power generating stations, except those covered under clause (b) below - 80% 2009-14 Regulations: Incentive linked to Availability instead of PLF. Normative Plant Availability factor for new plants pegged at 85%. Illustration of impact on Change in Regulations : Impact of approx. Rs. 30 Crs/yr on Power Purchase Cost i.e. 3 paisa/unit Incentives payable (2004-09 Vs 2009-14 Regulations) Old plants New plants Total Total capacity of Thermal stations MW 11082 4980 16062 Allocation from Coal Plants to TPDDL MW 596 494 1090 Target PLF in 2004-09 CERC Regulations % 80 80 80 Generation in a yr at 80% Plant Load Factor (PLF) MU 4177 3459 7636 Approx. average availability of Thermal (NTPC) station in 12-13 % 95 95 95 Generation in a yr at 95% PLF MU 4960 4108 9068 Incentive as per 04-09 regulations paisa per unit of energy generated above target PLF 25 25 25 Incentive amount as per 04-09 regulations Rs lacs 1958 1622 3579 Target Plant Availability Factor for the Month (PAFAM) in 09-14 regulation 85 85 85 Incentive as per 09-14 regulations Normative Annual Plant Availability Factor AFC* (PAFM / NAPAF) AFC*(0.5+0.5* PAFM/NAPAF) TPDDL share in Annual Fixed Cost of Thermal stations Rs Lacs 32507 45583 78089 Incentive amount as per 09-14 regulations Rs Lacs 3824 2681 6506 Percentage increase 95% 65% 82% Increase in Incentives Rs. Lacs/year 2927 Key Issues: a) It is being observed that Thermal Generating Stations are not only using imported/ adhoc purchased costly coal / RLNG to cover shortages to extent of operating at normative availabilities but also to operate at much higher availability and earn incentives. Owing to the high variable cost, the beneficiaries are forced to back down the thermal stations in merit order and hence payment of incentive for achievement of
- 6. 6 | P a g e higher availability is not justified. The reasonableness of transferring the cost implication without commensurate benefits to the beneficiaries is questionable. b) Current regulations also provide for incentive on tax component as tax is being included in the calculation of AFC. B) Revision of O&M Costs: Vide CERC tariff Regulations, 2004-09 Vs 2009-10, escalation of 111 % to 169% is observed in O&M Costs for Gas Based Plants. Similarly, for Coal Based Plants, O&M Costs have escalated by 33% to 86% as indicated in the table below. 2004-09 a) Coal Based Plants ( O&M Costs in Rs. Lakhs/MW) Year 200/210/250 MW 500 MW and above sets 2004-05 10.40 9.36 2005-06 10.82 9.73 2006-07 11.25 10.12 2007-08 11.70 10.52 2008-09 12.17 10.95 500 MW 600 MW and above sets 2009-10 18.20 13.00 11.70 2010-11 19.24 13.74 12.37 2011-12 20.34 14.53 13.08 2012-13 21.51 15.36 13.82 2013-14 22.74 16.24 14.62 % increase in 2013-14 over 2008-09 86.85% 48.31% 33.52% b) Gas Based Plants ( O&M Costs in Rs. Lakhs/MW) Year Gas Turbine/ Combined Cycle generating stations other than small gas turbine power generating stations Small gas turbine power generating stations 2004-05 7.80 9.46 2005-06 8.11 9.84 2006-07 8.44 10.24 2007-08 8.77 10.65 2008-09 9.12 11.07 2009-10 14.80 22.90 2010-11 15.65 24.21 2011-12 16.54 25.59 2012-13 17.49 27.06 2013-14 18.49 28.61 % increase in 2013-14 over 2008-09 103% 158%
- 7. 7 | P a g e 3. Increase in Costs of Generation a) Use of Imported Coal India is currently facing a severe shortage in domestic coal production which is leading to increased dependence on imported coal. The CEA vide its advisory dated 19th Apr 2011 had advised that “For the purpose of design of boilers for all future indigenous coal based thermal power stations, a stipulation shall be made that boilers (including auxiliaries) shall be designed for a blend ratio by weight of 30:70 (or higher) imported coal : indigenous coal. It is to be noted that as per Planning Commission Report for the XIIth Plan, International coal prices of thermal coal are currently about three to four times higher than domestic coal but this reflects the fact that imported coal is of higher calorific value and better quality. After adjusting for these differences, international coal prices are a little over twice the domestic prices. Due to use of imported coal and increase in prices due to inflation, TPDDL has witnessed a steep increase in prices from almost all plants since 2007-08. Data on plants of NTPC viz. Badarpur, Dadri 1&2 and Aravalli which meet 35% of TPDDL’s requirement are shown below which indicates an increase of 60-70% in landed cost of primary fuel and Variable Costs from these plants. Even the FSA’s being signed by Coal India with Generators stipulate the requirement for meeting supply through indigenous coal only till 65% of the Annual Contracted Quantity beyond which there is no penal provision. Given the above, on account of use of imported coals, the tariffs from various coal based generating stations have increased over the past few years which is illustrated as below: Station Name TPD DL Alloc (MW ) Generation at 80% PLF (MUs) Financial Impact (Rs. Crs) – increase in VC Variable Cost (VC) FY 12-13 FY 11-12 FY 10-11 FY 09-10 FY 08-09 No of years % increase Landed Price of Primary Fuel (LPPF) Dadri National Capital Thermal Power Station - I 166 1163.328 103.54 VC Rs/unit 288 281 235 224 199 5 45% LPPF Rs/MT 4,020 4,052 3,393 3,045 2,645 52% Dadri National Capital Thermal Power Station - II 195 1366.56 81.99 VC Rs/unit 278 270 220 218 0 4 28% LPPF Rs/MT 4,020 4,080 3,393 3,438 0 17% Badarpur Thermal Power Station 140 981.12 128.53 VC Rs/unit 368 283 318 273 237 5 55% LPPF Rs/MT 3,665 3,173 3,264 2,747 2,479 48% Indira Gandhi Super Thermal Power Station, Jhajjhar 202 1415.616 36.81 VC Rs/unit 336 310 0 0 0 2 8% LPPF Rs/MT 4,191 3,745 12% Total impact of increase in VC (Rs. Crs) 350.86
- 8. 8 | P a g e b) Increase in Freight Charges It is also to be noted that the above plants have their coal linkages with mines situated apprpx. 1100 kms and above from the Generating stations and hence the cost of transportation of fuel significantly add up to the Variable Cost of Generation making the above plants costliest in the bucket of Central Generating stations. Name of Station/Units TPDDL Allocation Plant State Mine Linkage Distance b/w plant and mine(Km.) Dadri (Th.) Stage II 195 Uttar Pradesh Piparwar Mines, Jharkhand 1100-1200 BTPS 140 New Delhi Jharia Coal Fields,Jharkhand 1200-1300 Dadri NCTPS 166 Uttar Pradesh Piparwar Mines, Jharkhand 1100-1200 Indira Gandhi Super Thermal Power Station, Jhajjhar 202 Haryana Mahanadi Coalfields Ltd., Orissa 1300-1400 The average freight rates have increased by approx. 31% in the past 3 years Indian Rail Freight Rate (Rs./MT) 2010-11 2012-13 2013-14 % increase in 3 years 1100-1200 1070 1320.2 1396.8 31% 1200-1300 1150 1425.8 1508.4 31% 1300-1400 1250 1530.9 1619.6 31% Key Policy issues: 1. Inadequate development of domestic coal mines leading to increased dependence on expensive imported coals. 2. Allocation of fuel linkages from nearby mines to above stations of NTPC which shall lead to decrease in fuel costs. 4. Increase in Transmission Charges It is to be also to be noted that the transmission charges for Both Central Transmission Utility (PGCIL) and State Transmission Utility – Delhi Transco Ltd. have also gone by 129% (from 16.30p/unit in FY 08-09 to 37 p/unit in FY 12-13 ) and 291% (from 7.50p/unit in FY 08-09 to 29 p/unit in FY 12-13)respectively. FY 08-09 FY 09-10 FY 10-11 FY 11-12 FY 12-13 % Increase in 5 years PGCIL charges (Rs lacs) 10312 12422 13626 21568 29001 DTL charges (Rs lacs) 4750 5729 11054 34047 22820 Consumption (MU) 6325 6956 7316 7546 7763 PGCIL charges (Ps/unit) 16.30 17.86 18.62 28.58 37.36 129% DTL charges (Ps/unit) 7.51 8.24 15.11 45.12 29.40 291% Further, with change in transmission charges regime from Postage Stamp to Point of Connection, charges applicable on short term transactions have also gone up. In earlier postage stamp method, 8 p/unit transmission charges were levied per region. If Power was transmitted over 2 regions, 16p/unit was charged. However, with Point of Connection charges, power transmitted irrespective of region was charged between 11p
- 9. 9 | P a g e to 13p/unit for each injection and withdrawl. Hence, since the system proved beneficial for those sourcing power over more than one region, it became costly for Discoms like TPDDL whose power was being sourced mainly from one region. Further, with change to PoC regime, injection charges which were earlier borne by Generating Cos. were also transferred to discoms which also lead to increase in transmission prices. 5. Drop in Sale Rates in Short Term Markets The Short Term Power Markets in India are experiencing an anomalous situation with the short term power becoming cheaper than long term power. The irony of the situation is that despite being a power deficit country, generation capacities are being backed down as cash strapped discoms are resorting to load shedding rather than procurement of adequate quantity of Power. Given below is the depiction of how sale realizations have dipped for TPDDL over the past few years owing to artificial demand supply situation being created in short term markets. Financial Impact of Sale of Surplus Power (Rs. Crs) FY 08- 09 FY 09- 10 FY 10- 11 FY 11- 12 FY 12-13 Power Purchase Cost from Long Term Sources (CSGS + Delhi Gencos) Rs./unit 2.59 2.81 3.20 3.82 3.97 Surplus Sale MUs 804.04 724.95 1062 1680 2856 Average Sale Rate Rs./unit 5 4.11 2.96 2.94 2.83 Gain (+)/ Loss (-)on Sale of Surplus Rs. Crs 194.12 94.24 -25.42 -147.84 -325.58 Key Policy Issues A. Strict Regulations on Load Shedding to be issued by all states so that consumer requirements and demand are not artificially suppressed. 0.00 5.00 10.00 0 500 1000 1500 FY 08-09 FY 09-10 FY 10-11 FY 11-12 FY 12-13 Salerate(Rs/unti) SurplusSaleEnergy(MU) Financial Years Break up of Surplus Sale Disposed Bilateral Sale MU Banking Export MU Exchange Sale MU UI Underdrawl MU Bilateral Rate Banking Rate Exchange Rate UI Rate
- 10. 10 | P a g e Qustion 3: What interventions are required to be made to bring down the Power Procurement Costs of Discoms? Answer : 1. There is an immediate need to relook at the Power Allocation mechanism to Discoms to ensure a fair allocation and consequently retail prices to the end consumers. For instance, Delhi has more than 30% share of its power from BTPS, Dadri 1 & 2 and Aravalli Stations of NTPC which are high cost generating stations with an average cost of Rs. 4-5/unit and above at ex bus and are the most expensive stations in Central Generating pool. Coupled with transmission charges and losses for wheeling the power to Discoms periphery from these Generating Stations, additional 80 paisa to 1 Rs/unit costs get added bringing the landed costs to Rs. 5 to 6/unit. In addition it is pertinent to point out that BTPS being a vintage station (more than 30 yrs old), its units 1, 2 and 3 have become highly inefficient. Also, Delhi Gencos such as Rajghat and GT are vintage stations which have over time become inefficient and therefore, expensive with per unit costs higher than Rs. 4/unit. Further, PPCL III (Bawana) which is a gas based generating station, has also become expensive on account of reduced gas availability burdening the beneficiaries with high fixed costs/unit on account of low generation. TPDDL has been consistently pursuing across various forums of Delhi Govt. and Ministry of Power for reallocation/ surrender and backing down of the above generation capacities which can immediately lead to a reduction in the Overall Power Purchase Costs for Delhi Discoms for FY 14-15 thereby bringing down the retail tariffs. TPDDL has worked out a scenario for Estimated Power Purchase Costs for FY 14-15. It can be seen that with current allocations, the Average Power Purchase Costs for FY 14-15 is estimated as Rs. 5.83/unit Description BASE CASE PPC (FY 14-15) MUs Amount (Rs Cr) Rate Power Purchase from CSGS 11,668.67 4,363.62 3.74 Inter-State Bilateral Purchase 263.79 103.04 3.91 PGCIL Losses (430.50) Power Purchase from Delhi Gencos 2,787.71 1,584.29 5.68 Intra-State Power Purchase - - - Purchase of REC 92.25 Power Availability at Delhi Periphery 14,289.67 6,143.20 4.30 DTL Losses (172.23) Power available to DISCOM 14,117.44 6,143.20 4.35 Less: Surplus Power sold/Banked/UI sales (5,746.59) (1,865.36) 3.25 Power required for TPDDL's consumers 8,370.86 4,277.83 5.11 Transmission Charges PGCIL charges + Other charges 378.93 DTL charges 220.86 Power required for TPDDL's consumers 8,370.86 4,877.62 5.83 With directed interventions to reallocate Aravali, BTPS (Unit 1,2,3) , Dadri Stage 2 (Unit 1), Rajghat and backing down of GT Block 1& 2, the estimated costs shall be reduced to Rs.
- 11. 11 | P a g e 5.28/unit resulting into a saving of 55 paisa/unit and consecutively cumulatively saving of Rs. 1400 Crs approx against 26000 MUs being consumed by Discoms of Delhi. Assumptions for Scenario I PPC 2014-15 Scenario I: Reallocation of Aravali, BTPS # I, II & III, Dadri Th II #1, Rajghat and bask down of GT block I and II (in addiiton to the assumptions of base case) Reallocation of Allocation to Delhi (MW) Allocation to TPDDL (MW) Expected Mus* VC+ FC = Total Cost (Rs/unit) Aravali 750 219 1401 3.63+1.45 = 5.08 BTPS Unit I, II & III 285 62 438 3.49+1.11 = 4.60 Dadri Thermal Stage II Unit I 490 143 837 2.84+1.61 = 4.45 Rajghat 135 39 194 3.18+2.22 = 5.39 Back Down Allocation to Delhi (MW) Allocation to TPDDL (MW) Expected Mus* VC+ FC = Total Cost (Rs/unit) GT Block I and II 282 82 543 3.66+1.88 = 5.54 Description SCENARIO I PPC (FY 14-15) MUs Amount (Rs Cr) Rate Power Purchase from CSGS 9,431.02 3,343.98 3.55 Inter-State Bilateral Purchase 263.79 103.04 3.91 PGCIL Losses (343.00) Power Purchase from Delhi Gencos 1,807.77 1,141.13 6.31 Intra-State Power Purchase - - - Purchase of REC 92.25 Power Availability at Delhi Periphery 11,159.58 4,680.40 4.19 DTL Losses (134.58) Power available to DISCOM 11,025.00 4,680.40 4.25 Less: Surplus Power sold/Banked/UI sales (2,654.15) (863.41) 3.25 Power required for TPDDL's consumers 8,370.86 3,816.98 4.56 Transmission Charges PGCIL charges + Other charges 378.93 DTL charges 220.86 Power required for TPDDL's consumers 8,370.86 4,416.77 5.28 In addition to the above, Reallocation of Bawana (PPCL III) shall further reduce the costs by 27 paisa/unit resulting into a total savings of 82 paisa/unit and resultant amount of approx. 2100 Crs. Reallocation of Allocation to Delhi (MW) Allocation to TPDDL (MW) Expected Mus* VC+ FC = Total Cost (Rs/unit) Bawana 902 187 443 2.86+1.19 = 4.05 * Bawana Mus are calculated assuming that TPDDL share will be 60MW in view of scarcity of gas.
- 12. 12 | P a g e Description SCENARIO II PPC (FY 14-15) MUs Amount (Rs Cr) Rate Power Purchase from CSGS 9,431.02 3,343.98 3.55 Inter-State Bilateral Purchase 263.79 103.04 3.91 PGCIL Losses (343.00) Power Purchase from Delhi Gencos 1,364.39 777.65 5.70 Intra-State Power Purchase - - - Purchase of REC 92.25 Power Availability at Delhi Periphery 10,716.20 4,316.92 4.03 DTL Losses (129.39) Power available to DISCOM 10,586.81 4,316.92 4.08 Less: Surplus Power sold/Banked/UI sales (2,215.95) (721.44) 3.26 Power required for TPDDL's consumers 8,370.86 3,595.48 4.30 Transmission Charges PGCIL charges + Other charges 378.93 DTL charges 220.86 Power required for TPDDL's consumers 8,370.86 4,195.27 5.01 The above analysis clearly demonstrates the impact that effective interventions can do to lower the Power Purchase Cost of Discoms. Even with limited intervention of reallocation/ backing down of expensive power, an impact of 14% can be created in the Overall Costs of Power leading to effective reduction of retail tariffs. 2. Coupled with medium term and long term interventions at Regulatory, State and Central Government levels, the overall Power Procurement Costs of Discoms can be effectively reduced with retail tariffs of consumers progressively being brought down. However, till Key Policy Issues mentioned below are addressed through effective interventions by the State and Central Govts., the problem of compounding tariffs shall not be resolved. Key Recommendations include: A. Development of Domestic Coal Blocks making cheaper domestic coal available for Generation. Coal exploration must be stepped up to ensure availability of more coal mining blocks for both private and public sectors. A single window clearance concept needs to be implemented for fast track development of captive coal blocks. The decision to allocate all future coal blocks on the basis of transparent bidding should be implemented as soon as possible. Amendment in Coal Mines (Nationalisation) Act, 1973 needs to be brought in to attract big private investments. Currently, The Coal Mines (Nationalisation) Act, 1973 does not allow private companies to mine coal for sale to third parties though captive mining is allowed for specified end use sectors. Unless large investment and technology in the sector comes in, mining coal by a host of small players would not increase production to desired levels. The level of imports at the end of the Twelfth Plan is projected to increase from 137 million tonnes of Indian quality coal at the end of the Eleventh Plan to 185 million tonnes at the end of the Twelfth Plan based on total coal demand of 980 million tonnes and domestic supply of 795 MT. If domestic supply does not match the target
- 13. 13 | P a g e growth rate of 8 per cent per year, the import demand will be higher and shall continue to impact the Generation prices and consequently the retail tariffs B. Revamping of fuel linkages to minimize fuel transportation costs – Attempts to be made to allocate fuel linkages to plants from coal mines in close proximity rather than coal being hauled over long distances. The same shall help to reduce the impact of freight charges. C. Availability of Imported Fuel (Coal/Gas) at affordable prices – Government can establish bulk tie ups for sourcing fuel whose price can then be uniformly borne by all beneficiaries rather than the brunt being faced by some discoms only. There is an urgent need to consider a mechanism of Price Pooling making fuel available at affordable prices so that capacities are not stranded and can find a despatchable position in the merit order schedule. As per Planning Commission Report, around 5,000 MW of gas-based projects commissioned during the Eleventh Plan period are currently stranded/operating at a very low plant load factor (PLF) due to non-supply of gas. In addition to these projects, at least 2,538 MW of additional gas based capacity is expected to come up during the Twelfth Plan. Further, there is a need for 2,000 MW of gas-based capacity to deal with peaking requirements. In addition, around 25,000 MW of coal-based capacity commissioned is being sub-optimally utilized because of inadequate availability of domestic coal. D. Closure of inefficient Generating Units with reallocation of Fuel Linkages to Efficient ones – Review of Generation Plants and their efficiencies to be undertaken and scarce natural resources to be allocated to only efficient units to lower the costs of per unit Generation. Mechanism to support the fixed cost recovery for plants whose fuel allocations are revoked may need to be worked out. For instance, BTPS and Gas Turbine Generation plants in Delhi which have exhausted their useful life need to be decommissioned with their fuel linkages be reallocated to more efficient plants. E. Reduction of Transmission Charges - As is evident from the analysis above, Transmission charges have increased by 332% over the past 5 years creating an impact of approx. 40p/unit in the Power Purchase Cost of utilities. It is necessary to explore means and avenues to reduce the impact of transmission charges on end consumers. Some suggestions include a. Mega project benefits like UMPP may also be extended to the all transmission sector projects; this would reduce the project cost. b. Viability gap funding may be explored as option to provide funds for transmission projects, which are of strategic importance and are crucial for overall development of the transmission sector. A fund in this regard may be created from the money lying in the UI pool and congestion price differential amounts generated in power exchange transactions. c. High capacity transmission corridors to be strategically planned to facilitate flow of power from the generation centre to load centre to minimize the transmission losses. Further, Government should provide subsidy to alleviate the impact of high transmission charges due to underutilization during the initial stage. The scheme may provide for recovery of the subsidy during the stage full utilization.
- 14. 14 | P a g e d. As per CERC Regulations, Short Term Open Access charges to the tune of 25% are retained by CTU/ STUs for future planning and infrastructure development of transmission sector. Although this money is in addition to the Annual Revenue Requirement of the CTU/STU and is the money of the beneficiaries, still CTU/STU are claiming returns on investment made through this fund again from the beneficiaries thereby also increasing transmission charges. F. Stringent Regulations against Load Shedding – Discoms resorting to load shedding rather than purchasing power from available sources need to be penalized through effective Regulations by State and Central Regulatory Commissions in the interest of consumers. It’s an irony that Generation is being backed down in a deficit country which sends incorrect signals for economic growth and puts investors in a jeopardy. G. Incentives to Generation Plants on Performance (Actual Generation) Vs Availability – Incentives to be linked to actual generation and not on availabilities declared through expensive fuels where the plants are not dispatched in merit order. We would like to propose that the incentive to the generating station beyond Normative Annual Plant Availability Factor (NAPAF) shall be allowed on Plant Load Factor (PLF) basis as the Generators are able to recover the full fixed cost at NAPAF i.e. any incentive over and above the Target NAPAF shall be allowed only when the PLF of the concerned station is greater than NAPAF. In the existing provision of the tariff regulations, the beneficiaries are unaware of the fact whether the generating stations are able to achieve target NAPAF with the linkage of indigenous fuel (linked coal) only or are using costlier (imported/ e auction) coal just for declaring availability beyond NAPAF and earn incentives. H. Promotion of Roof Top Solar through Effective policies– Effective policies for promoting Solar Roof Top Generation should be laid down and Peak Power Requirements should be met through these sources. Suitable enablers such as Capital Subsidies and Net Metering policies need to be put in place to promote Renewable Generation. Solar panel installations on just 1.6 per cent of Delhi’s roof space is sufficient to generate 2 GW of electricity by 2020, says a recent study ‘Rooftop Revolution: Unleashing Delhi’s Solar Potential’ I. Establishment of Peaking Capacities – Immediate need to establish Peaking capacities to meet the peak load requirements with fuel contracts in place to support peaking capacities. Addition of base load capacities shall always leave discoms in surplus power situation during off peak or off season which are then required to be disposed through short term mechanisms. Further, the large and rapid variations in supply from renewable sources require availability of flexible alternative generation resources as spinning reserves to maintain integrity of the grid.