Download as PDF, PPTX
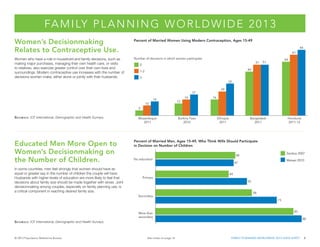
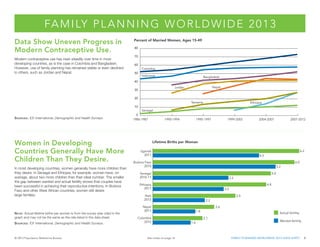
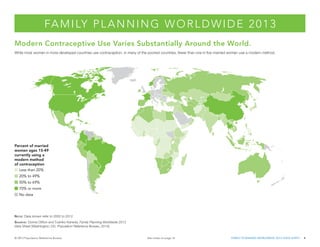
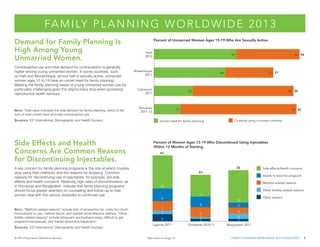
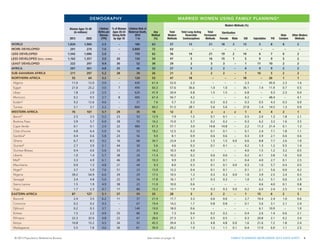
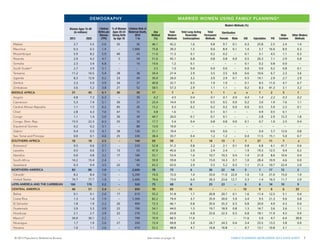
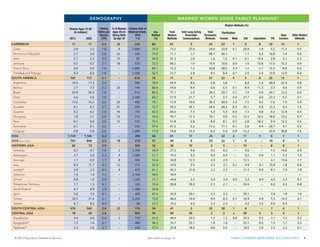
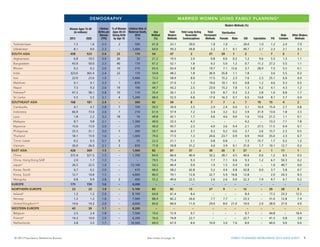
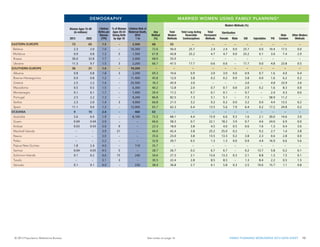
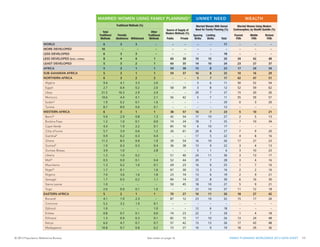
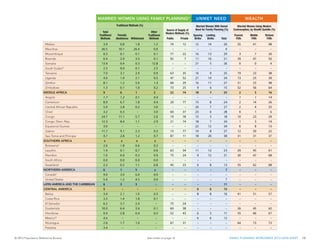

The 2013 Family Planning Worldwide data sheet highlights the correlation between women's decision-making power and the use of modern contraception, noting that educated men are more likely to support women's participation in family planning decisions. While many developing countries have seen an increase in contraceptive use, some have reported stability or declines, and women often have more children than desired, illustrating a gap between actual and wanted fertility. The document underscores the importance of addressing the unmet family planning needs of young unmarried women and the challenges posed by health concerns related to contraceptive use.