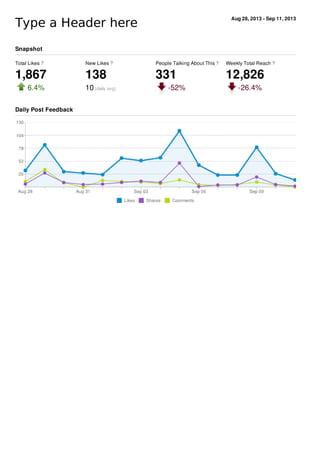
- The document provides analytics for a Facebook page from August 28, 2013 to September 11, 2013.
- It shows metrics such as total likes, new likes, people talking about the page, weekly total reach, and data on individual posts' performance.
- The top performing post from September 5th received 1,634 impressions and 138 interactions from users.
Presentation from EFMA conference, 29th May 2013. Covers the reasons and stories about how insecure our world is today, followed by recommendations for banks to make it more secure.
Take a deep dive into Sprite's social media efforts as it talks about lifestyle and new products to keep its fanbase engaged and thinking about the brand.
This PowerPoint is mainly organized by Carole Zhou. However, my other teammates have participated in correction or revising. Please contact me when concerning the copyright issue.
Not only does Spring and Summer mean warmer temperatures, but it also means more rain, which often leads to flooding. Wet roads and flooding cause over 1 million car accidents each year. Here are some tips to follow for a safer drive in the rain:
Learn how Tiger's reputation has been impacted by the accident and news of the affairs through an analysis of conversations about him in social media.
Analytics by Social Radar
Auto Insurance Brands on Social Media Q4 2015Unmetric
Take a deep dive in to the social media metrics behind the
Auto Insurance Brands incredible social media presence.
See the strategies that drove audience engagement and the content that outperformed everything else.
MarkPlus on Indonesia Internet Users 2013 - Marketeers Nov 2013 editionWaizly Darwin
Some thoughts and analysis on Indonesia Internet Users in 2013, Penetration, segmentation, spending habits of the netizens.
Note: This document was presented at Jakarta Marketeers Club Dinner Seminar in October 2013 and published for Marketeers Magazine November 2013 Issue "What's Wrong with Michael Porter" which got a gold medal at Indonesia Print Media Award (IPMA) 2014.
Take a deep dive into Xerox' social media performance as they educate their fanbase about their range of products and the impact Xerox technology has on their lives.
2013 Edelman Global Entertainment Study - BrazilEdelman
Edelman’s Global Entertainment Study highlights the importance and prevalence of entertainment in people’s daily lives, and how technology has enabled its consumption and sharing on a global basis. Now in its seventh year, the study, co-commissioned by Edelman and MATTER and fielded by Edelman Berland, has expanded beyond the U.S. and U.K. to include Brazil, China, Germany, India, Korea and Turkey. Here you will find the results focused on the Brazilian market.
2021 Social Media Monthly Report TemplateSocial Status
We've updated our social media report template for 2021.
It now covers 3 sections:
Profile Analytics: containing the pages and profiles you own or have admin access to including Facebook, Instagram, Twitter, YouTube and LinkedIn
Ads Analytics: containing your Facebook Ad Account and all your paid campaign metrics on Facebook, Instagram, Messenger and the Audience Network.
Competitor Analytics: containing competitor benchmarking for any public Facebook Pages, Instagram Business Profiles, Twitter Profiles and YouTube Channels.
-------
Automate this report every week, fortnight, month, quarter or year with Social Status: https://www.socialstatus.io/
For a full explanation of the metrics and calculations used in this social media reporting template, visit our channel-specific guides:
Facebook: https://www.socialstatus.io/facebook-metrics/
Instagram: https://www.socialstatus.io/instagram-metrics/
Twitter: https://www.socialstatus.io/twitter-metrics/
YouTube: https://www.socialstatus.io/youtube-metrics/
LinkedIn: https://www.socialstatus.io/linkedin-metrics/
Export boardroom-ready reports to PDF, PowerPoint PPTX or Google Slides.
Agencies: white-label our reports, add your logo, fonts and colors.
UiPath Test Automation using UiPath Test Suite series, part 4DianaGray10
Welcome to UiPath Test Automation using UiPath Test Suite series part 4. In this session, we will cover Test Manager overview along with SAP heatmap.
The UiPath Test Manager overview with SAP heatmap webinar offers a concise yet comprehensive exploration of the role of a Test Manager within SAP environments, coupled with the utilization of heatmaps for effective testing strategies.
Participants will gain insights into the responsibilities, challenges, and best practices associated with test management in SAP projects. Additionally, the webinar delves into the significance of heatmaps as a visual aid for identifying testing priorities, areas of risk, and resource allocation within SAP landscapes. Through this session, attendees can expect to enhance their understanding of test management principles while learning practical approaches to optimize testing processes in SAP environments using heatmap visualization techniques
What will you get from this session?
1. Insights into SAP testing best practices
2. Heatmap utilization for testing
3. Optimization of testing processes
4. Demo
Topics covered:
Execution from the test manager
Orchestrator execution result
Defect reporting
SAP heatmap example with demo
Speaker:
Deepak Rai, Automation Practice Lead, Boundaryless Group and UiPath MVP
Dev Dives: Train smarter, not harder – active learning and UiPath LLMs for do...UiPathCommunity
💥 Speed, accuracy, and scaling – discover the superpowers of GenAI in action with UiPath Document Understanding and Communications Mining™:
See how to accelerate model training and optimize model performance with active learning
Learn about the latest enhancements to out-of-the-box document processing – with little to no training required
Get an exclusive demo of the new family of UiPath LLMs – GenAI models specialized for processing different types of documents and messages
This is a hands-on session specifically designed for automation developers and AI enthusiasts seeking to enhance their knowledge in leveraging the latest intelligent document processing capabilities offered by UiPath.
Speakers:
👨🏫 Andras Palfi, Senior Product Manager, UiPath
👩🏫 Lenka Dulovicova, Product Program Manager, UiPath
Elevating Tactical DDD Patterns Through Object CalisthenicsDorra BARTAGUIZ
After immersing yourself in the blue book and its red counterpart, attending DDD-focused conferences, and applying tactical patterns, you're left with a crucial question: How do I ensure my design is effective? Tactical patterns within Domain-Driven Design (DDD) serve as guiding principles for creating clear and manageable domain models. However, achieving success with these patterns requires additional guidance. Interestingly, we've observed that a set of constraints initially designed for training purposes remarkably aligns with effective pattern implementation, offering a more ‘mechanical’ approach. Let's explore together how Object Calisthenics can elevate the design of your tactical DDD patterns, offering concrete help for those venturing into DDD for the first time!
State of ICS and IoT Cyber Threat Landscape Report 2024 previewPrayukth K V
The IoT and OT threat landscape report has been prepared by the Threat Research Team at Sectrio using data from Sectrio, cyber threat intelligence farming facilities spread across over 85 cities around the world. In addition, Sectrio also runs AI-based advanced threat and payload engagement facilities that serve as sinks to attract and engage sophisticated threat actors, and newer malware including new variants and latent threats that are at an earlier stage of development.
The latest edition of the OT/ICS and IoT security Threat Landscape Report 2024 also covers:
State of global ICS asset and network exposure
Sectoral targets and attacks as well as the cost of ransom
Global APT activity, AI usage, actor and tactic profiles, and implications
Rise in volumes of AI-powered cyberattacks
Major cyber events in 2024
Malware and malicious payload trends
Cyberattack types and targets
Vulnerability exploit attempts on CVEs
Attacks on counties – USA
Expansion of bot farms – how, where, and why
In-depth analysis of the cyber threat landscape across North America, South America, Europe, APAC, and the Middle East
Why are attacks on smart factories rising?
Cyber risk predictions
Axis of attacks – Europe
Systemic attacks in the Middle East
Download the full report from here:
https://sectrio.com/resources/ot-threat-landscape-reports/sectrio-releases-ot-ics-and-iot-security-threat-landscape-report-2024/
UiPath Test Automation using UiPath Test Suite series, part 3DianaGray10
Welcome to UiPath Test Automation using UiPath Test Suite series part 3. In this session, we will cover desktop automation along with UI automation.
Topics covered:
UI automation Introduction,
UI automation Sample
Desktop automation flow
Pradeep Chinnala, Senior Consultant Automation Developer @WonderBotz and UiPath MVP
Deepak Rai, Automation Practice Lead, Boundaryless Group and UiPath MVP
JMeter webinar - integration with InfluxDB and GrafanaRTTS
Watch this recorded webinar about real-time monitoring of application performance. See how to integrate Apache JMeter, the open-source leader in performance testing, with InfluxDB, the open-source time-series database, and Grafana, the open-source analytics and visualization application.
In this webinar, we will review the benefits of leveraging InfluxDB and Grafana when executing load tests and demonstrate how these tools are used to visualize performance metrics.
Length: 30 minutes
Session Overview
-------------------------------------------
During this webinar, we will cover the following topics while demonstrating the integrations of JMeter, InfluxDB and Grafana:
- What out-of-the-box solutions are available for real-time monitoring JMeter tests?
- What are the benefits of integrating InfluxDB and Grafana into the load testing stack?
- Which features are provided by Grafana?
- Demonstration of InfluxDB and Grafana using a practice web application
To view the webinar recording, go to:
https://www.rttsweb.com/jmeter-integration-webinar
Slack (or Teams) Automation for Bonterra Impact Management (fka Social Soluti...Jeffrey Haguewood
Sidekick Solutions uses Bonterra Impact Management (fka Social Solutions Apricot) and automation solutions to integrate data for business workflows.
We believe integration and automation are essential to user experience and the promise of efficient work through technology. Automation is the critical ingredient to realizing that full vision. We develop integration products and services for Bonterra Case Management software to support the deployment of automations for a variety of use cases.
This video focuses on the notifications, alerts, and approval requests using Slack for Bonterra Impact Management. The solutions covered in this webinar can also be deployed for Microsoft Teams.
Interested in deploying notification automations for Bonterra Impact Management? Contact us at sales@sidekicksolutionsllc.com to discuss next steps.
The Art of the Pitch: WordPress Relationships and SalesLaura Byrne
Clients don’t know what they don’t know. What web solutions are right for them? How does WordPress come into the picture? How do you make sure you understand scope and timeline? What do you do if sometime changes?
All these questions and more will be explored as we talk about matching clients’ needs with what your agency offers without pulling teeth or pulling your hair out. Practical tips, and strategies for successful relationship building that leads to closing the deal.
Essentials of Automations: Optimizing FME Workflows with ParametersSafe Software
Are you looking to streamline your workflows and boost your projects’ efficiency? Do you find yourself searching for ways to add flexibility and control over your FME workflows? If so, you’re in the right place.
Join us for an insightful dive into the world of FME parameters, a critical element in optimizing workflow efficiency. This webinar marks the beginning of our three-part “Essentials of Automation” series. This first webinar is designed to equip you with the knowledge and skills to utilize parameters effectively: enhancing the flexibility, maintainability, and user control of your FME projects.
Here’s what you’ll gain:
- Essentials of FME Parameters: Understand the pivotal role of parameters, including Reader/Writer, Transformer, User, and FME Flow categories. Discover how they are the key to unlocking automation and optimization within your workflows.
- Practical Applications in FME Form: Delve into key user parameter types including choice, connections, and file URLs. Allow users to control how a workflow runs, making your workflows more reusable. Learn to import values and deliver the best user experience for your workflows while enhancing accuracy.
- Optimization Strategies in FME Flow: Explore the creation and strategic deployment of parameters in FME Flow, including the use of deployment and geometry parameters, to maximize workflow efficiency.
- Pro Tips for Success: Gain insights on parameterizing connections and leveraging new features like Conditional Visibility for clarity and simplicity.
We’ll wrap up with a glimpse into future webinars, followed by a Q&A session to address your specific questions surrounding this topic.
Don’t miss this opportunity to elevate your FME expertise and drive your projects to new heights of efficiency.
LF Energy Webinar: Electrical Grid Modelling and Simulation Through PowSyBl -...DanBrown980551
Do you want to learn how to model and simulate an electrical network from scratch in under an hour?
Then welcome to this PowSyBl workshop, hosted by Rte, the French Transmission System Operator (TSO)!
During the webinar, you will discover the PowSyBl ecosystem as well as handle and study an electrical network through an interactive Python notebook.
PowSyBl is an open source project hosted by LF Energy, which offers a comprehensive set of features for electrical grid modelling and simulation. Among other advanced features, PowSyBl provides:
- A fully editable and extendable library for grid component modelling;
- Visualization tools to display your network;
- Grid simulation tools, such as power flows, security analyses (with or without remedial actions) and sensitivity analyses;
The framework is mostly written in Java, with a Python binding so that Python developers can access PowSyBl functionalities as well.
What you will learn during the webinar:
- For beginners: discover PowSyBl's functionalities through a quick general presentation and the notebook, without needing any expert coding skills;
- For advanced developers: master the skills to efficiently apply PowSyBl functionalities to your real-world scenarios.
Generating a custom Ruby SDK for your web service or Rails API using Smithyg2nightmarescribd
Have you ever wanted a Ruby client API to communicate with your web service? Smithy is a protocol-agnostic language for defining services and SDKs. Smithy Ruby is an implementation of Smithy that generates a Ruby SDK using a Smithy model. In this talk, we will explore Smithy and Smithy Ruby to learn how to generate custom feature-rich SDKs that can communicate with any web service, such as a Rails JSON API.
Generating a custom Ruby SDK for your web service or Rails API using Smithy
Facebook insights the illuminati network (2) (2013 10-11 23_39_05 utc)
1. Aug 28, 2013 - Sep 11, 2013
Type a Header hereType a Header here
Total Likes ?
1,867
6.4%
New Likes ?
138
10 (daily avg)
People Talking About This ?
331
-52%
Weekly Total Reach ?
12,826
-26.4%
Snapshot
Daily Post Feedback
2. Top 10 by Talking About This
TypeType DateDate PostPost ReachReach 11 EngagedEngaged
UsersUsers 22
TalkingTalking
About ThisAbout This 33 ViralityVirality 44
Sep 5, 2013 (From the CEO) 1634 138 107 6.55%
Sep 9, 2013
Monday 9/9/13
Live Talk
Radio...
1290 75 59 4.57%
Sep 6, 2013
This is our
newest member
of the...
265 43 21 7.92%
Sep 7, 2013
Being fearless
does not
mean...
631 25 19 3.01%
Sep 2, 2013
Have Fun And
Money Will
Come~...
304 21 17 5.59%
Sep 9, 2013
go live in 10
minutes......
307 20 16 5.21%
Aug 29, 2013
Radioactive
Bluefin Tuna
Caught...
208 15 15 7.21%
Aug 29, 2013
800 Million
Pounds of
Pesticides...
129 13 13 10.08%
Sep 10, 2013
I am very proud
of my brother...
373 46 13 3.49%
Aug 29, 2013
Here's
something to
assuage the...
197 26 11 5.58%
1. The number of unique people who have seen your post. Click on the number to see more details. Figures are for the first 28
days after a post's publication only. Click on "Reach" to sort your posts.
2. The number of unique people who have clicked on your post. Click on the number to see more details. Figures are for the first
28 days after a post's publication only. Click on "Engaged Users" to sort your posts.
3. The number of unique people who have created a story from your Page post. Stories are created when someone likes,
comments on or shares your post; answers a question you posted; or responds to your event. Click on the number to see
more details. Figures are for the first 28 days after a post's publication only. Click on "Talking About This" to sort your posts.
4. The percentage of people who have created a story from your Page post out of the total number of unique people who have
seen it. Click on "Virality" to sort your posts.
Per-Post Metrics Top 10
3. Countries Likes
United States 1,322
United Kingdom 75
Canada 58
Nigeria 30
Australia 27
India 24
South Africa 22
Brazil 18
Turkey 17
Kenya 17
35 more countries 196
Likes by Region Likes by Demographic - Graphical
Age Male Female
13-17 2% 1.3%
18-24 10.1% 2.6%
25-34 8.9% 8.1%
35-44 9.1% 12.2%
45-54 8.9% 16.4%
55-64 5.1% 9.1%
65+ 2.5% 2.9%
Likes by Demographic - Tabular
Daily Likes
4. Languages Likes
U.S. English 1,541
British English 169
Spanish (Laos) 20
Brazilian Portuguese 16
French (France) 15
Turkish (Turkey) 15
Greek (Greece) 10
Iberian Spanish 10
Italian (Italy) 9
Dutch (Netherlands) 8
22 more languages 54
Likes by Language
Sources Likes
Page Profile 40
External Connect 25
Mobile 19
Reminder Box Invite 18
Mobile Ads 9
Page Invite 6
Fan Context Story 6
Page Post Like Story 4
Sponsored Story 3
Hovercard 3
4 more sources 5
Likes by Source