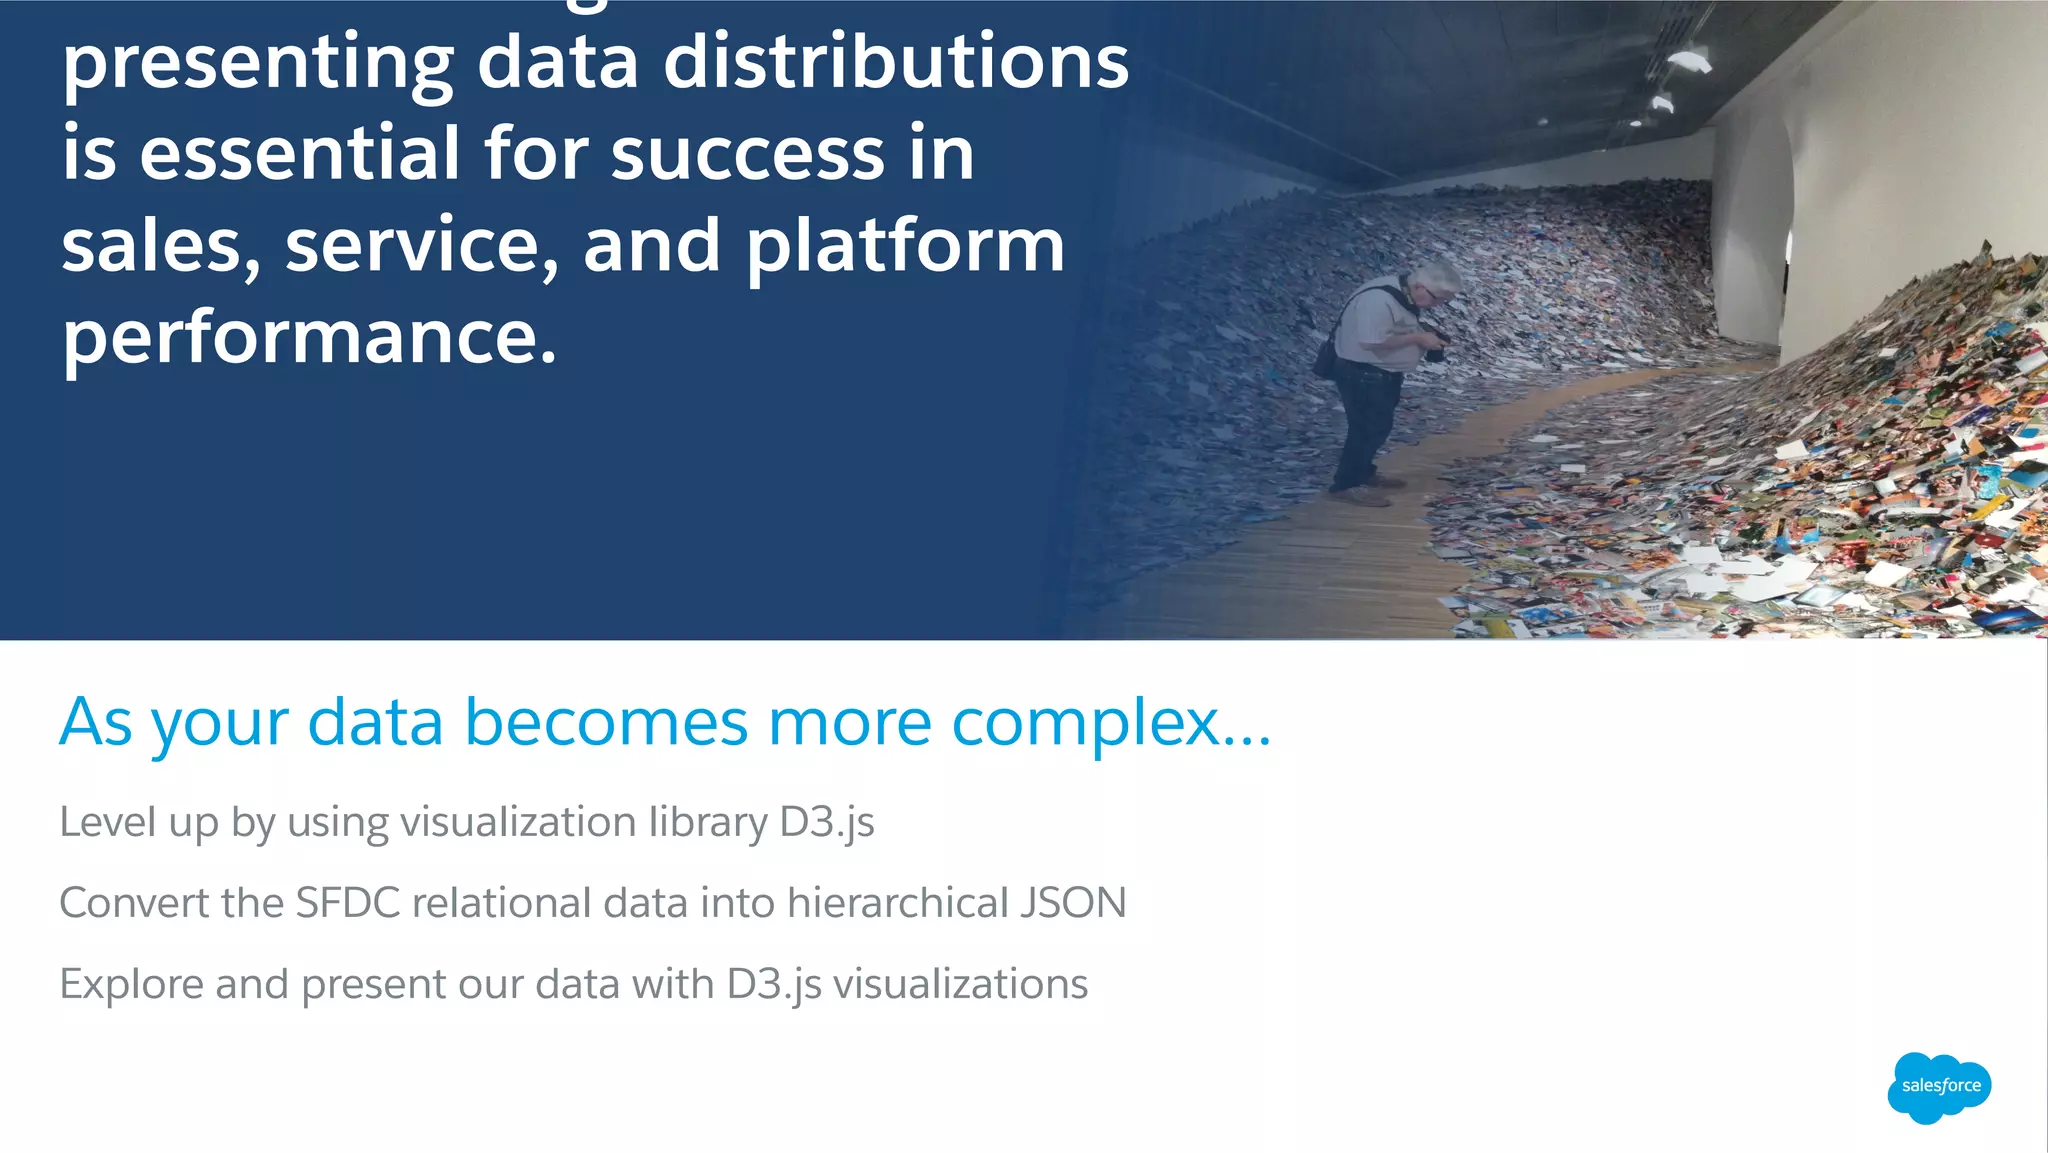
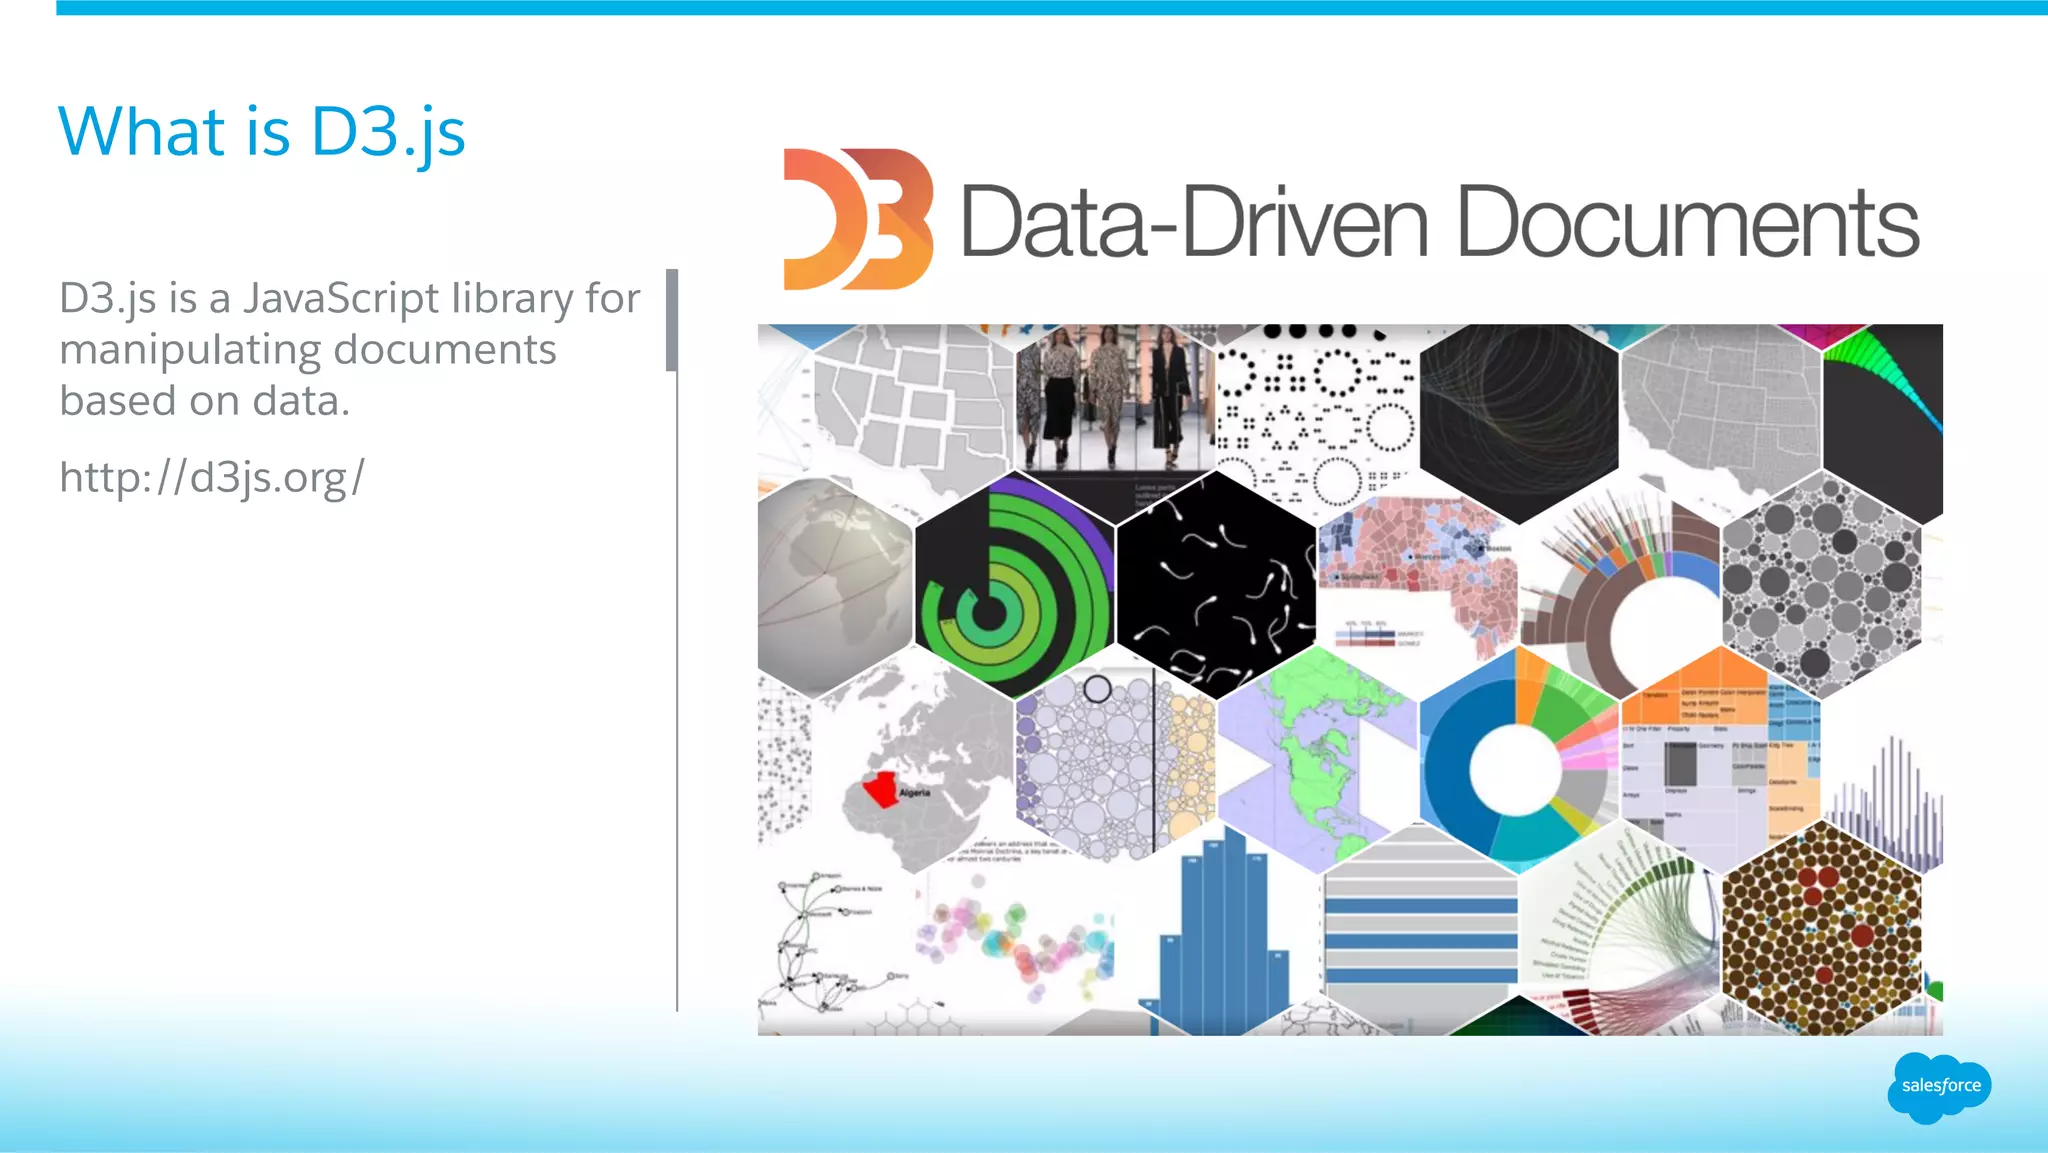
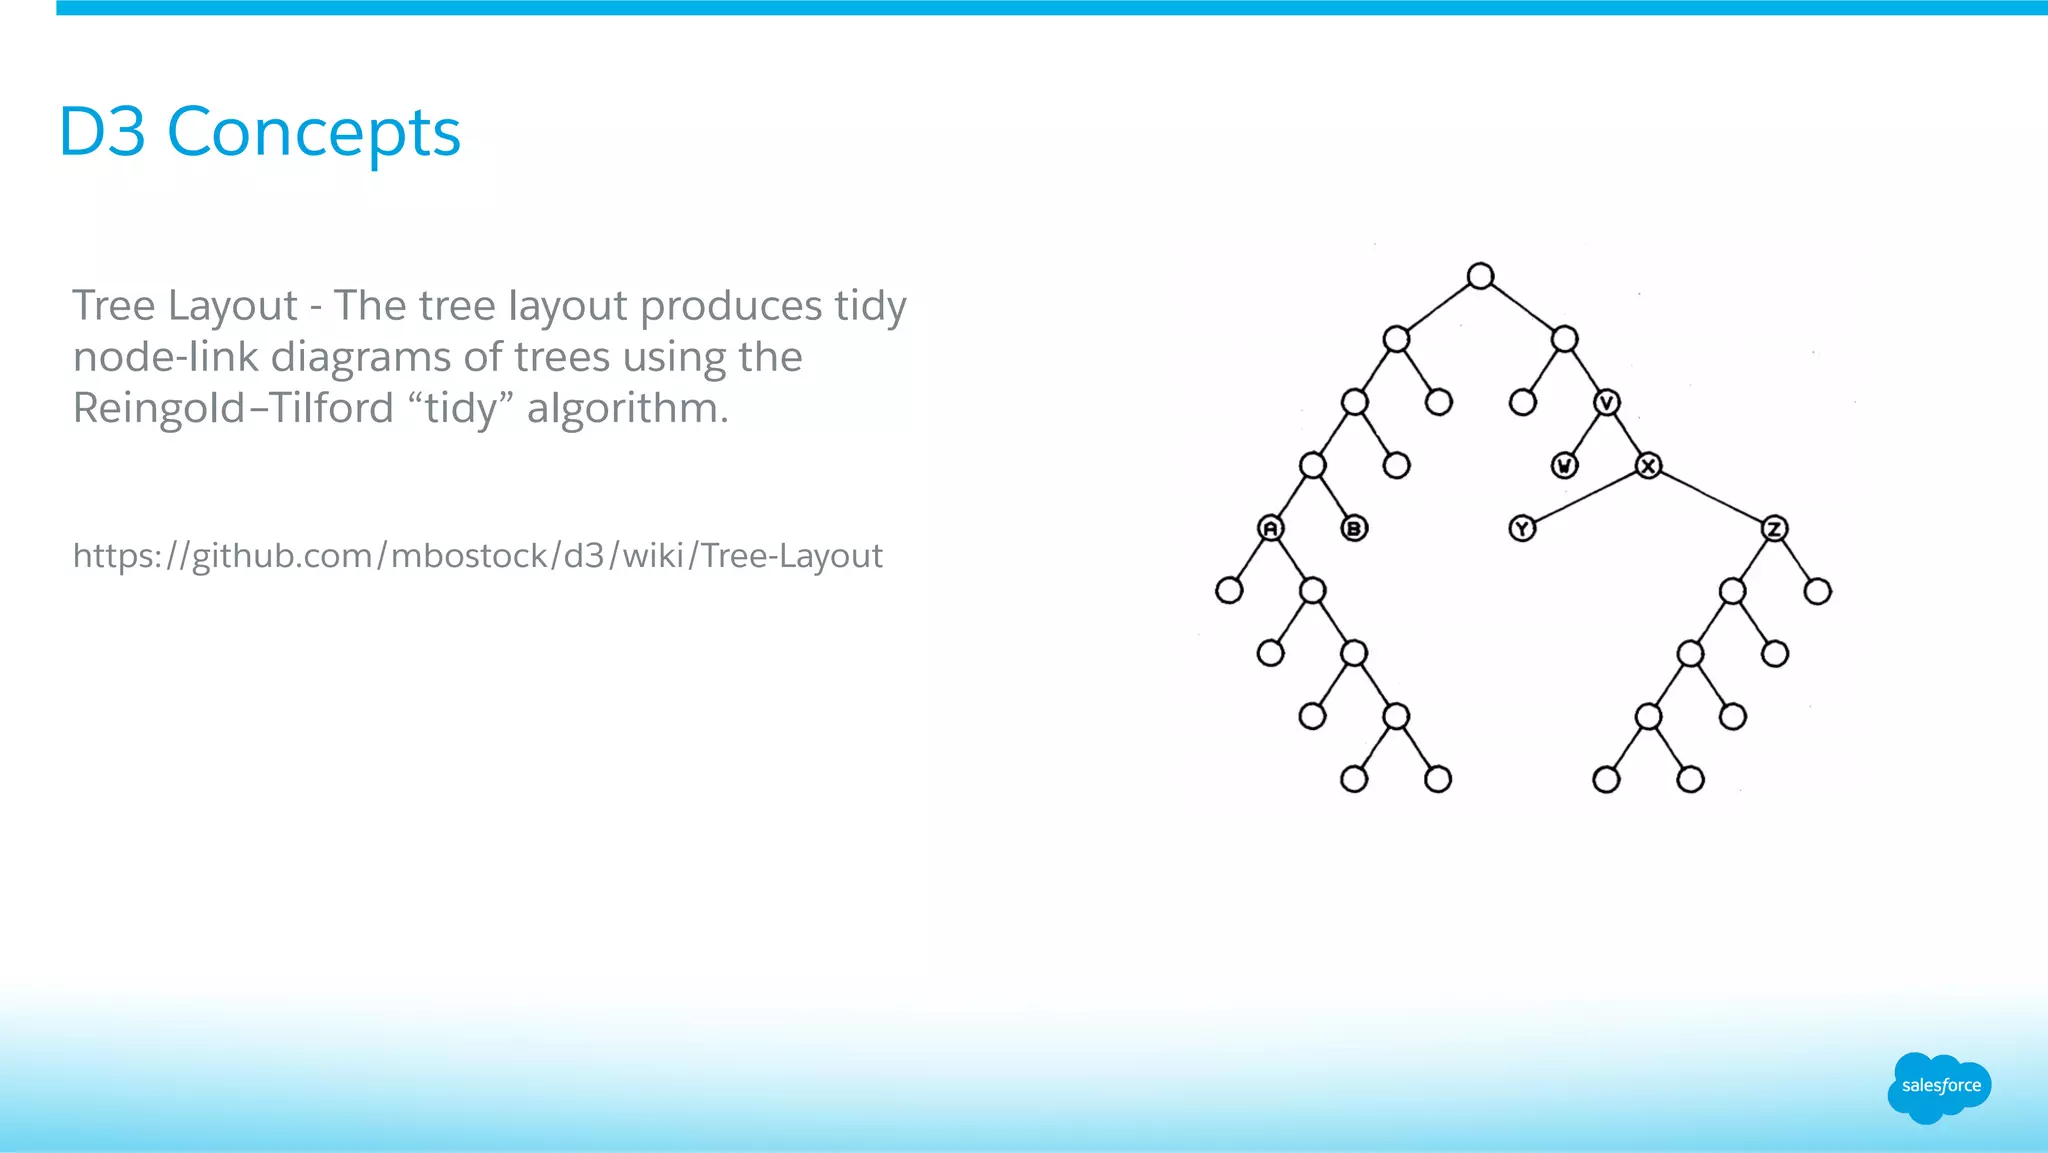
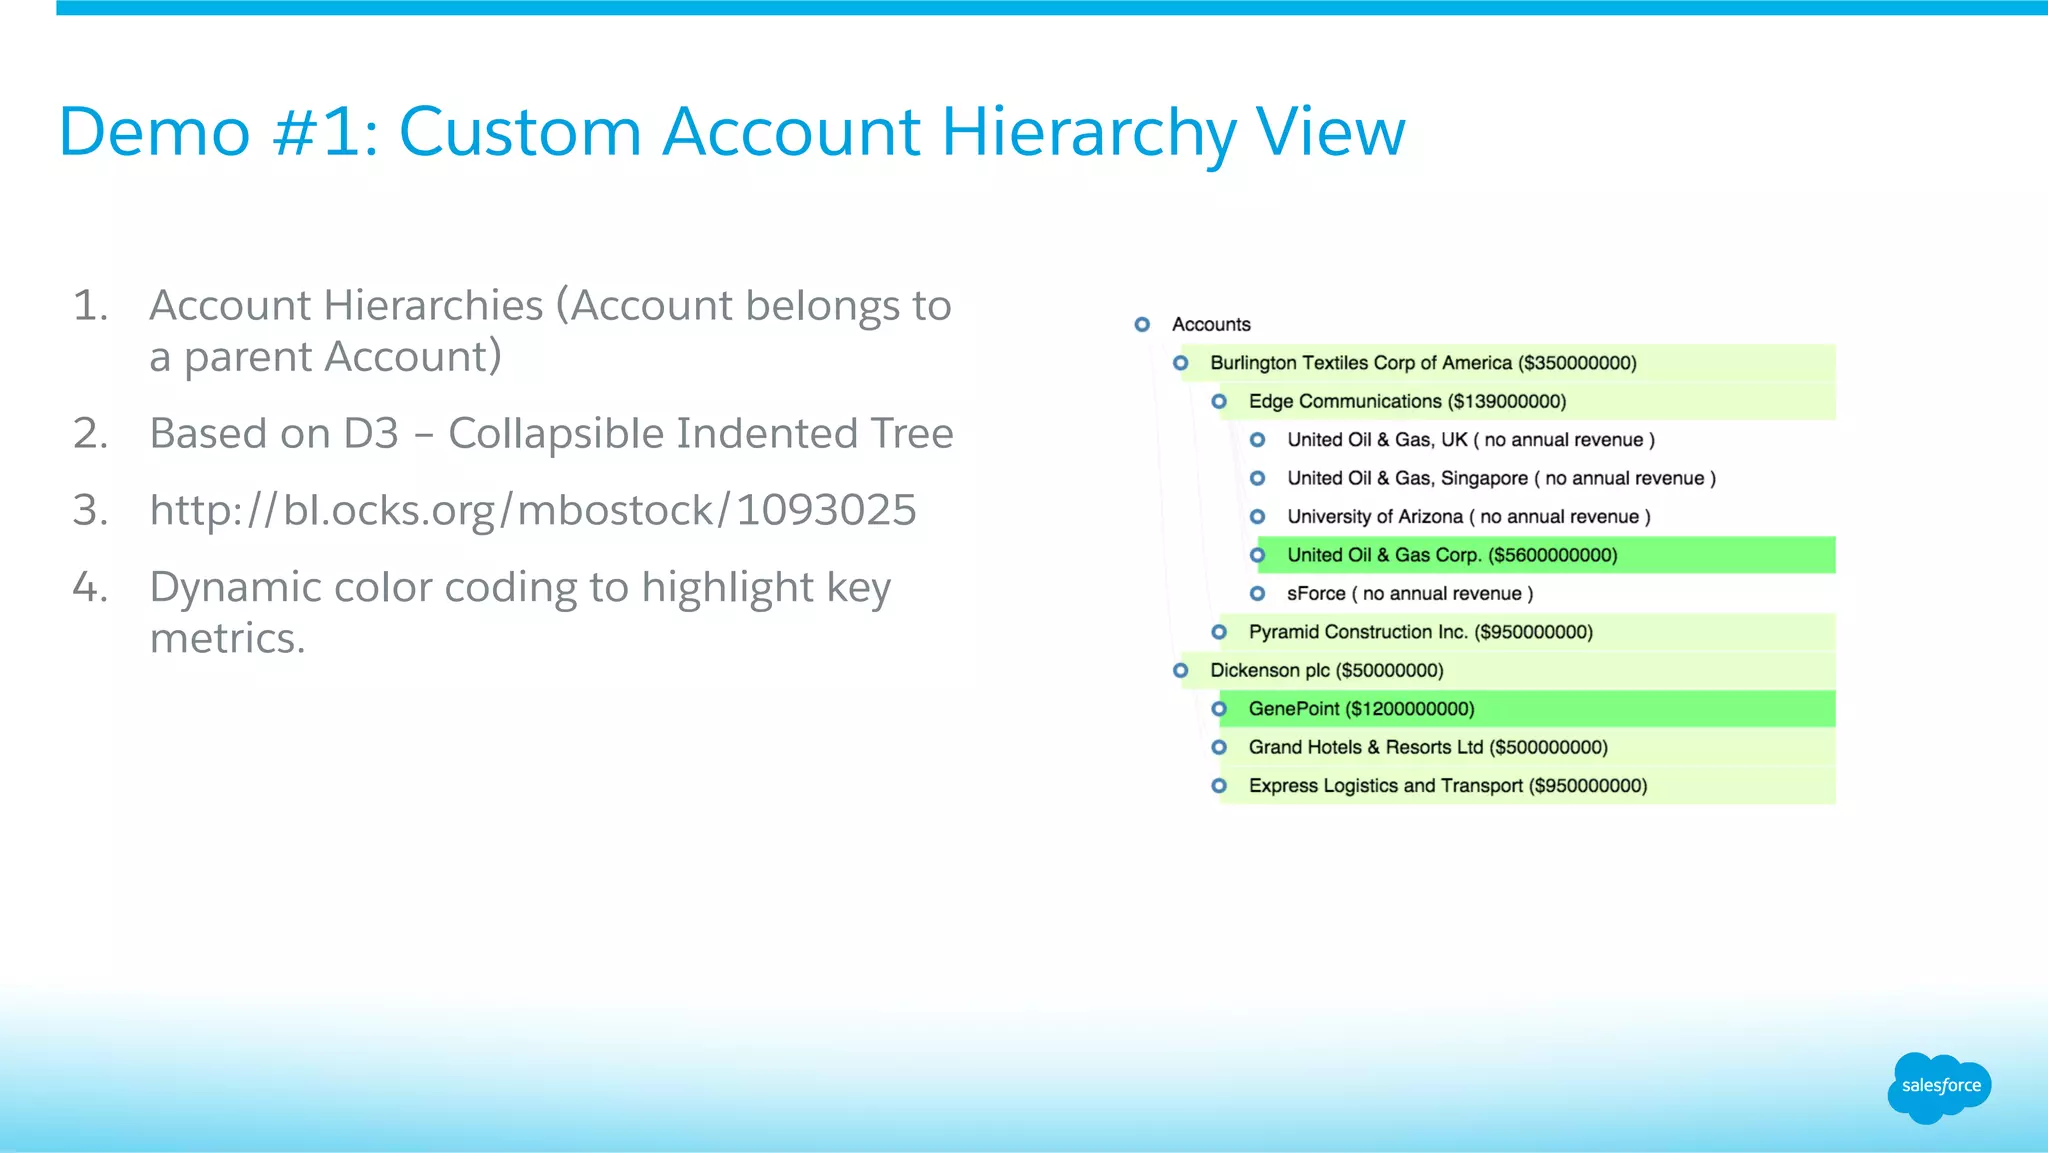
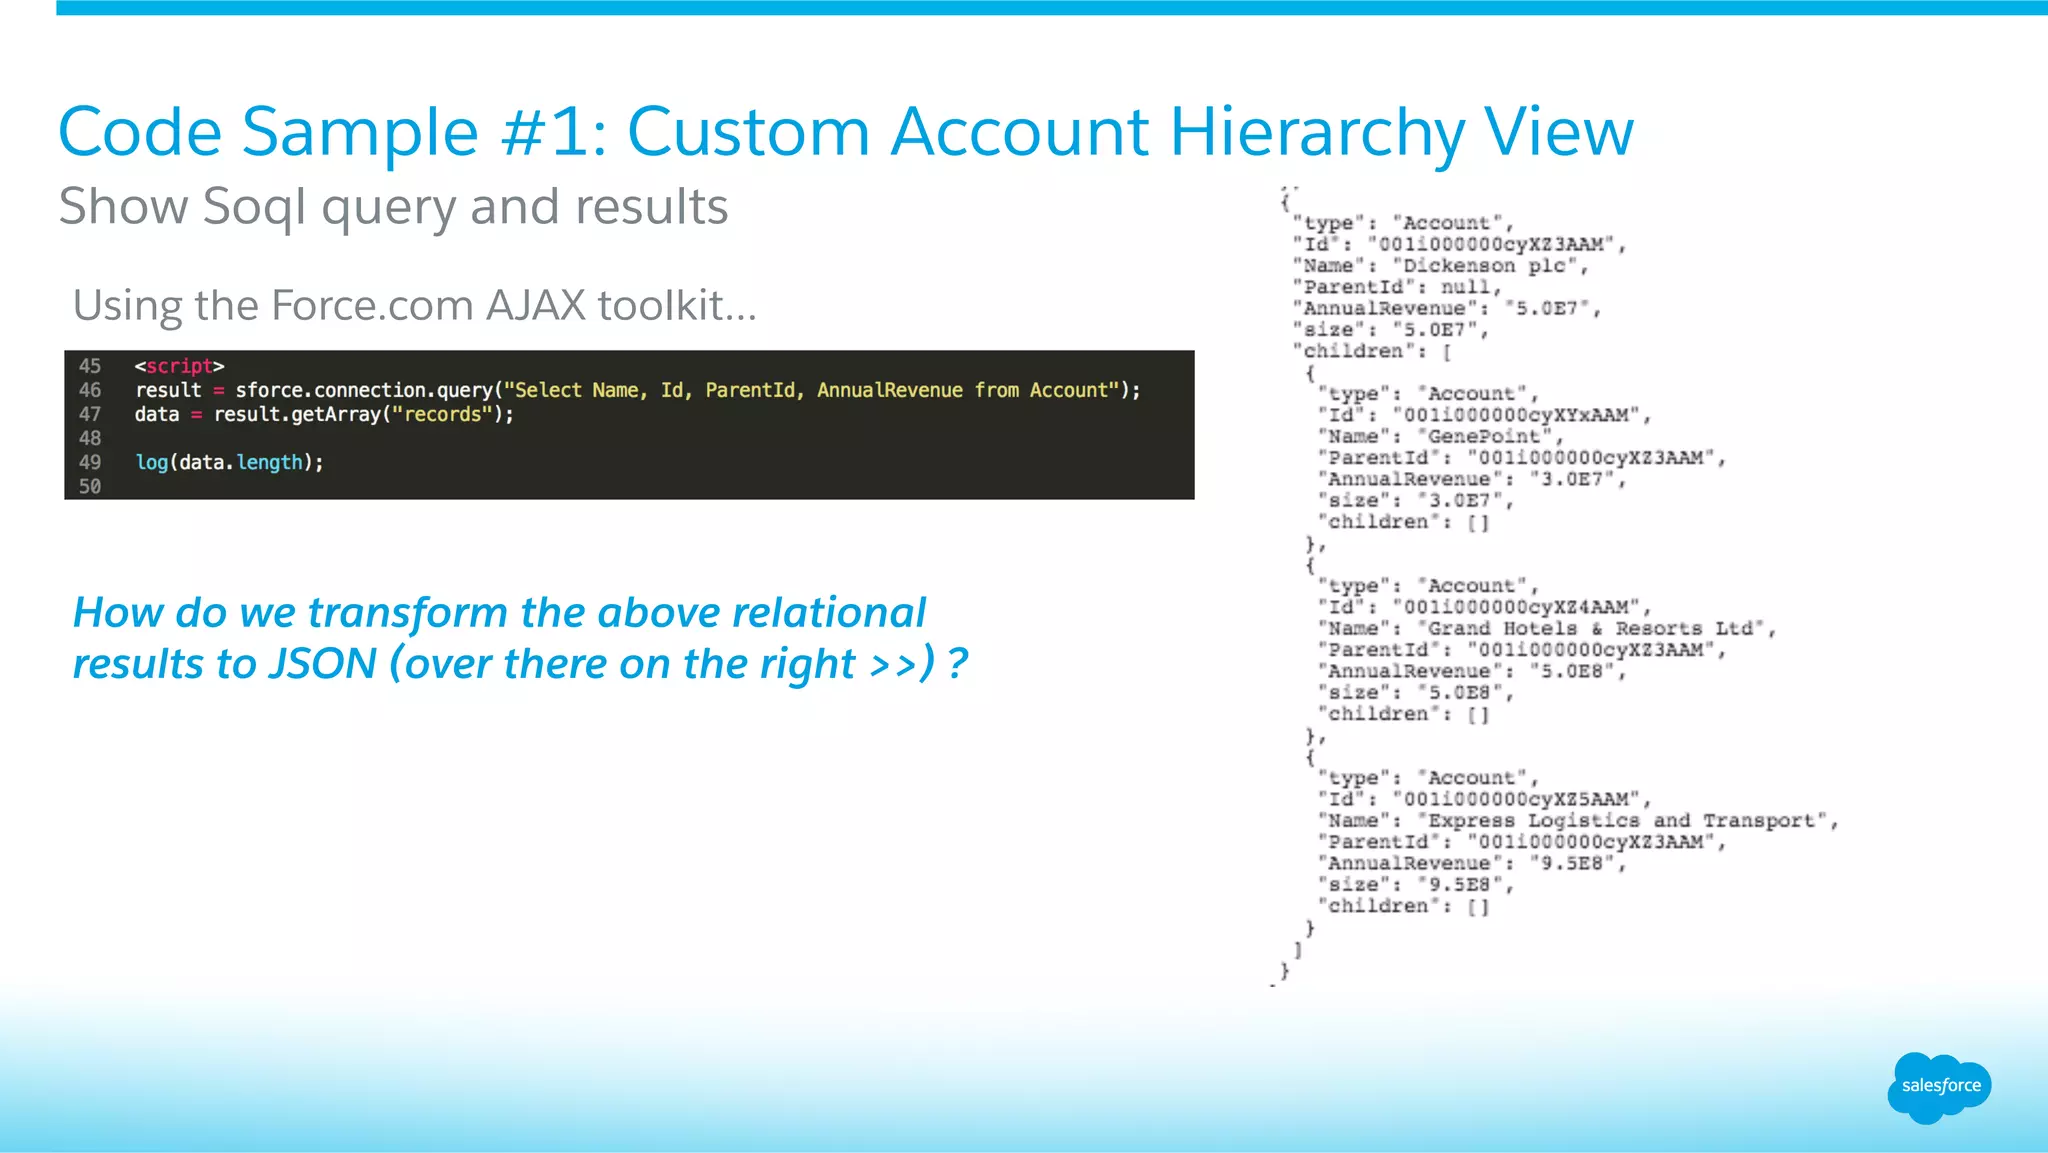
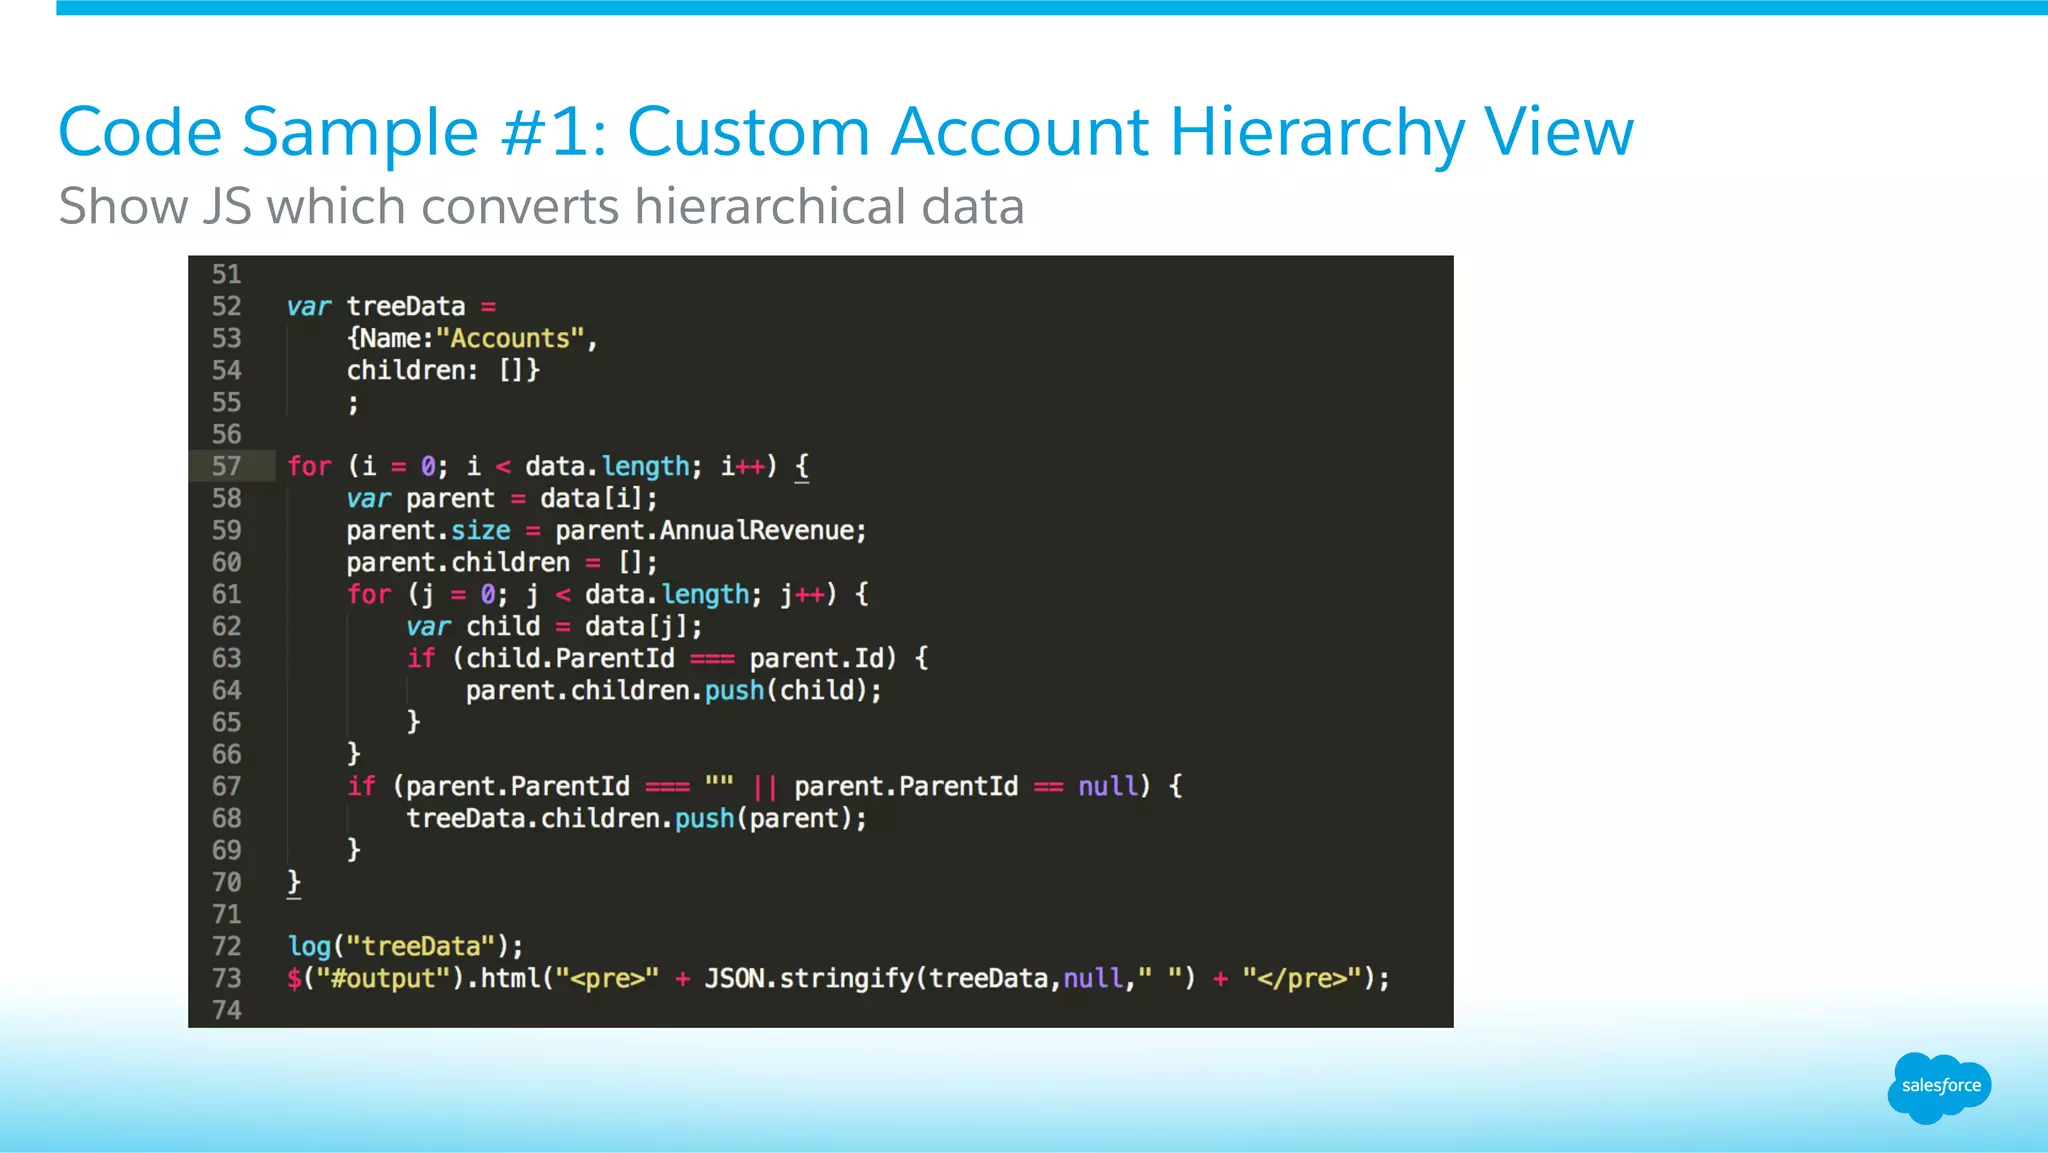
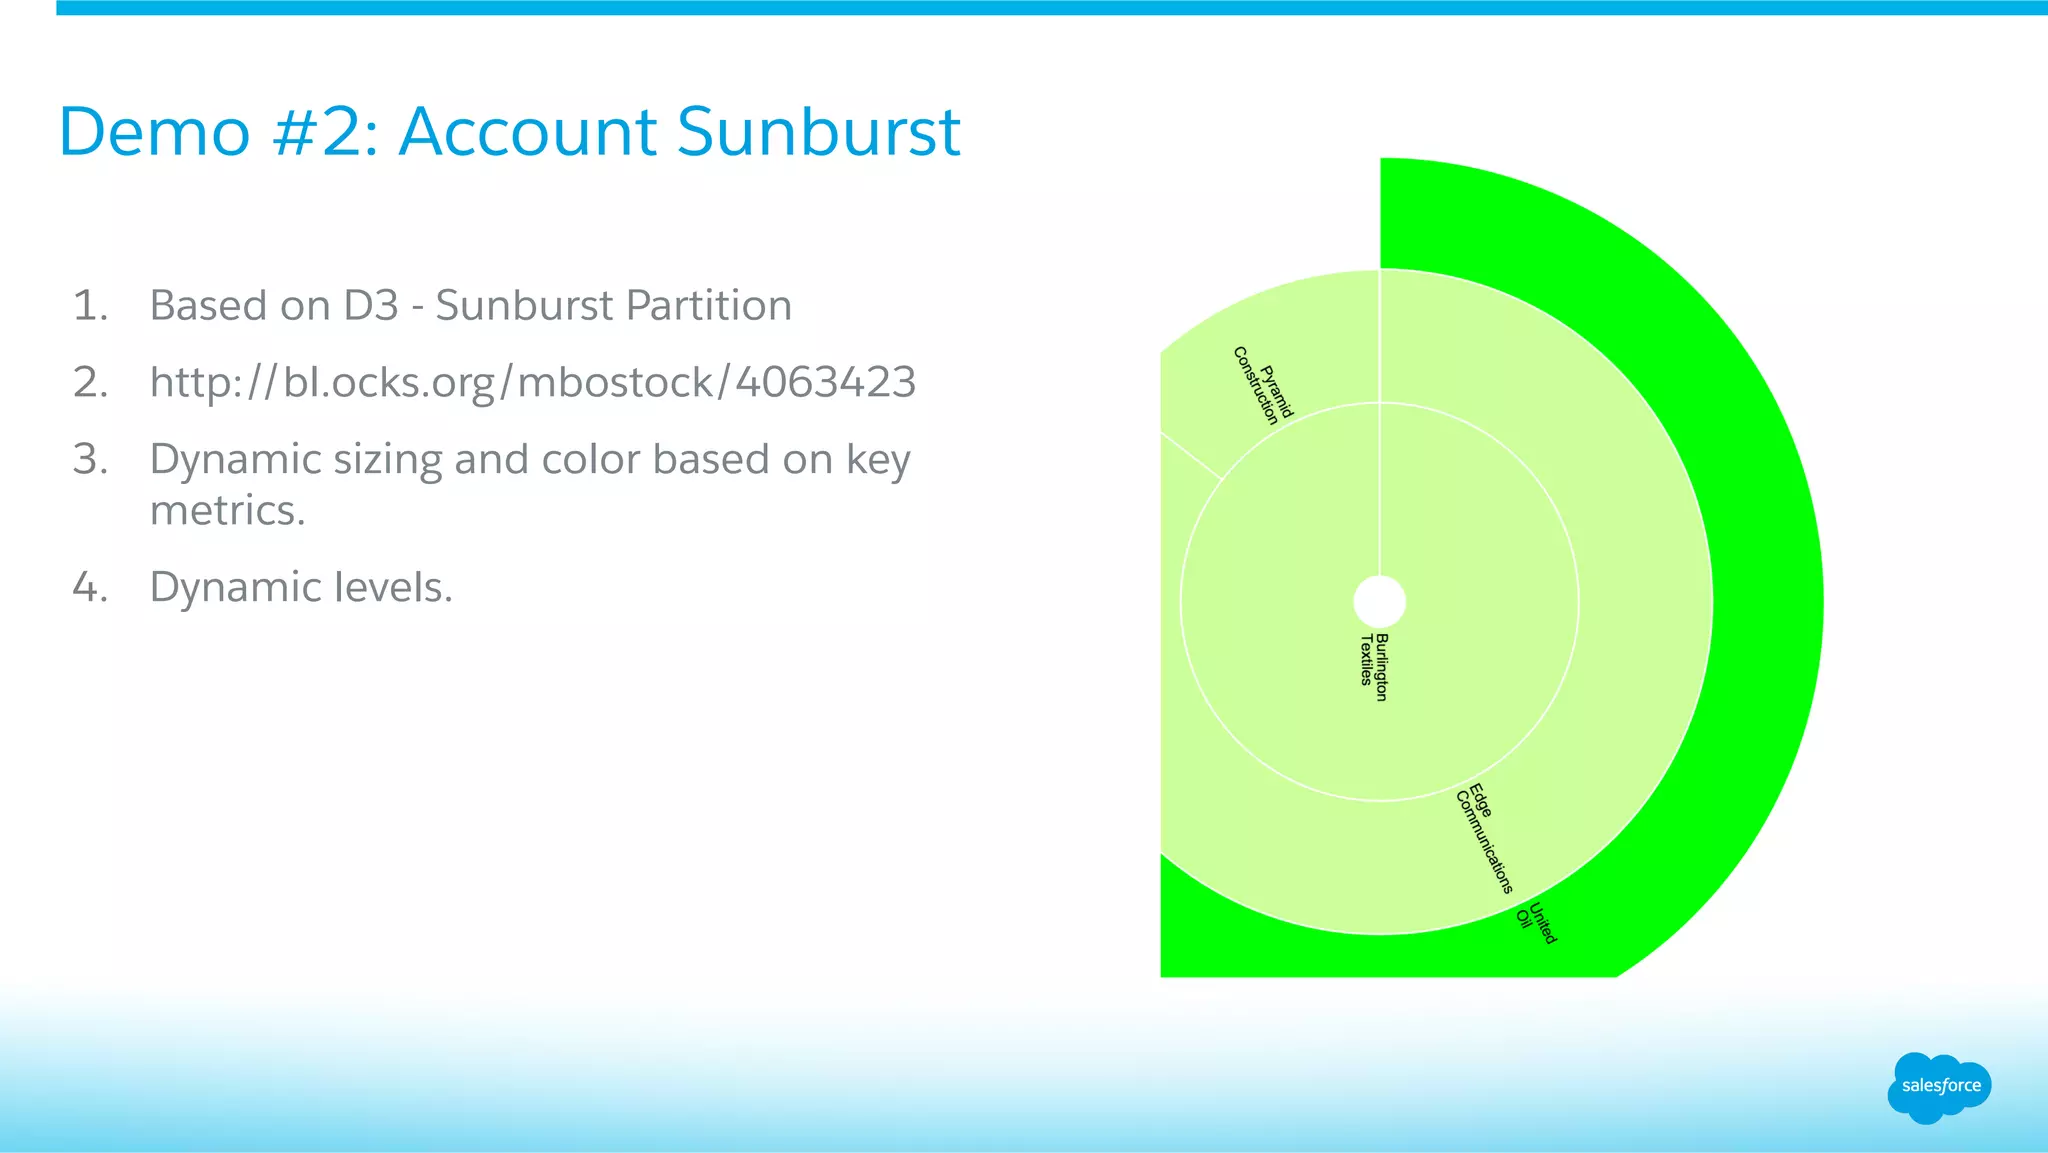
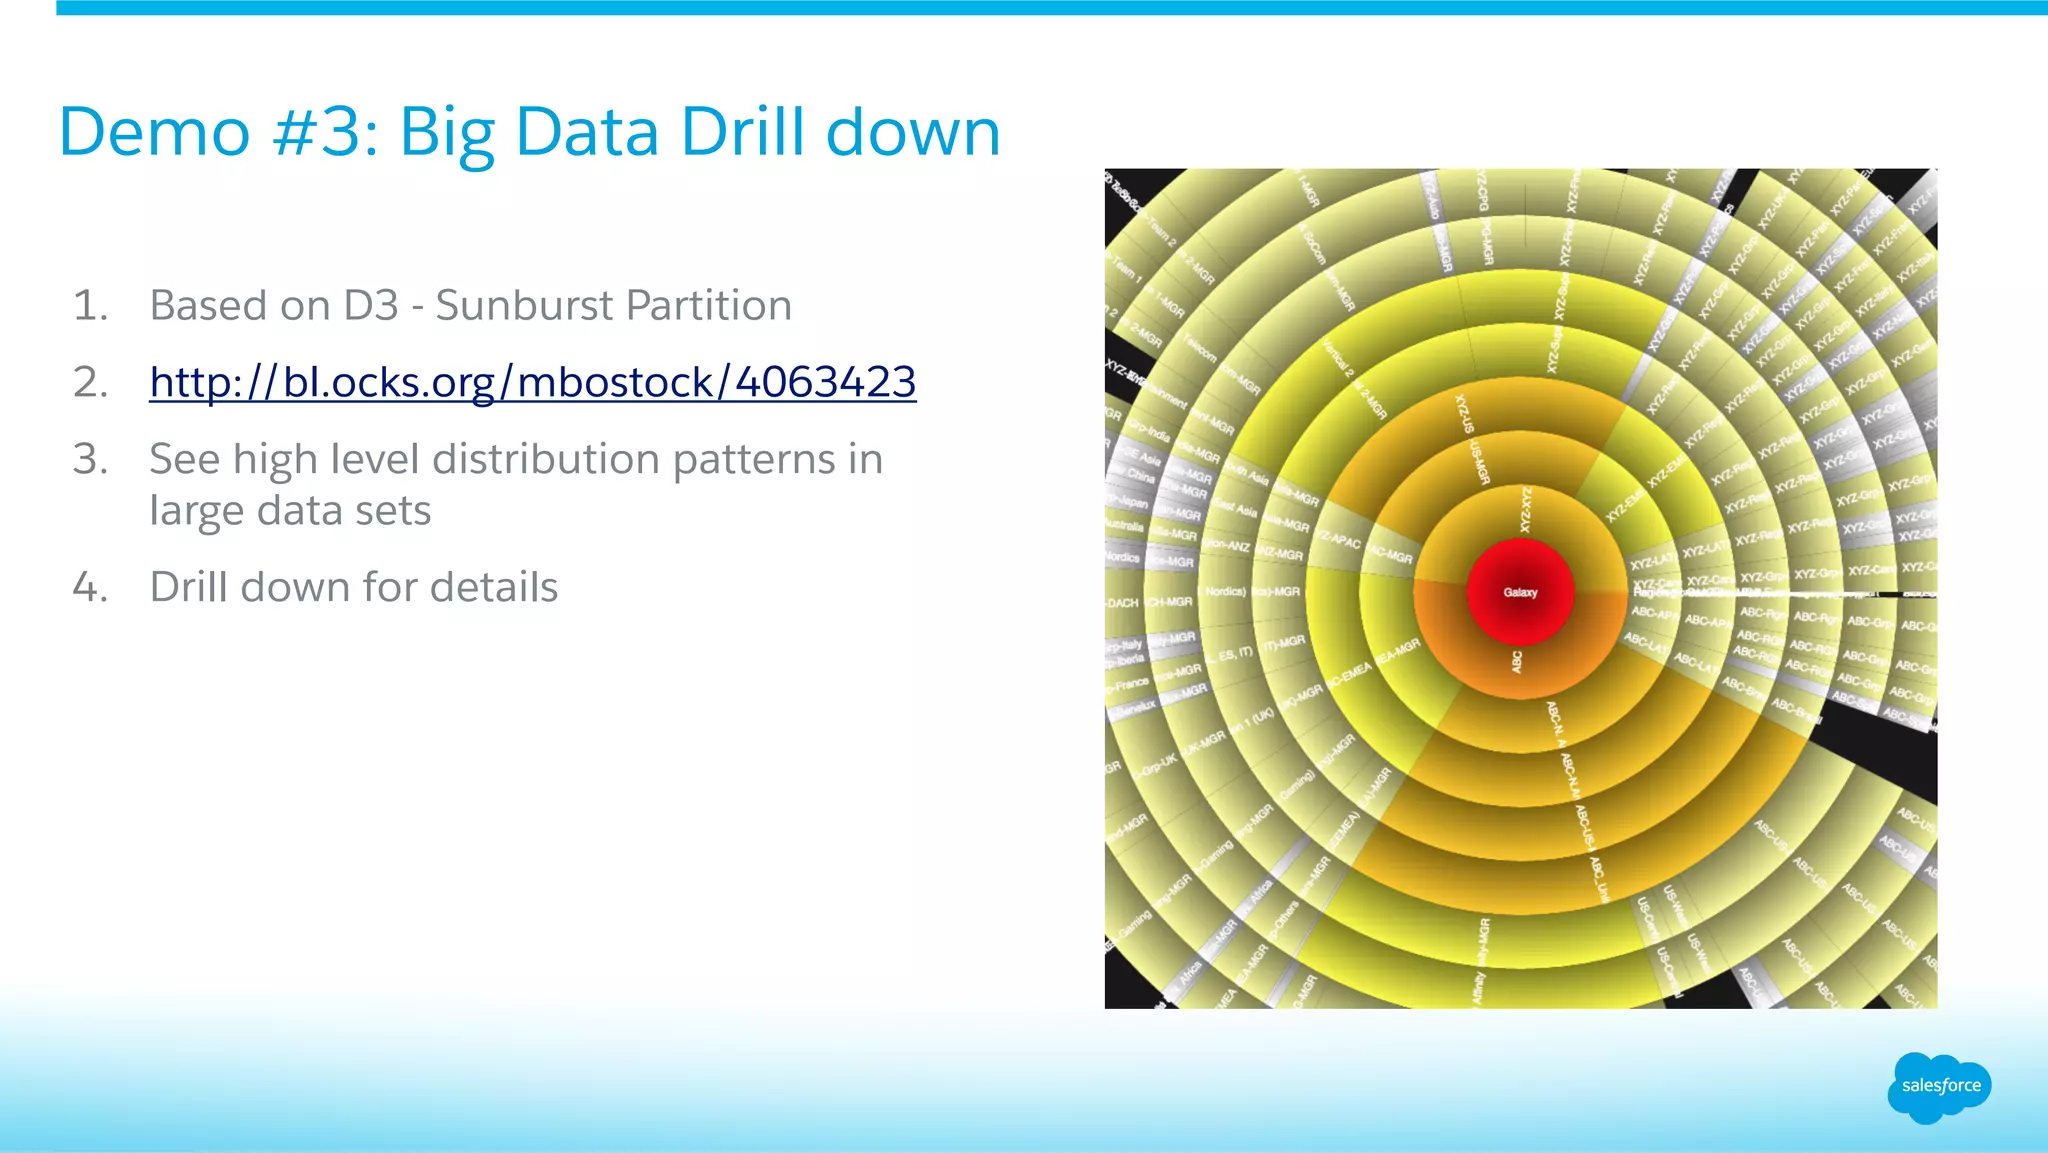
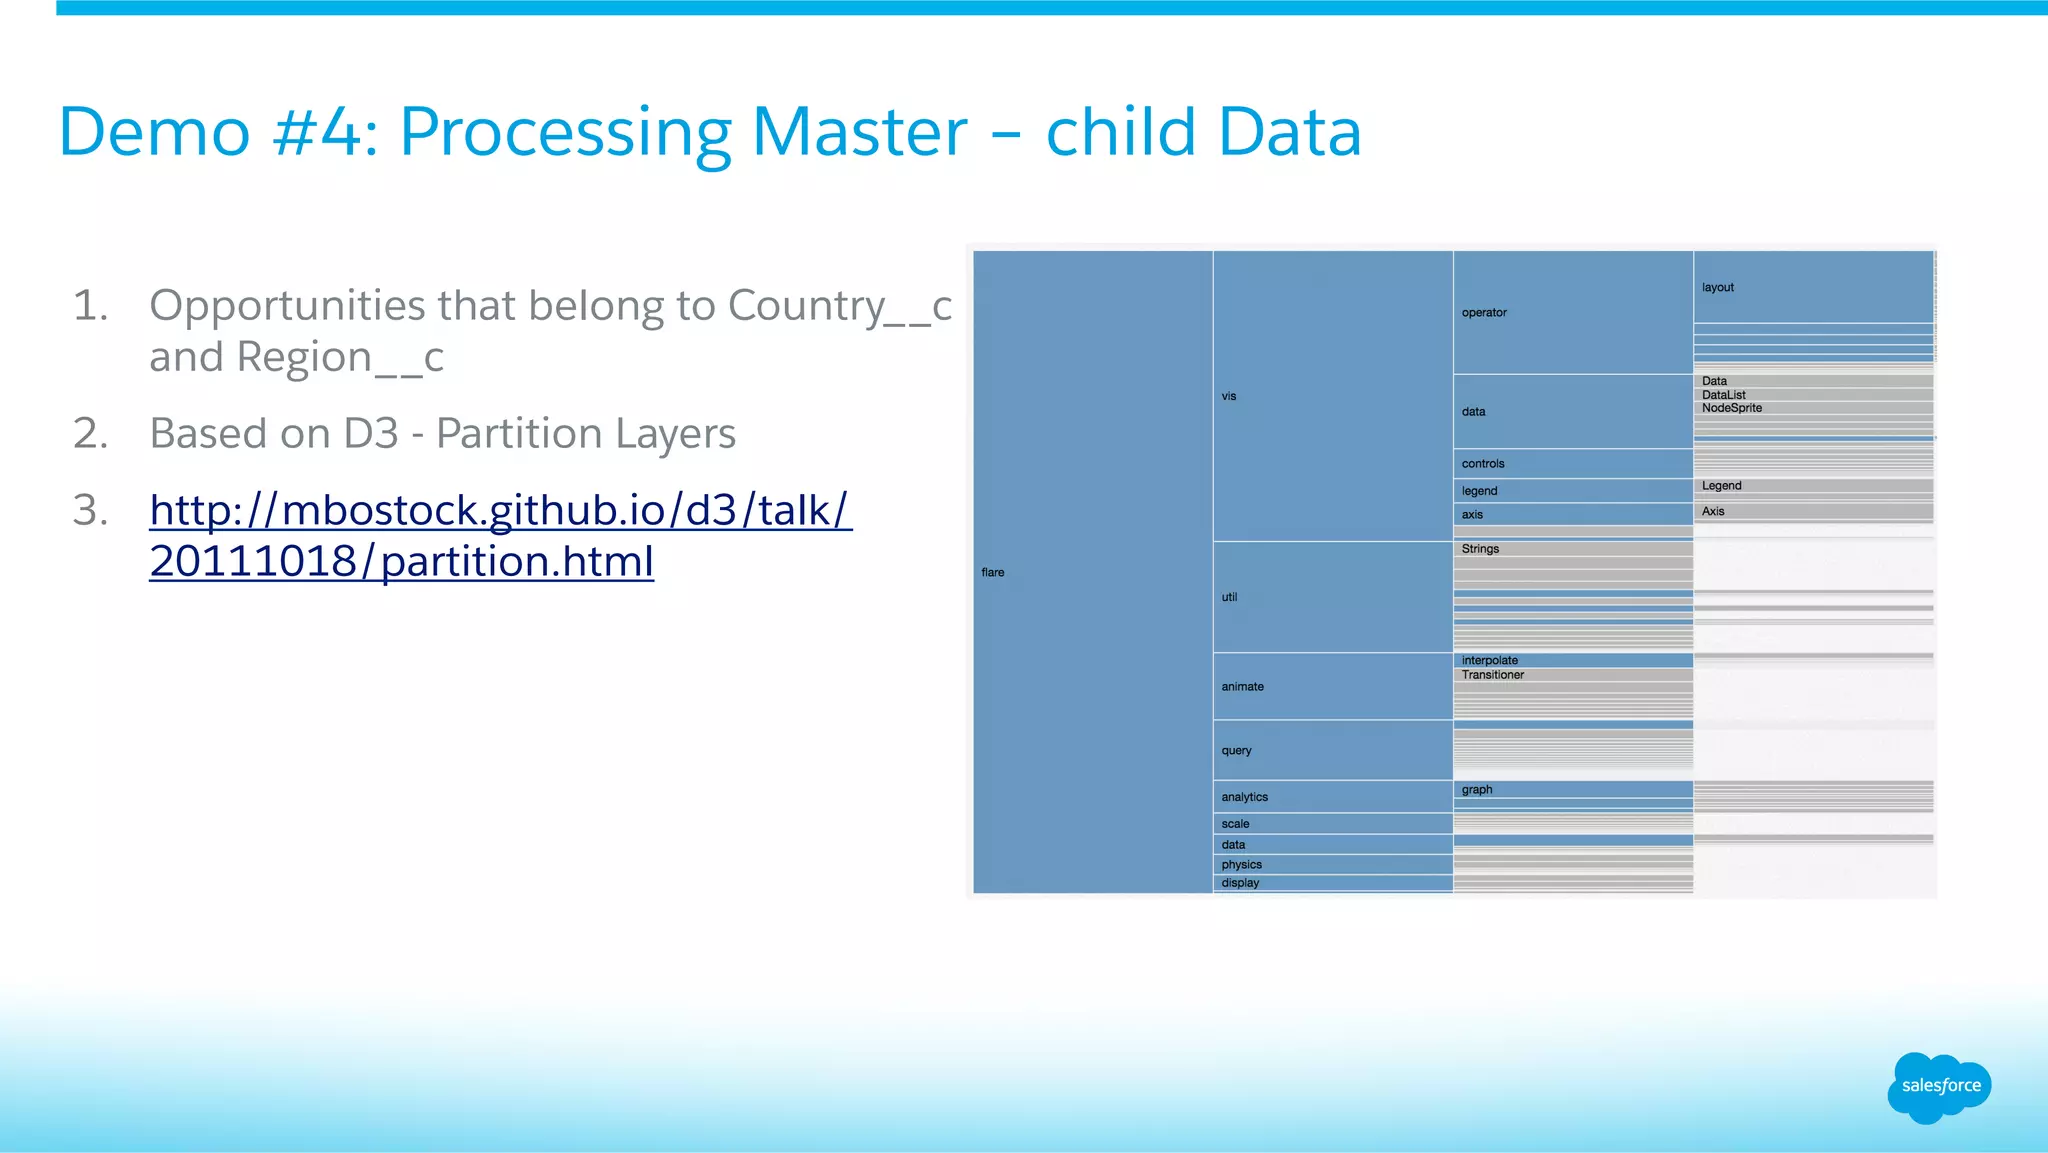
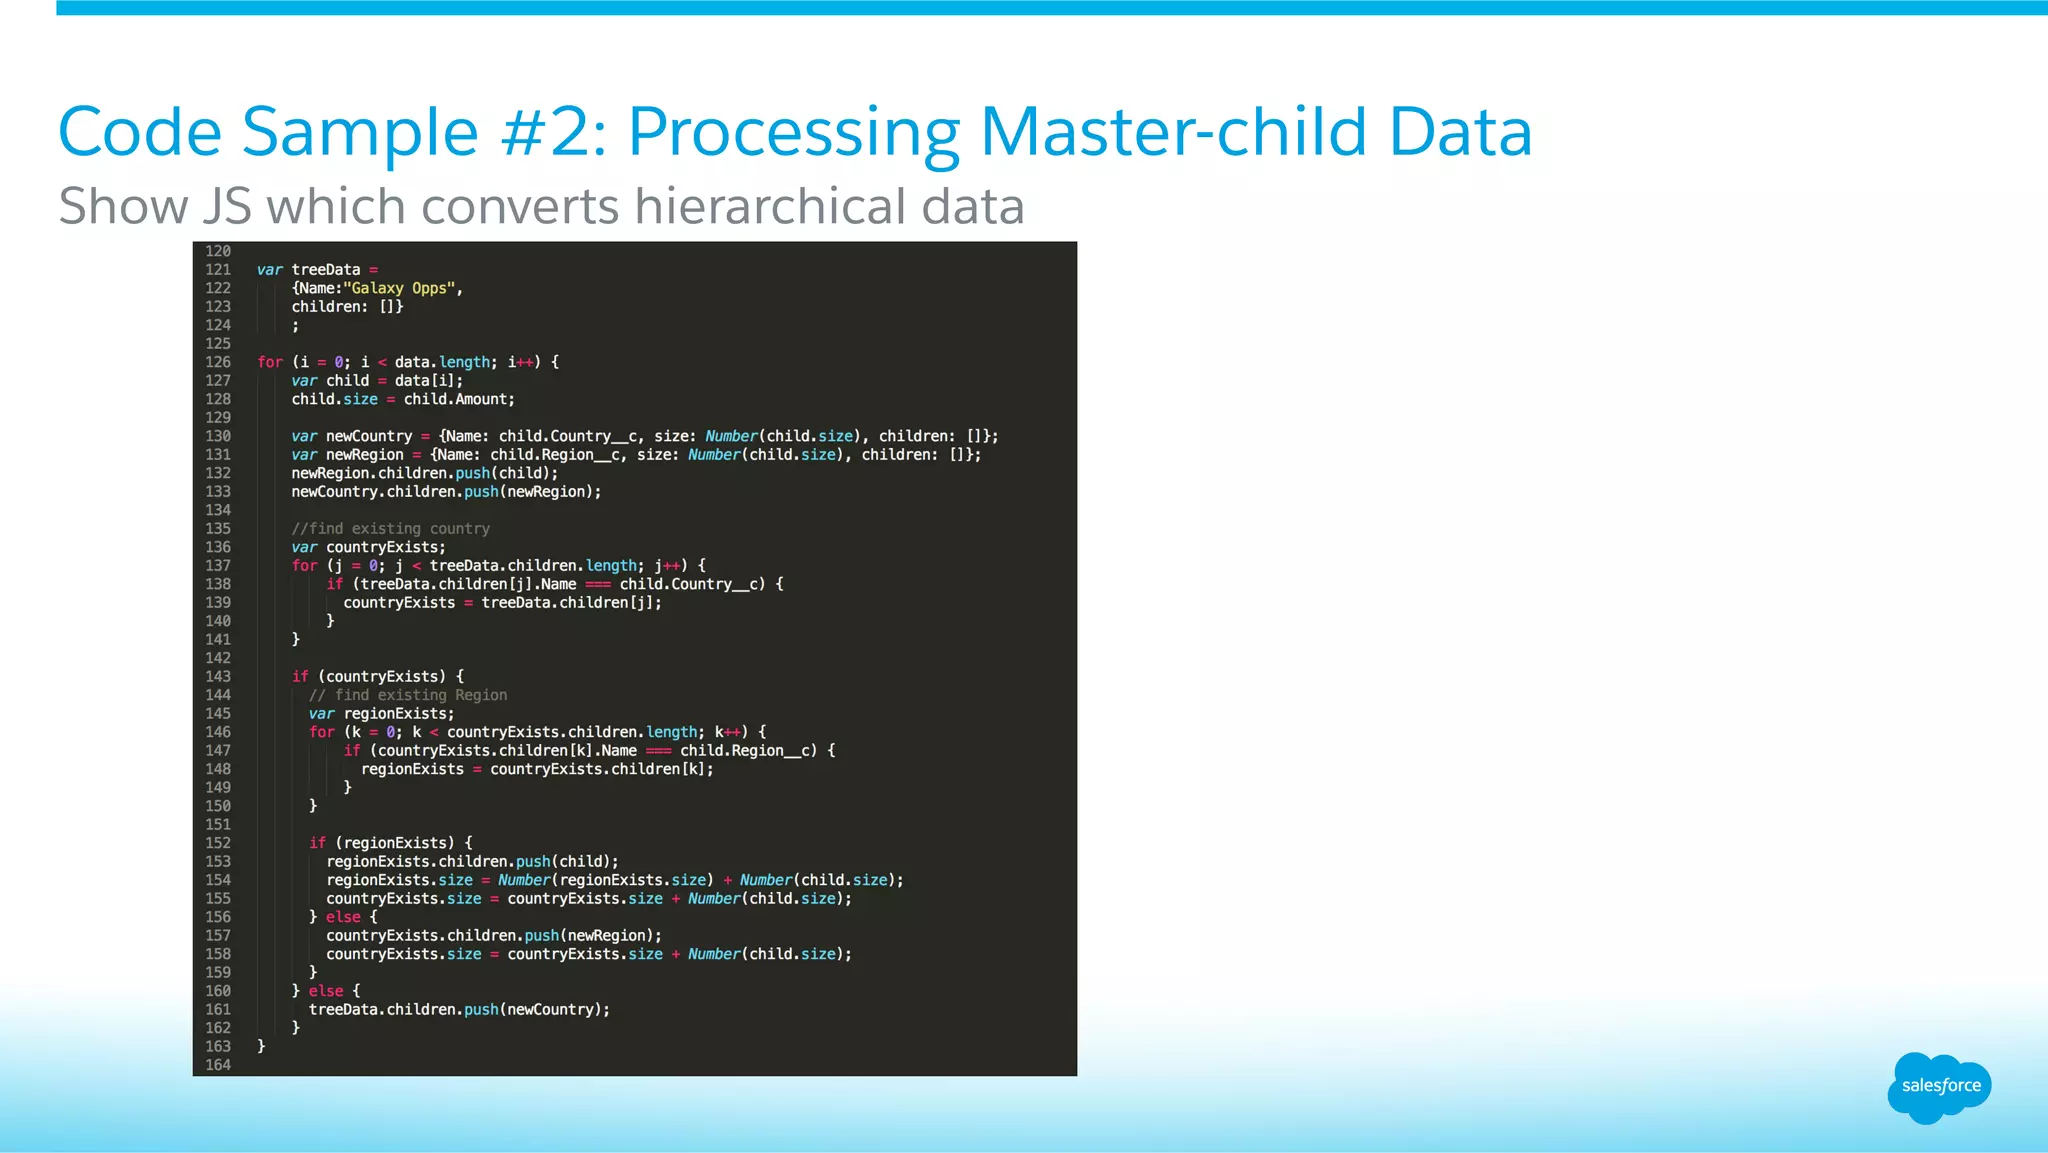
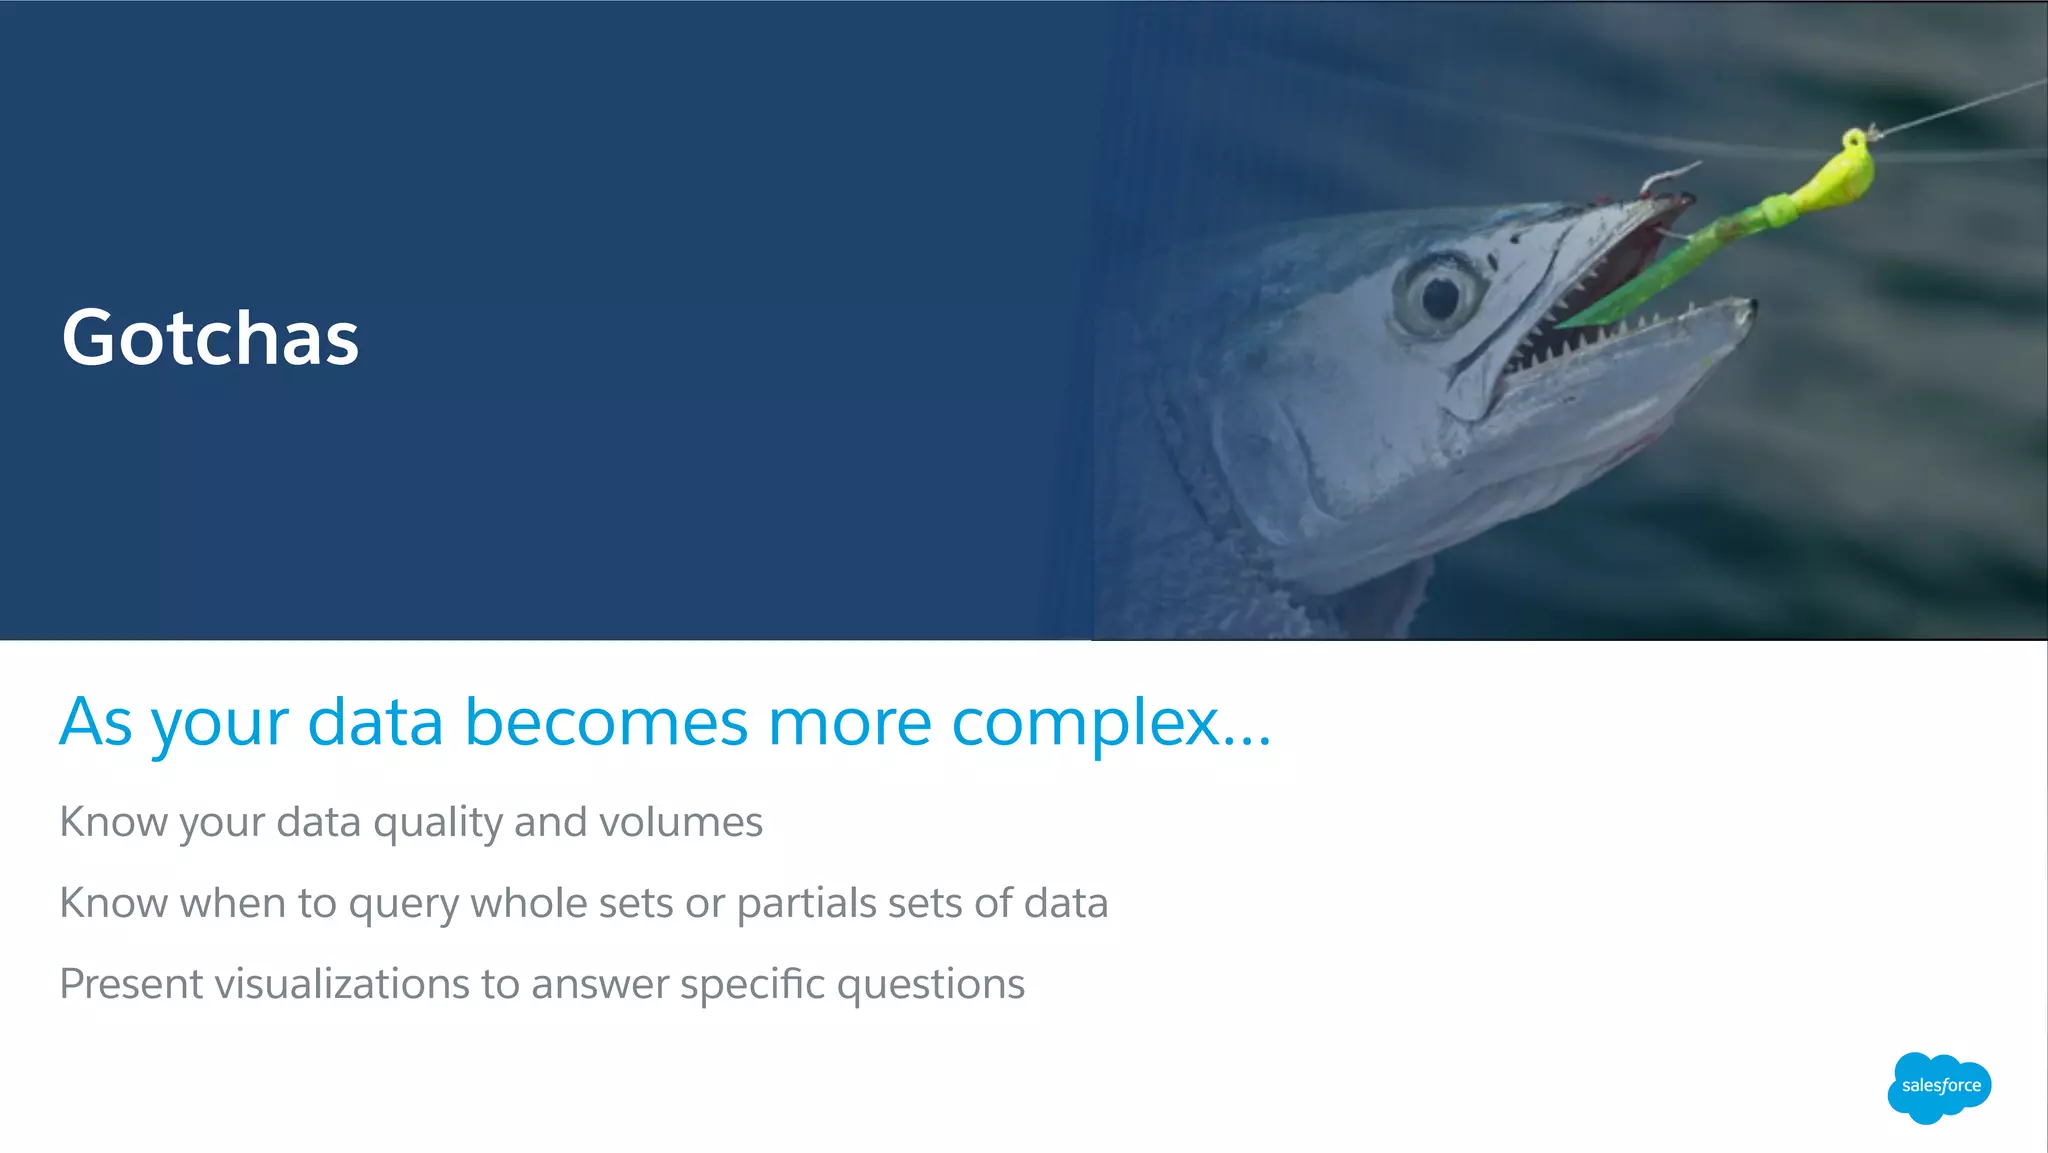
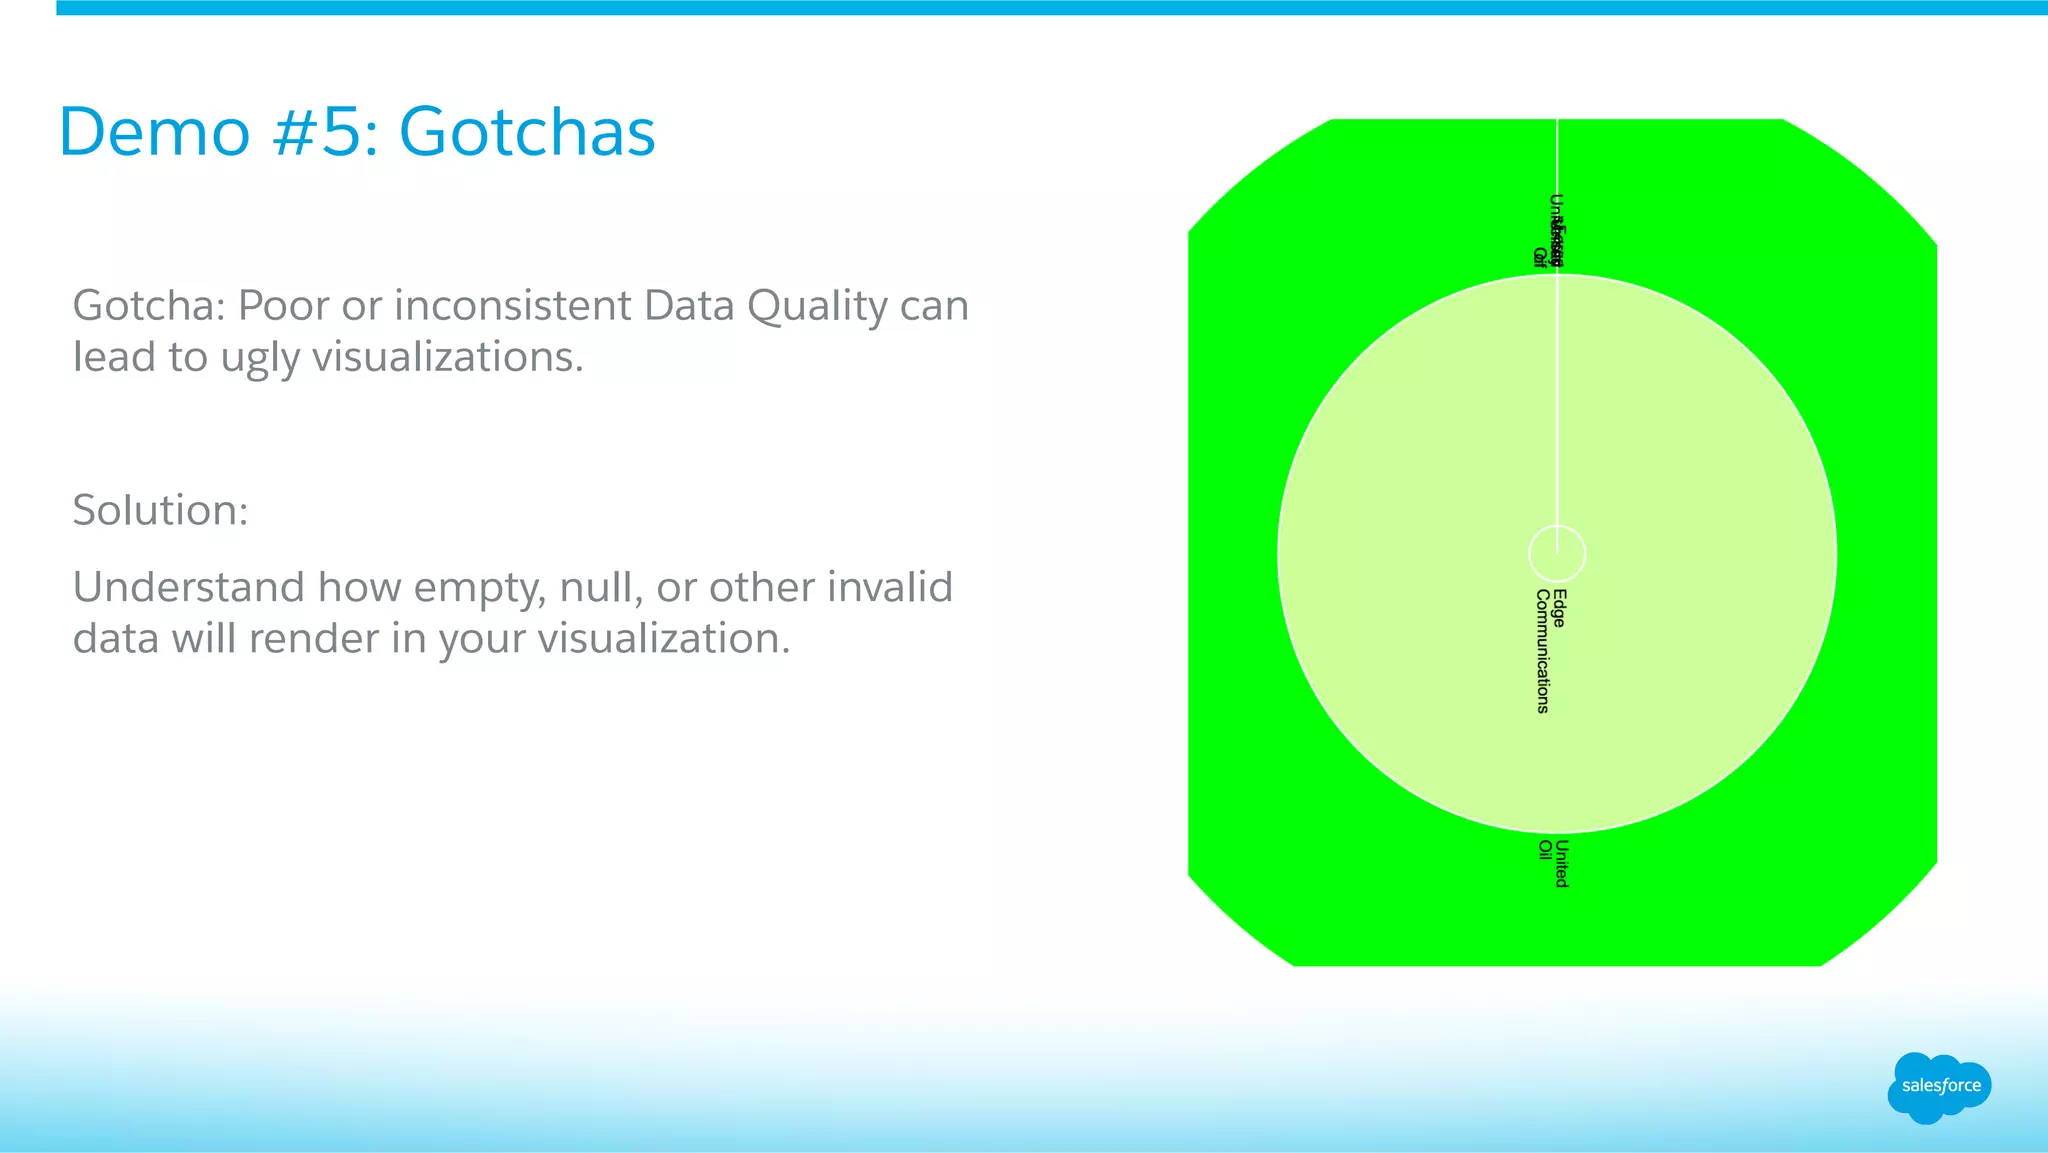
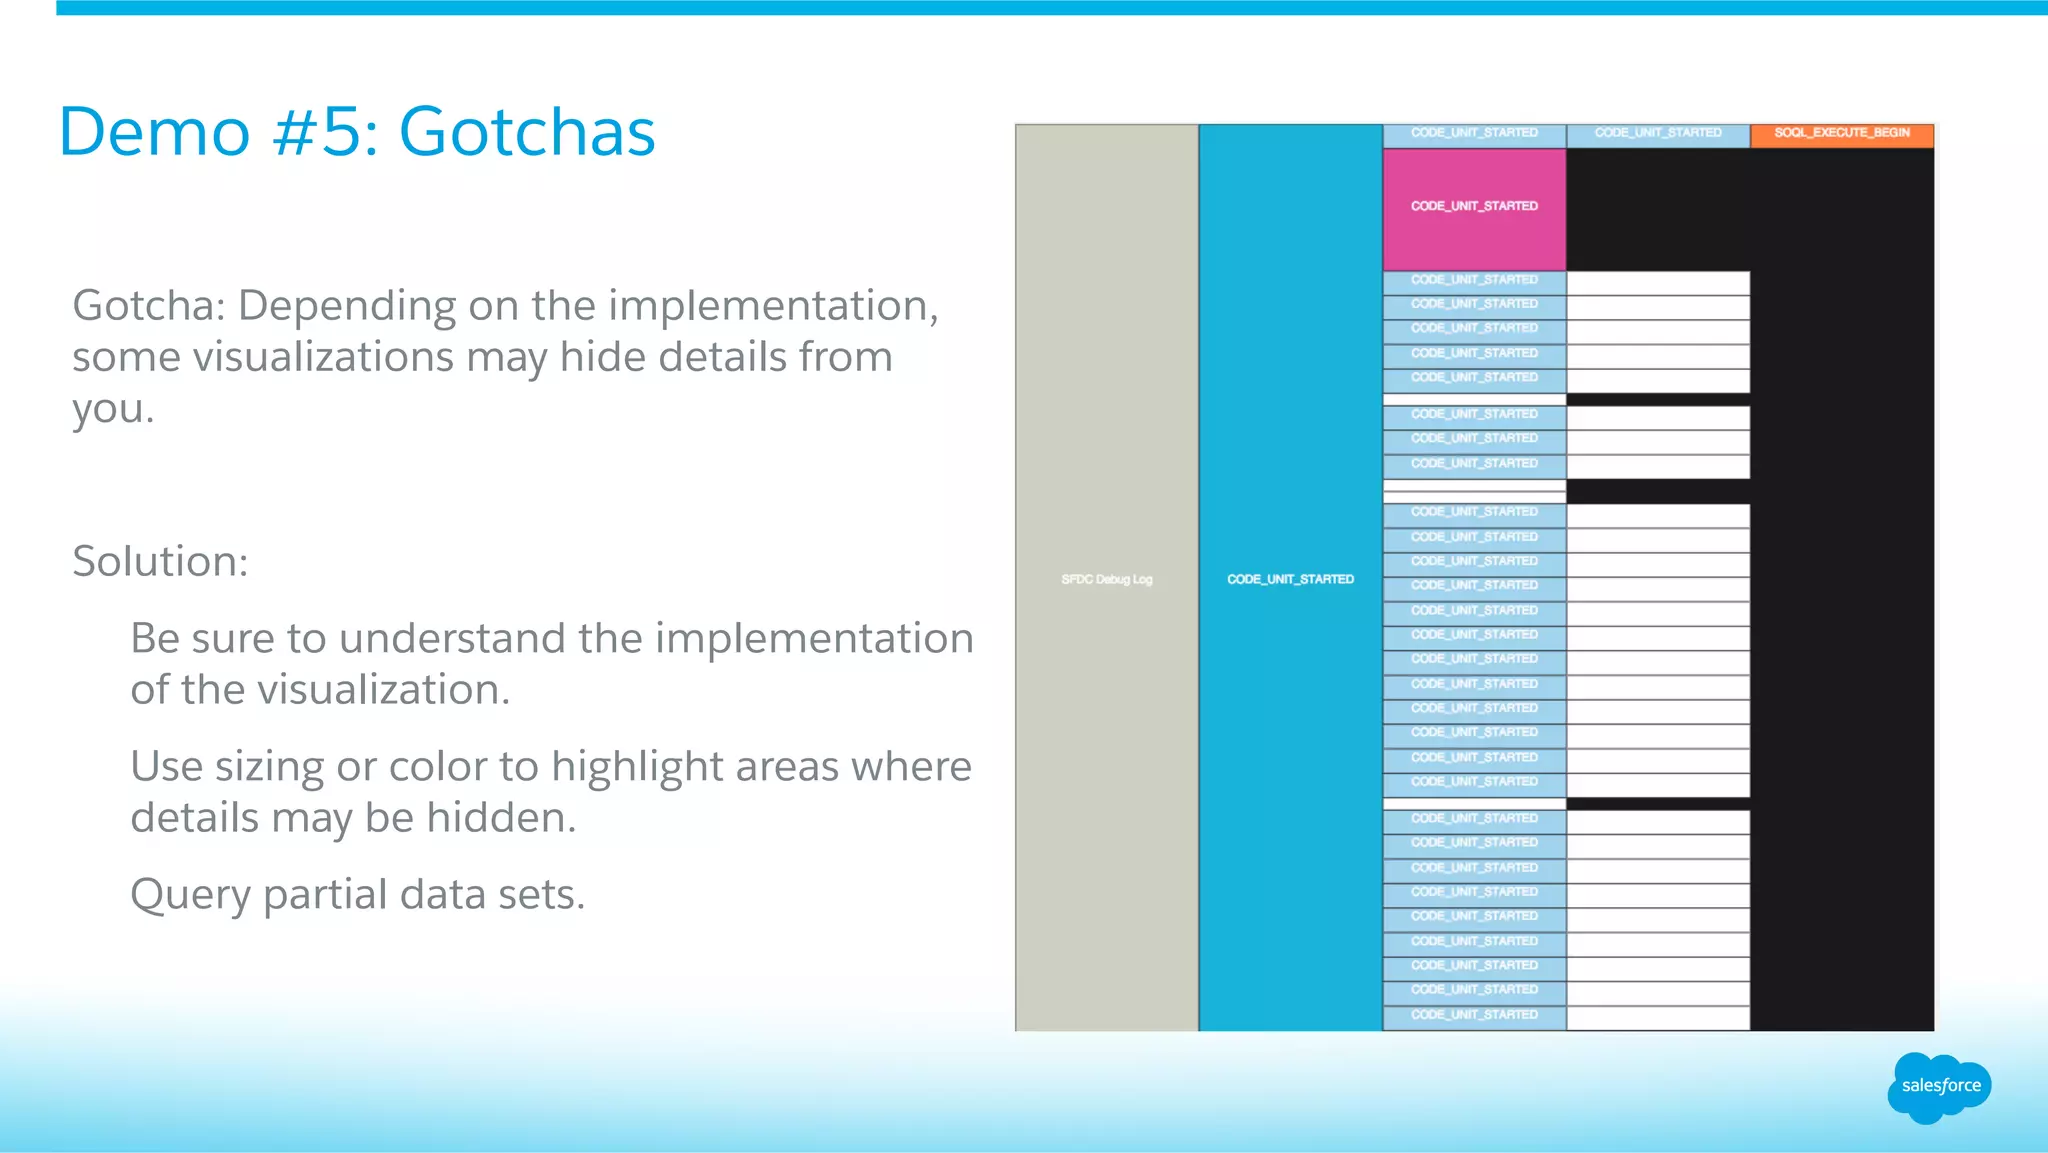
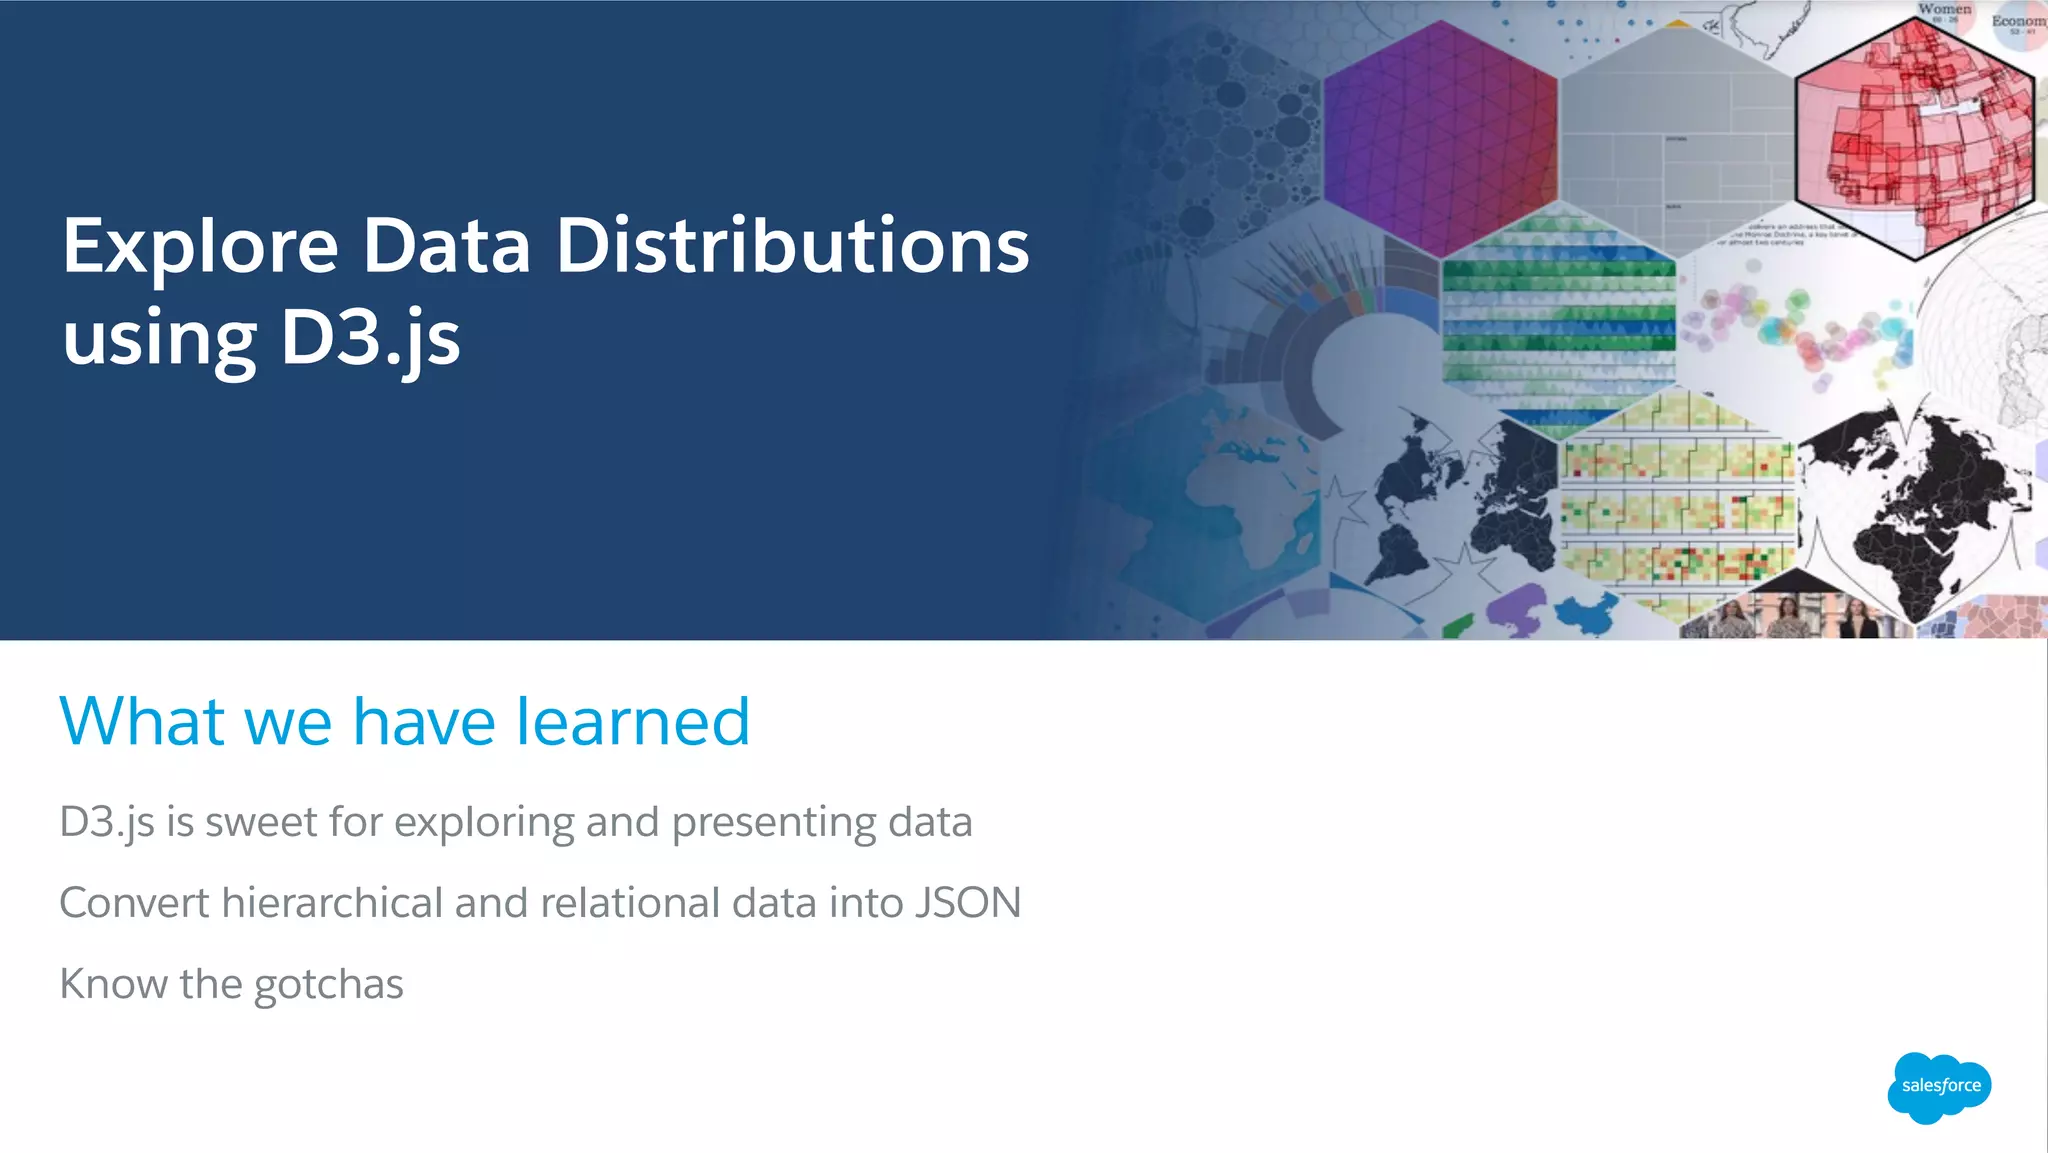
Understanding and presenting data distributions is essential for success in sales, service, and platform performance. As your data becomes more complex, you need more robust tools to explore and present your data. Join us as we level up by using visualization library D3.js to explore and present our data. You will learn to convert the Saleforce relational data into hierarchical JSON, which can then be used directly in several D3.js visualizations.
3. Level up by using visualization library D3.js
Convert the SFDC relational data into hierarchical JSON
Explore and present our data with D3.js visualizations
As your data becomes more complex...
Buddy Valastro, President & CEO, Carlo’s Bakery
presenting data distributions
is essential for success in
sales, service, and platform
performance.
4. What is D3.js
D3.js is a JavaScript library for
manipulating documents
based on data.
http://d3js.org/
5. D3 Concepts
Tree Layout - The tree layout produces tidy
node-link diagrams of trees using the
Reingold–Tilford “tidy” algorithm.
https://github.com/mbostock/d3/wiki/Tree-Layout
6. Demo #1: Custom Account Hierarchy View
1. Account Hierarchies (Account belongs to
a parent Account)
2. Based on D3 – Collapsible Indented Tree
3. http://bl.ocks.org/mbostock/1093025
4. Dynamic color coding to highlight key
metrics.
7. Code Sample #1: Custom Account Hierarchy View
1. Review VF structure
2. Show Soql query and results
(hierarchical)
3. Show JSON output
4. Show JS which converts data
5. Source code available on github
8. Code Sample #1: Custom Account Hierarchy View
Using the Force.com AJAX toolkit...
How do we transform the above relational
results to JSON (over there on the right >>) ?
Show Soql query and results
9. Code Sample #1: Custom Account Hierarchy View
Show JS which converts hierarchical data
10. Demo #2: Account Sunburst
1. Based on D3 - Sunburst Partition
2. http://bl.ocks.org/mbostock/4063423
3. Dynamic sizing and color based on key
metrics.
4. Dynamic levels.
11. Demo #3: Big Data Drill down
1. Based on D3 - Sunburst Partition
2. http://bl.ocks.org/mbostock/4063423
3. See high level distribution patterns in
large data sets
4. Drill down for details
12. Demo #4: Processing Master – child Data
1. Opportunities that belong to Country__c
and Region__c
2. Based on D3 - Partition Layers
3. http://mbostock.github.io/d3/talk/
20111018/partition.html
13. Code Sample #2: Processing Master-child Data
Show JS which converts hierarchical data
14. Know your data quality and volumes
Know when to query whole sets or partials sets of data
Present visualizations to answer specific questions
As your data becomes more complex...
Buddy Valastro, President & CEO, Carlo’s Bakery
Gotchas
15. Demo #5: Gotchas
Gotcha: Poor or inconsistent Data Quality can
lead to ugly visualizations.
Solution:
Understand how empty, null, or other invalid
data will render in your visualization.
16. Demo #5: Gotchas
Gotcha: Depending on the implementation,
some visualizations may hide details from
you.
Solution:
Be sure to understand the implementation
of the visualization.
Use sizing or color to highlight areas where
details may be hidden.
Query partial data sets.
17. D3.js is sweet for exploring and presenting data
Convert hierarchical and relational data into JSON
Know the gotchas
What we have learned
Buddy Valastro, President & CEO, Carlo’s Bakery
Explore Data Distributions
using D3.js