Download free for 30 days
Sign in
Upload
Language (EN)
Support
Business
Mobile
Social Media
Marketing
Technology
Art & Photos
Career
Design
Education
Presentations & Public Speaking
Government & Nonprofit
Healthcare
Internet
Law
Leadership & Management
Automotive
Engineering
Software
Recruiting & HR
Retail
Sales
Services
Science
Small Business & Entrepreneurship
Food
Environment
Economy & Finance
Data & Analytics
Investor Relations
Sports
Spiritual
News & Politics
Travel
Self Improvement
Real Estate
Entertainment & Humor
Health & Medicine
Devices & Hardware
Lifestyle
Change Language
Language
English
Español
Português
Français
Deutsche
Cancel
Save
Submit search
EN
Uploaded by
Paul Geer
DOC, PDF
330 views
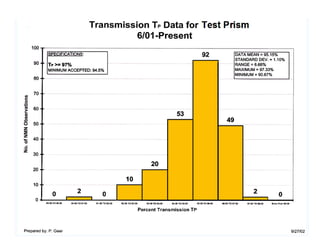
Excel Chart Histogram
Histogram chart prepared for quality control purposes.
Read more
0
Save
Share
Embed
Embed presentation
Download
Download to read offline
1
/ 1
More Related Content
PPTX
Dağılım ölçütleri
by
Tacettin Inandi
PPTX
Gruplanmış verilerde eğilim ve dağılım ölçüleri
by
Gökay Göktaş
PPTX
Merkezi Eğilim ve Dağılım Ölçüleri
by
Gülşah Başol
PDF
Coolant Centrifuge Cleaning Procedure
by
Paul Geer
PPTX
Verilerin Düzenlenmesi Ve Dağılımların Grafiklerle Betimlenmesi
by
Gülşah Başol
PPTX
Uygulamalı İstatistik-SPSS'e Giriş
by
Gülşah Başol
PPTX
Technical Documentation of Quality Control and Work Standards
by
Paul Geer
PDF
Glass Block Handling for Machine Processing
by
Paul Geer
Dağılım ölçütleri
by
Tacettin Inandi
Gruplanmış verilerde eğilim ve dağılım ölçüleri
by
Gökay Göktaş
Merkezi Eğilim ve Dağılım Ölçüleri
by
Gülşah Başol
Coolant Centrifuge Cleaning Procedure
by
Paul Geer
Verilerin Düzenlenmesi Ve Dağılımların Grafiklerle Betimlenmesi
by
Gülşah Başol
Uygulamalı İstatistik-SPSS'e Giriş
by
Gülşah Başol
Technical Documentation of Quality Control and Work Standards
by
Paul Geer
Glass Block Handling for Machine Processing
by
Paul Geer
More from Paul Geer
PPTX
2016 google sketchup samples
by
Paul Geer
DOC
Excel 3D Plot
by
Paul Geer
DOC
2 D Excel Chart Point Plot
by
Paul Geer
DOC
Sample Visio Screen 1
by
Paul Geer
DOC
Flowchart1
by
Paul Geer
DOC
Sample Word Screen
by
Paul Geer
2016 google sketchup samples
by
Paul Geer
Excel 3D Plot
by
Paul Geer
2 D Excel Chart Point Plot
by
Paul Geer
Sample Visio Screen 1
by
Paul Geer
Flowchart1
by
Paul Geer
Sample Word Screen
by
Paul Geer
Download