Download to read offline
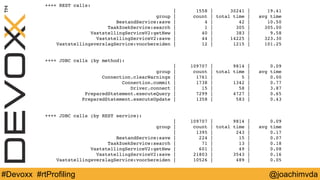
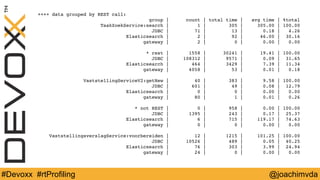
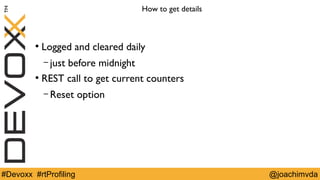
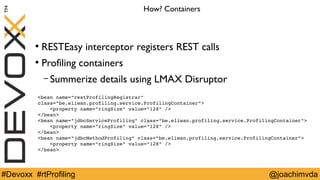
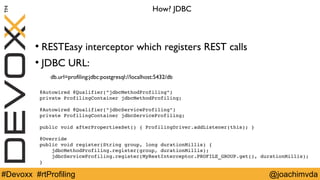
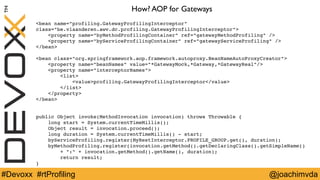
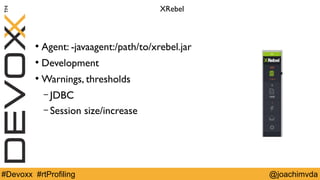
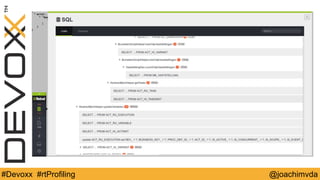
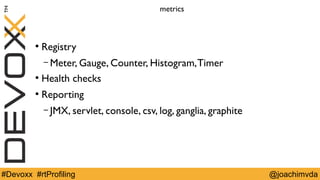
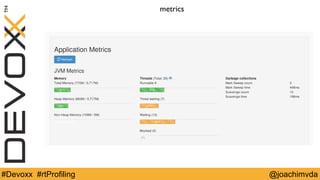
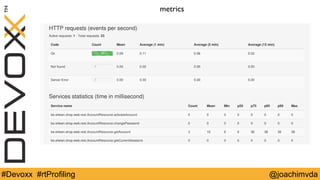
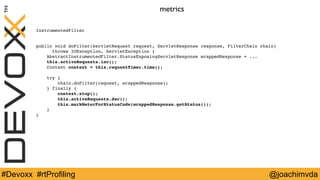

The document discusses simple runtime profiling techniques that provide limited overhead and feedback without additional resources. It describes profiling REST calls and JDBC calls using containers and aggregating data. Alternatives like XRebel and Metrics are also mentioned.