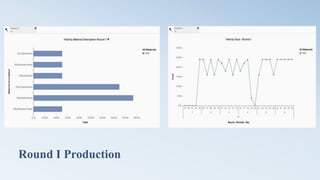
1. The team initially focused on two variants, invested in reducing setup time, and advertised one product per region. In Round 1 they dominated two variants and had a net income of $634,851.
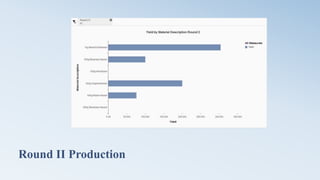
2. In Round 2 they focused on the variant with the least sales in Round 1 and increased production. Their net income increased to $1.9 million.
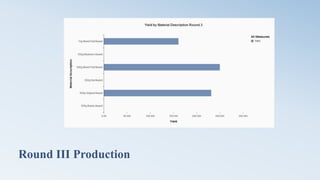
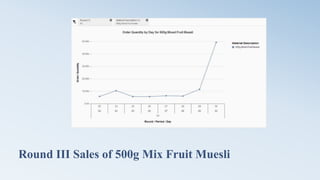
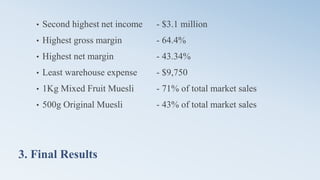
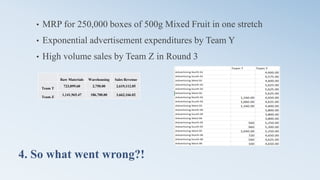
3. In Round 3 they took a risk producing 250,000 boxes of one variant. Increased advertising did not increase sales until later. Their highest net income was $3.13 million, despite issues with one variant and high competition.