1. ERDC/CERLTR-15-24
Integrated Climate Assessment for Army Enterprise Planning
Climate Change Impacts on Water
and Energy for Army Installations
ConstructionEngineering
ResearchLaboratory
James Miller, Juliana Wilhoit, Kristina Tranel, and
Laura Curvey
September 2015
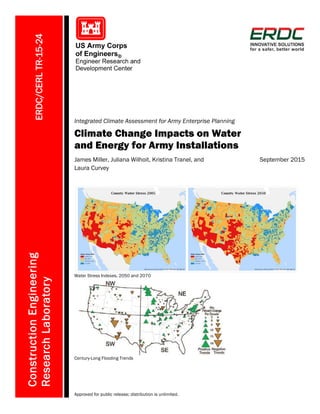
Water Stress Indexes, 2050 and 2070
Century-Long Flooding Trends
Approved for public release; distribution is unlimited.
2. The U.S. Army Engineer Research and Development Center (ERDC) solves
the nation’s toughest engineering and environmental challenges. ERDC develops
innovative solutions in civil and military engineering, geospatial sciences, water
resources, and environmental sciences for the Army, the Department of Defense,
civilian agencies, and our nation’s public good. Find out more at www.erdc.usace.army.mil.
To search for other technical reports published by ERDC, visit the ERDC online library
at http://acwc.sdp.sirsi.net/client/default.
3. Integrated Climate Assessment for Army
Enterprise Planning
ERDC/CERL TR-15-24
September 2015
Climate Change Impacts on Water
and Energy for Army Installations
James Miller, Juliana Wilhoit, Kristina Tranel, and Laura Curvey
U.S. Army Engineer Research and Development Center (ERDC)
Construction Engineering Research Laboratory (CERL)
2902 Newmark Drive
Champaign, IL 61822-1076
Final Report
Approved for public release; distribution is unlimited.
Prepared for Headquarters, U.S. Army Corps of Engineers
Washington, DC 20314-1000
4. ERDC/CERL TR-15-24 ii
Abstract
In the decades to come, climate change is expected to impact the Army’s
costs, its abilities to train and maintain the force, and its mission capabili-
ties. These potential climate change impacts need to be considered in the
Army’s stationing/restationing analysis process to ensure that future deci-
sions concerning locating and relocating Army Forces are optimized to
minimize costs while maintaining the ability to effectively train, maintain
and deploy forces.
The Center for Army Analysis (CAA) is part of the Army Stationing Process
that is responsible for analyzing and recommending possible stationing
scenarios to Army leadership. In the past, environmental considerations
were not well defined and were treated in a qualitative rather than quanti-
tative manner. As a result, CAA recognized a need to focus on environmen-
tal issues, particularly the effects of climate change on future stationing ac-
tions. This study was performed to identify and recommend possible
improvements to the Army’s stationing/restationing analysis process, spe-
cifically, by including climate factors in the stationing analysis process to
enable a more complete modeling and cost analysis.
5. ERDC/CERL TR-15-24 iii
Executive Summary
Background
Over the years, the needs of the U.S. Department of Defense (DoD)
change, often resulting in an excess of facilities and installations that are
no longer wanted or needed. Until the 1960s, DoD enjoyed wide latitude in
disposing of unneeded facilities. This relative freedom ended in the 1970s
when base closures were largely halted. During the 1980s under the
Reagan Administration, the institution of “BRAC 88” temporarily reiniti-
ated the Base Realignment and Closure (BRAC) process to overcome the
political hurdles associated with BRAC impacts on various constituencies.
The ’88 DoD BRAC Commission reported to the Secretary of Defense, who
forwarded the recommendation package to the President for approval/dis-
approval in its entirety. On presidential approval, the package was submit-
ted to Congress for their approval/disapproval in its entirety.
Although BRAC 88 was begun as a one-time action, subsequent BRAC
rounds were conducted in 1991, 1993, 1995, and 2005. No BRAC rounds
have been initiated since 2005. BRAC 2005 differed significantly from
previous BRAC rounds in that:
• It included a stable or increasing force structure (no drawdown).
• It was undertaken in a new threat environment (current ops and post-
9/11 environment).
• It placed a major emphasis on military transformation.
• It established a 20-year Net Present Value (NPV) cost horizon.
• A $21B budget “wedge” was established
• Headquarters and Support Activities Joint Cross-Service Groups (HSA-
JCSGs) were given an independent point of entry into the process.
There was significant overlap between the HSA-JCSGs.
• HSA-JCSG was chartered to merge Business Process Reengineering
with traditional BRAC. HSA-JCSG had no counterpart in previous
BRAC rounds.
• It recognized the need for integration with the military department
(MILDEP) teams.
Such base realignment decisions have very long term consequences; deci-
sions regarding base realignment must consider resources for many years
into the future. The process, based on the last major stationing action
6. ERDC/CERL TR-15-24 iv
(BRAC 2005), is as follows. When DoD considers stationing or restation-
ing of Army Forces, the Army engages the support of the Center for Army
Analysis (CAA) within the HSA-JCSG to consider a number of critical at-
tributes of installations and to perform the required analyses to determine
what gives specific installations military value (MV). CAA interviews Sen-
ior Leaders and consults with subject matter experts (SME) to determine
the MV attributes (MVAs) that will be examined in the MVA analysis pro-
cess (Criteria 1-4 below). Although there is flexibility as to which metrics
are examined, the analysis is bound by congressional mandate to examine
eight criteria:
1. Criterion 1. The current and future mission capabilities and the impact on
operational readiness of the total DoD force, including the impact on joint
warfighting, training, and readiness.
2. Criterion 2. The availability and condition of land, facilities and associ-
ated airspace (including training areas suitable for maneuver by ground,
naval, or air forces throughout a diversity of climate and terrain areas and
staging areas for the use of the Armed Forces in homeland defense mis-
sions) at both existing and potential receiving locations.
3. Criterion 3. The ability to accommodate contingency, mobilization, and
future total force requirements at both existing and potential receiving lo-
cations to support operations and training.
4. Criterion 4. The cost of operations and the manpower implications.
5. Criterion 5. The extent and timing of potential costs and savings, includ-
ing the number of years, beginning with the date of completion of the clo-
sure or realignment, for the savings to exceed the costs as predicted by a
Cost of Base Realignment Actions (COBRA) model.
6. Criterion 6. The economic impact on existing communities in the vicinity
of military installations.
7. Criterion 7. The ability of the infrastructure of both the existing and poten-
tial receiving communities to support forces, missions, and personnel.
8. Criterion 8. The environmental impact, including the impact of costs re-
lated to potential environmental restoration, waste management, and en-
vironmental compliance activities.
7. ERDC/CERL TR-15-24 v
Current Optimal Stationing of Army Forces/Military Value Analysis
(OSAF/MVA) process
Based on its experiences in a series of BRAC actions from 1988 to 2005
and other Army stationing activities, CAA developed an analytical process
to optimize its stationing decisions based on costs and military value. CAA
is constantly updating its process and running stationing models.
The BRAC analysis was composed of four subprocesses:
1. MVA modeling
2. Evaluation of the Optimal Stationing of Army Forces (OSAF)
3. Evaluation of the COBRA
4. Formulation of final Courses of Action (COAs) and/or recommendations.
Currently only MVA is modeling is used. However CAA plans to use these
four parts in the future (Figure ES-1). This iterative process builds on MVA
models as follows:
1. Capacity analysis provides a measure of an installation’s available assets
(supply) and the installation’s capability to meet a unit’s requirements (de-
mand) in terms of measured assets.
2. Then MVA is a primary consideration in making closure and realignment
recommendations
3. Installation Priority is a step in which the analyst considers BRAC Objec-
tives, input data, capacity analysis results, and Military Value of Installa-
tions results to determine a starting point for installation analysis. The
starting point represents the subset of installations where the analyst will
first attempt to conduct BRAC actions.
4. Unit scenario development: installation analysis results start the “unit
level” analysis. Each unit on an installation with lower MV is considered
for stationing on an installation with higher MV and at locations where the
Army can take advantage of excess capacity.
5. The “unit priority” step then establishes the possible installation-unit com-
binations when restationing units.
6. Cost analysis (COBRA) and other factors (environmental, economic im-
pact on local communities, etc.) are then considered when recommending
stationing actions.
7. Based on all these steps, multiple review boards approve, change, or disap-
prove recommended stationing actions.
8. ERDC/CERL TR-15-24 vi
Figure ES-1. Current CAA stationing decision analysis process.
MVA modeling
MVA is a process of determining the Military Value of Installations based
on a set number of attributes—quantifiable characteristics used in the
MVA that relate to DoD selection criteria. Attributes represent the military
value of an installation. Within the MVA, the attributes are weighted based
on their operational importance and ease of change relative to each other.
Each attribute has a specific weight, expressed as a percentage (i.e., value
within the range of 0 to 1) and is calculated based on basis points that
range from 0 to 100.
For example, recent stationing actions have included such attributes as
maneuver land availability, housing, and water quantity. The maneuver
land attribute is considered to be of high operational importance, and one
that is difficult to change since additional maneuver land is not easily ac-
quired. Consequently, the maneuver land attribute is weighted more heav-
ily than an attribute such as quality of life facilities, which is more easily
changed since it can be improved by investment. Installations receive a
value for each attribute based on collected data. Individual attribute scores
are then weighted and summed to produce the installations’ overall mili-
tary value scores (GAO 2013). Figure ES-2 shows the weights assigned to
attributes in a small-scale CAA stationing effort in 2013.
9. ERDC/CERL TR-15-24 vii
Figure ES-2. CAA MVA model weighting matrix (2013).
Evaluation of OSAF
OSAF was the only BRAC model that moves unit level elements that opti-
mally takes cost into account. OSAF prescribes an optimal Army stationing
solution that accounts for each unit’s existing starting location, available
implementation dollars, and requirements for facilities, ranges, and ma-
neuver land and then determines where each unit should move (realign), if
the unit moves, and closes installations that no longer have units.
Evaluation of COBRA
Scenarios produced by OSAF are run through the COBRA model. COBRA
is a cost comparison tool used to compare stationing scenarios in terms of
their 20-year NPV and payback period. COBRA allows the analyst to enter
both recurring and one-time costs, such as environmental and waste man-
agement costs, for a given scenario. These values are derived from Base
Operation Support (BOS) costs, which are included in the Installation Sta-
tus Report (ISR).
10. ERDC/CERL TR-15-24 viii
Formulation of COAs and/or recommendations
The MVA models result in installation rankings and scores that provide in-
put to the OSAF model using the iterative process outlined above (p v). Ul-
timately, this process yields final COAs and recommendations.
Opportunities for process improvement
Consideration of a longer NPV horizon
The U.S. Army operates in an environment undergoing constant change.
Budgets, political considerations, international threats, technological de-
velopments, and numerous other concerns require the Army to be in a
constant state of planning and preparing for future needs. Inevitably, a
major question faced by Army planners deals with optimizing the station-
ing of Army Forces for purposes of training, maintaining, and when neces-
sary, deployment. Army stationing is a very complex issue that rarely has
an obvious solution. Decisions to station forces in one location versus an-
other have a myriad of impacts, many of which can have effects for many
decades into the future. As a result, careful analysis must identify and
weigh all significant factors and impacts of Army stationing decisions.
BRAC 2005 required consideration of a 20-year NPV analysis. Since Army
stationing decisions have very long term implications not only for the
Army, but also for gaining and losing communities, and since the possible
effects of climate change may not be fully realized for decades, a 20-year
NPV analysis may no longer be adequate. A longer NPV analysis (perhaps
40 to 50 years) may be more appropriate.
Consideration of climate change impacts
Climate change can be expected to affect Army installations in at least two
critical areas: water and energy. Since stationing decisions have very long
term implications and impacts, it is necessary to consider possible future
effects of climate change on Army installations. In the course of conduct-
ing a stationing analysis, it may become necessary to better distinguish be-
tween two or more installations that have very similar MVA scores based
on Criteria 1 through 4. In making such distinctions, CAA must consider
not only the abilities of existing and potential receiving communities to
support forces, missions, and personnel (Criterion 7), but also the environ-
11. ERDC/CERL TR-15-24 ix
mental impact of a stationing decision, including the impact of costs re-
lated to potential environmental restoration, waste management, and en-
vironmental compliance activities (Criterion 8).
Include environmental analysis in the stationing analysis process
While the current process is useful, CAA has expressed the belief that the
process may benefit from further development and improvement. In par-
ticular, in its review of the 2005 BRAC, the Government Accountability Of-
fice (GAO) highlighted that DoD’s environmental analysis was incomplete.
Specifically, GAO said that DoD should have given better consideration to
environmental restoration of bases undergoing closure or realignment
(GAO 2005, p 45). To overcome such deficiencies in future analyses, exist-
ing attributes may need to consider additional metrics. If so, there is a
need to identify those metrics, to identify and locate the data available to
evaluate them, and to devise a method to calculate them. A broader con-
cern is whether there is a need to consider additional relevant attributes
not yet included in the current process. Again, if that is the case, then there
is a need to identify those attributes, to identify and locate the data availa-
ble to evaluate them, and to devise a method to calculate them.
Although its stationing decision analysis process has worked well in the
past, CAA has expressed the desire to improve the process for use in future
stationing analyses. Since climate change can be expected to have an im-
pact on the Army’s costs and ability to fulfill its missions, it is in the
Army’s interest to include an environmental analysis in stationing deci-
sions to enable the Army to better predict and respond to the effects of the
changing climate. Army installation realignment may be affected by cli-
mate change, or it may further exacerbate problems resulting from climate
change in a particular area. Stationing analyses that consider climate fore-
casting can recognize future uncertainties while also striving to best pre-
pare for the consequences of climate change. The inclusion of climate fac-
tors in the stationing analysis process will enable a more complete
modeling and cost analysis. To assist CAA in its effort to improve the sta-
tioning analysis process, this work aimed to:
• gather and manage a new dataset for use in other efforts
• consider possible additional attributes for the MVA model
• develop environment-related constraints for the OSAF model
• assist in specific scenario-related development
• contribute to analysis of environmental impact (Criterion 8).
12. ERDC/CERL TR-15-24 x
Objectives
The objective of this work was to assist CAA in evaluating the current
Army stationing analysis process and in responding to the critiques on the
process brought forward by the GAO by focusing on the possible ramifica-
tions from Global Climate Change (GCC) on the stationing decision analy-
sis process, specifically with respect to Criteria 7 and 8.
Approach
The project team studied the CAA stationing analysis process to gain a
working understanding of the existing system. Team members sought to
increase the depth of environmental (and, in particular, climate change-re-
lated) analysis in the existing MVA attributes so that an improved environ-
mental analysis could be used in general stationing. Where it appeared
that climate change might affect existing attributes, the team sought possi-
ble metrics to improve the MVA attributes. The team then sought data
sources that could be applied Army-wide. When such data were available,
the team developed methods for calculation of those metrics.
This project team focused on attributes and metrics associated with cli-
mate change impacts on water and energy at Army installations and facili-
ties. In parallel efforts, other project teams considered how climate change
might impact installations’ abilities to deploy forces and to conduct firing
and maneuver training on Army training ranges.
The first step of this approach was gain a familiarity with the CAA station-
ing decision analysis process. The next step was to consider the projected
impacts of climate change and how they might be expected to affect Army
installations. This included an investigation of existing MVA attributes
that appeared to be subject to possible climate change effects. Also consid-
ered were any new MVA attributes that might merit further consideration
and development. In considering any candidate MVA attributes, every at-
tempt was made to keep the “SMART” approach in mind such that any
proposed attributes should be:
• Specific – clear and focused to avoid misinterpretation; assumptions
and definitions should be easily interpreted or explained.
• Measurable – can be quantified and compared to other data; should
allow for meaningful statistical analysis (avoid binary “yes/no”
measures – those become “screening” criteria).
13. ERDC/CERL TR-15-24 xi
• Attainable – achievable, reasonable, and credible under conditions
expected.
• Realistic – fits into the models and is cost-effective.
• Timely – achievable within the time frame given.
After identifying relevant MVA attributes, metrics were then identified that
could be used to quantitatively score installations against each other. Met-
rics imply the need for data, so existing data sources that could be used in
calculating metrics were investigated. To be useful, data need to be reliable,
credible, maintainable, and commonly available for all Army installations.
For all metrics for which suitable data were available, methods for calcula-
tion of scores for each metric were developed and documented.
Subsequent chapters of this report briefly address proposed augmented
MVA attributes, their associated metrics, available data and calculation
methods. More detailed discussions are provided in the appendices.
Scope
Seven case study installations that span the continental United States and
are located in a variety of climate zones were selected to provide means to
test the impact of climate change on the U.S. Army (Table ES-1 and Figure
ES-3). All methods used in this study are scalable and can be used to as-
sess all Army installations located within the United States.
Table ES-1. Summary of climate zone and installations
Installation State ASHRAE Climate Zone
Fort Lewis WA Mixed-Marine
Fort Bliss TX Warm-Dry
Fort Riley KS Mixed-Moist
Fort Drum NY Cold-Moist
Fort Bragg NC Warm-Moist
Fort Wainwright AK Subarctic
Schofield Barracks HI Very Hot
14. ERDC/CERL TR-15-24 xii
Figure ES-3. Spatial distribution of the case study sites in relation to their climate zones.
Project team
This project was managed and conducted by a team of ERDC-CERL re-
searchers having a variety of backgrounds and experience in community
planning, environmental and ecological considerations and installation
support.
Results and recommendations
With respect to water and energy support to Army installations, it is antici-
pated that major climate change impacts will manifest as possible temper-
ature and precipitation changes that will have secondary effects related to
water, including:
• rising sea levels
• increased snow melt and inability of snow and ice packs to be replen-
ished
• increased frequency and severity of droughts in some locations simul-
taneous with increased precipitation in other areas
• increased frequency and severity of storm events
• decreased aquifer and surface reservoir levels
• increased risk of flooding, with associated damage to infrastructure
and the environment
• increased risk of wildfires, impacting training lands, utility right-of-
ways, etc.
15. ERDC/CERL TR-15-24 xiii
It is proposed that three existing MVA attributes be augmented and re-
stored to the stationing decision analysis process:
1. Water Quantity. It is proposed that the Water Quantity MVA attribute be
updated to include two new variables, Water Consumption Stress and
Water Quality:
a. A Water Consumption Stress measure is suggested as a new metric. An
index of current water stress, adapted from Roy et al. (2012), was used
to identify the regional water stress of Continental United States
(CONUS) installations. This analysis identifies areas of existing water
stress that demonstrate areas where an installation may compete with
the surrounding region for water.
b. Water Quality measures the amount of water on and surrounding an
installation that is considered polluted (impaired) under Section
303(d) of the Clean Water Act (CWA). The proposed updated Water
Quality MVA attribute includes impaired waterways as an indicator of
degraded water quality.
2. Environmental Elasticity. It is proposed to update the Environmental
Elasticity MVA attribute to include two new factors, Renewable Energy
and Infrastructure Vulnerability:
a. Renewable Energy measures the ability of an installation to produce
renewable energy. DoD is bound by Federal mandate to reduce energy
consumption, of which renewable energy is an important part.
b. Infrastructure Vulnerability measures the vulnerability of installations
to energy infrastructure destruction through climate-related events
such as wildfires, hurricanes, sea level rise, and flooding.
3. Sea Level Rise. It is proposed that the following attributes be updated to
include the possible impact of Sea Level Rise
a. Test Range Capacity MVA attribute: The Test Range Capacity MVA
attribute is the “combination of total square miles and the cubic air-
space of test range facilities at an installation that can support test and
evaluation” (CAA 2004c). It is proposed that the land that is expected
to be inundated with sea water from test range capacity be excluded
from the Test Range Capacity MVA attribute.
b. Buildable Acres MVA attribute: The Buildable Acres MVA attribute as-
sesses the ability of an installation to gain additional force capacity by
expanding the facilities on site. It is proposed that the land that is ex-
pected to be inundated with sea water from the amount of buildable
acres be excluded from the Buildable Acres MVA attribute.
16. ERDC/CERL TR-15-24 xiv
Contents
Abstract .......................................................................................................................................................... ii
Executive Summary..................................................................................................................................... iii
Illustrations ................................................................................................................................................ xvii
Preface......................................................................................................................................................... xix
1 Introduction............................................................................................................................................1
1.1 Background..................................................................................................................... 1
1.1.1 Current Optimal Stationing of Army Forces/Military Value Analysis (OSAF/MVA)
process ..................................................................................................................................... 3
1.1.2 Opportunities for process improvement ................................................................................. 5
1.2 Objectives........................................................................................................................ 7
1.3 Approach ......................................................................................................................... 7
1.4 Scope............................................................................................................................... 9
1.5 Mode of technology transfer .......................................................................................... 9
2 Climate Change Impacts – General................................................................................................10
2.1 Impact of climate change on water .............................................................................10
2.1.1 Changed water cycle..............................................................................................................10
2.1.2 Changed precipitation patterns.............................................................................................11
2.1.3 Loss of snowpack...................................................................................................................12
2.1.4 Localized water shortages.....................................................................................................14
2.1.5 Sea level rise .......................................................................................................................... 16
2.2 Impact of climate change on energy ........................................................................... 17
2.2.1 Increasing air and water temperatures ................................................................................17
2.2.2 Decreased water availability..................................................................................................18
2.2.3 Increasing intensity and frequency of storm events, flooding, and SLR.............................18
3 Climate Change Impacts on the Army............................................................................................19
3.1 Army energy and water strategies................................................................................19
3.1.1 Army energy strategy .............................................................................................................19
3.1.2 Army water strategy ...............................................................................................................19
3.2 Reduced ability to respond...........................................................................................20
3.3 Reduced capacity .........................................................................................................22
3.4 Reduced availability of training lands..........................................................................24
3.5 Reduced energy security..............................................................................................25
Damaged infrastructure due to SLR, storm surge, and flooding.........................................26
3.5.1 Limitations and assumptions of SLR and storm surge analysis .........................................27
3.5.2 Community infrastructure assumptions ...............................................................................29
3.5.3 Results: Lost land from storm events ...................................................................................32
3.5.4 Reproducibility of results: Sea Level Rise.............................................................................33
17. ERDC/CERL TR-15-24 xv
4 Climate Change Impacts on COBRA Costs ...................................................................................34
4.1 Overview of COBRA.......................................................................................................34
4.2 The effect of climate change on costs.........................................................................34
4.3 Methodology for water cost analysis ...........................................................................35
4.3.1 Water costs limitations and assumptions.............................................................................35
4.3.2 Water costs............................................................................................................................. 36
5 MVA Attribute: Water Quantity.........................................................................................................38
5.1 Background...................................................................................................................38
5.2 Water resources............................................................................................................38
5.2.1 Possible climate change impact on water resources...........................................................38
5.2.2 Limitations to updated Water Quantity MVA attribute .........................................................44
5.3 Water analysis results ..................................................................................................45
5.3.1 Water consumption stress index results...............................................................................45
5.3.2 Water Quantity (MVA results).................................................................................................50
6 MVA Attribute: Environmental Elasticity........................................................................................57
6.1 Background...................................................................................................................57
6.1.1 Water resources in Environmental Elasticity MVA ...............................................................57
6.1.2 Energy resources in Environmental Elasticity MVA..............................................................57
6.2 Summary of analysis ....................................................................................................58
6.3 Renewable Energy Metric.............................................................................................58
6.3.1 Justification for the Renewable Energy metric.....................................................................58
6.3.2 Methodology for Renewable Energy metric..........................................................................59
6.3.3 Analysis of Renewable Energy metric...................................................................................64
6.3.4 Future improvements to the Renewable Energy metric ......................................................66
6.4 Infrastructure vulnerability...........................................................................................66
6.4.1 Justification for including vulnerabilities in metric...............................................................66
6.4.2 Infrastructure vulnerability methodology..............................................................................68
6.4.3 Infrastructure Vulnerability metric limitations ......................................................................70
6.4.4 Results of Infrastructure Vulnerability metric.......................................................................70
6.4.5 Improvements to the Infrastructure Vulnerability metric.....................................................73
7 Recommended Stationing Analysis Improvements.....................................................................74
7.1 Use energy in Army stationing...................................................................................... 74
7.2 Use water in Army stationing........................................................................................ 74
7.3 Adopt the knowledge-action paradigm........................................................................ 76
7.4 Improve military data call questions............................................................................78
7.5 Include energy resources in the Environmental Elasticity MVA Attribute ..................79
7.5.1 Renewable energy metric......................................................................................................79
7.5.2 Infrastructure Vulnerability metric ........................................................................................79
7.5.3 Building energy consumption and costs...............................................................................80
7.6 Incorporate land lost from Sea Level Rise into stationing analysis ...........................80
7.6.1 Add SLR and flooding to the Buildable Acres MVA attribute...............................................80
7.6.2 Add land lost from SLR to test range capacity.....................................................................80
7.6.3 Include shifts to water consumption stress vulnerability in the Environmental
Elasticity MVA attribute..........................................................................................................81
18. ERDC/CERL TR-15-24 xvi
7.7 Reframe the Critical Infrastructure MVA attribute ......................................................81
7.8 Expand the time line of analyses.................................................................................82
7.9 Improve the use of Criterion 8 in cost estimating.......................................................82
7.9.1 Integrate science in Criterion 8 analysis...............................................................................83
7.9.2 Improve cost estimations.......................................................................................................83
7.10 Make Army Net Zero installations an OSAF constraint...............................................84
8 Conclusions and Recommendations ..............................................................................................85
8.1 Conclusions...................................................................................................................85
8.2 Recommendations........................................................................................................85
8.2.1 Water Quantity........................................................................................................................ 85
8.2.2 Environmental Elasticity ........................................................................................................86
8.2.3 SLR.......................................................................................................................................... 86
Acronyms and Abbreviations....................................................................................................................87
References...................................................................................................................................................90
Appendix A: Climate Change Supporting Documentation..............................................................100
Appendix B: Supporting Tables.............................................................................................................101
Appendix C: Documentation of Regional Water Consumption Stress Calculation....................106
Report Documentation Page (SF 298)................................................................................................129
19. ERDC/CERL TR-15-24 xvii
Illustrations
Figures
ES-1 Current CAA stationing decision analysis process.....................................................................vi
ES-2 CAA MVA model weighting matrix (2013)...................................................................................vii
ES-3 Spatial distribution of the case study sites in relation to their climate zones.......................xii
1-1 Current CAA stationing decision analysis process.....................................................................3
1-2 Current CAA MVA model weighting matrix (as of February 2013)...........................................4
1-3 Spatial distribution of the case study sites in relation to their climate zones........................9
2-1 The hydrologic cycle is the cycle of water moving from the Earth to atmosphere
and back. The hydrologic cycle is naturally in flux, but climate change is altering
the hydrologic cycle......................................................................................................................11
2-3 Regional trends in century-long flooding...................................................................................13
2-4 This map demonstrates regions in the Western United States where water supply
conflicts are likely to occur by 2025. This analysis does not factor in climate
change ...........................................................................................................................................15
2-5 Sign in Central California protesting the reductions in water for farming.............................15
2-6 Projected SLR from 1990 to 2100, based on three different emissions
scenarios, and observed annual global SLR over the past half century (red line),
relative to 1990............................................................................................................................16
3-1 An image of the washed out Mantoloking Bridge in New Jersey after Hurricane
Sandy in 2012 ..............................................................................................................................22
3-2 Impaired waterway at Fort Bragg, NC........................................................................................24
3-3 Transmission lines owned by four electric utility companies that service JBLM .................26
4-1 Water costs for case study installations....................................................................................35
5-1 Water Consumption Stress indices for 2050 and 2070.........................................................46
5-2 Impaired water surrounding Fort Riley, Kansas .......................................................................54
5-3 Impaired waterways and the Clover Creek watershed in Washington state........................56
6-2 Example of renewable energy data and application of Equation 6-1...................................64
6-3 Wildfire impact on low and high voltage transmission lines ..................................................68
7-1 The knowledge-action paradigm has historically placed an emphasis on
credibility (left); this work recognizes the interconnected nature of saliency,
credibility, and legitimacy ............................................................................................................77
B-1 Expected precipitation changes between 2005 and 2050; the southwestern
United States will have reductions in precipitation while the northeastern United
States will experience increased precipitation......................................................................105
C-1 Distribution of standardized scores........................................................................................109
C-2 Impaired Water Model combines the point, line and polygon data on impaired
waterways from the USEPA RAD_303d dataset to calculate what percentage of
an installation contains impaired waterways. Additionally, the analysis calculates
the percentage of land within the surrounding half mile that is considered
impaired......................................................................................................................................112
20. ERDC/CERL TR-15-24 xviii
C-3 The installation area of Aberdeen Proving Ground extends into the water. As
such, the SQ coverage should be subtracted from the total installation area. The
red line indicates the boundary of the installation...............................................................122
C-4 Results of spatial intersection of hurricane paths and transmission lines....................... 127
Tables
ES-1 Summary of climate zone and installations ...............................................................................xi
1-1 Summary of climate zone and installations ...............................................................................9
2-2 Trends in April snowpack from 1955-2013 in the western United States
demonstrate that, in general, there has been a decline in the snowpack size...................13
3-4 SLR regions and data availability. Due to its complex coastal geography,
Louisiana is not part of the dataset...........................................................................................29
3-1 Community infrastructure at risk from SLR and flooding .......................................................31
3-2 Community infrastructure surrounding an installation located within the 100-
year and 500-year flood zone.....................................................................................................32
3-3 Risk of land loss from SLR for case study installations...........................................................33
4-1 Water cost forecast for case study installations developed using quarterly cost
per Kgallon in the AEWRS database. The costs reflected here are in 2014 dollars
and are not adjusted for future inflation...................................................................................37
5-1 Summary of county water risk in 2005 and 2050..................................................................46
5-2 CONUS case study installation water stress risk .....................................................................48
5-3 Results of updated Water Quantity MVA attribute...................................................................51
5-4 Water use for the four counties that contain parts of Fort Bliss............................................53
6-1 Case study installation energy consumption, EUI, and energy cost changes from
FY03 to FY13 ................................................................................................................................60
6-1 Resource Abundance classification in FY12 ............................................................................63
6-2 Renewable energy potential metric results...............................................................................65
6-3 Results of wildfire risk assessment ...........................................................................................71
6-4 Results of hurricane risk analysis ..............................................................................................72
6-5 Infrastructure vulnerability score ...............................................................................................73
A-1 Relationship of climate phenomena to Army installation mission requirements.............100
B-1 Types of community infrastructure located within 40 miles of an installation that
are at risk of destruction from a flood event ......................................................................... 101
B-2 Land on coastal installations at risk of flood inundation as a result of SLR in
2050 and 2070......................................................................................................................... 101
B-3 Water stress scores for CONUS installations.........................................................................102
B-4 Community infrastructure within 40 miles of installation at risk of SLR...........................104
C-1 MVA score: Susceptibility to natural hazards.........................................................................128
21. ERDC/CERL TR-15-24 xix
Preface
This study was conducted for Headquarters, U.S. Army Corps of Engineers
(HQUSACE) under project 622720A896, “Environmental Quality Guid-
ance,” Work Package “Integrated Climate Assessment for Army Enterprise
Planning,” Work item L4F5G1, “Climate Change Impacts on Water and
Energy for Army Installations.” The technical monitor was Sarah Harrop,
Headquarters, Department of the Army (HQDA).
The work was performed by the Energy Branch (CF-E) and Materials
Branch (CF-M) of the Facilities Division (CF), U.S. Army Engineer Re-
search and Development Center, Construction Engineering Research La-
boratory (ERDC-CERL). The CERL Principal Investigators were James
Miller and Laura Curvey. At the time of publication, Andrew Nelson was
Chief, CEERD-CF-E, Vicki Van Blaricum was Chief, CEERD-CF-M; and
Michelle J. Hanson was Acting Chief, CEERD-CF. At the time of publica-
tion, Alan Anderson, CEERD-CV-T, was the Technical Director for Mili-
tary Ranges and Lands, CEERD-CV-T. The Deputy Director of ERDC-
CERL was Dr. Kirankumar Topudurti and the Director was Dr. Ilker Adi-
guzel.
COL Jeffrey R. Eckstein was Commander of ERDC, and Dr. Jeffery P. Hol-
land was the Director.
23. ERDC/CERL TR-15-24 1
1 Introduction
1.1 Background
Over the years, the needs of the U.S. Department of Defense (DoD)
change, often resulting in an excess of facilities and installations that are
no longer wanted or needed. Until the 1960s, DoD enjoyed wide latitude in
disposing of unneeded facilities. This relative freedom ended in the 1970s
when base closures were largely halted. During the 1980s under the
Reagan Administration, the institution of “BRAC 88” temporarily reiniti-
ated the Base Realignment and Closure (BRAC) process to overcome the
political hurdles associated with BRAC impacts on various constituencies.
The ’88 DoD BRAC Commission reported to the Secretary of Defense, who
forwarded the recommendation package to the President for approval/dis-
approval in its entirety. On presidential approval, the package was submit-
ted to Congress for their approval/disapproval in its entirety.
Although BRAC 88 was begun as a one-time action, subsequent BRAC
rounds were conducted in 1991, 1993, 1995, and 2005. No BRAC rounds
have been initiated since 2005. BRAC 2005 differed significantly from
previous BRAC rounds in that:
• It included a stable or increasing force structure (no drawdown).
• It was undertaken in a new threat environment (current ops and post-
9/11 environment).
• It placed a major emphasis on military transformation.
• It established a 20-year Net Present Value (NPV) cost horizon.
• A $21B budget “wedge” was established
• Headquarters and Support Activities Joint Cross-Service Groups (HSA-
JCSGs) were given an independent point of entry into the process.
There was significant overlap between the HSA-JCSGs.
• HSA-JCSG was chartered to merge Business Process Reengineering
with traditional BRAC. HSA-JCSG had no counterpart in previous
BRAC rounds.
• It recognized the need for integration with the military department
(MILDEP) teams.
24. ERDC/CERL TR-15-24 2
Such base realignment decisions have very long term consequences; deci-
sions regarding base realignment must consider resources for many years
into the future. When DoD considers stationing or restationing of Army
Forces, the Army engages the support of the Center for Army Analysis
(CAA) within the HSA-JCSG to consider a number of critical attributes of
installations and to perform the required analyses to determine what gives
specific installations military value (MV). CAA interviews Senior Leaders
and consults with subject matter experts (SMEs) to determine the MV at-
tributes (MVAs) that will be examined in the MVA analysis process. Alt-
hough there is flexibility as to which metrics are examined, the analysis is
bound by congressional mandate to examine eight criteria:
1. Criterion 1 The current and future mission capabilities and the impact
on operational readiness of the total DoD force, including the impact on
joint warfighting, training, and readiness.
2. Criterion 2. The availability and condition of land, facilities and associ-
ated airspace (including training areas suitable for maneuver by ground,
naval, or air forces throughout a diversity of climate and terrain areas and
staging areas for the use of the Armed Forces in homeland defense mis-
sions) at both existing and potential receiving locations.
3. Criterion 3. The ability to accommodate contingency, mobilization, and
future total force requirements at both existing and potential receiving lo-
cations to support operations and training.
4. Criterion 4. The cost of operations and the manpower implications.
5. Criterion 5. The extent and timing of potential costs and savings, includ-
ing the number of years, beginning with the date of completion of the clo-
sure or realignment, for the savings to exceed the costs as predicted by a
Cost of Base Realignment Actions (COBRA) model.
6. Criterion 6. The economic impact on existing communities in the vicin-
ity of military installations.
7. Criterion 7. The ability of the infrastructure of both the existing and po-
tential receiving communities to support forces, missions, and personnel.
8. Criterion 8. The environmental impact, including the impact of costs re-
lated to potential environmental restoration, waste management, and en-
vironmental compliance activities.
25. ERDC/CERL TR-15-24 3
1.1.1 Current Optimal Stationing of Army Forces/Military Value Analysis
(OSAF/MVA) process
Based on its experiences in a series of BRAC actions from 1988 to 2005
and other Army stationing activities, CAA developed an analytical process
to optimize its stationing decisions based on costs and military value. CAA
is constantly updating its process and running stationing models. Cur-
rently, CAA’s process (Figure 1-1) is composed of four subprocesses:
1. MVA modeling
2. Evaluation of the Optimal Stationing of Army Forces (OSAF)
3. Evaluation of the COBRA
4. Formulation of final Courses of Action (COAs) and/or recommendations.
This iterative process builds on MVA models that are based on a set of at-
tributes that define the Military Value of Installations according to Criteria
1 to 4. The MVA models result in installation rankings and scores that pro-
vide input to the OSAF model. OSAF and MVA outputs are combined to
produce scenarios and COAs, which are then input to the COBRA tool. Ul-
timately, this process yields final COAs and recommendations.
Figure 1-1. Current CAA stationing decision analysis process.
26. ERDC/CERL TR-15-24 4
1.1.1.1 MVA modeling
MVA is a process of determining the Military Value of Installations based
on a set number of attributes—quantifiable characteristics used in the
MVA that relate to DoD selection criteria. Attributes are measures of vari-
ous aspects of an installation’s military value. Within the MVA, the attrib-
utes are weighted based on their operational importance and ease of
change relative to each other. Each attribute has a specific weight, which is
expressed by a value within the range of 0-10.
For example, recent stationing actions have considered such attributes as
maneuver land availability, housing, and water quantity. The maneuver
land attribute is considered to be of high operational importance, and one
that is difficult to change since additional maneuver land is not easily ac-
quired. Consequently, the maneuver land attribute is weighted more heav-
ily than an attribute such as quality of life facilities, which is more easily
changed since it can be improved by investment. Installations receive a
value for each attribute based on collected data. Individual attribute scores
are then weighted and summed to produce the installations’ overall mili-
tary value scores (GAO 2013). Figure 1-2 shows the weights assigned to at-
tributes in recent small-scale CAA stationing efforts.
Figure 1-2. Current CAA MVA model weighting matrix (as of February 2013).
27. ERDC/CERL TR-15-24 5
1.1.1.2 Evaluation of OSAF
The OSAF model was developed to determine the optimized stationing of
Army Forces. Unlike the MVA model, which focuses on the value of instal-
lations, the OSAF deals with specific constraints that will affect the growth
of installations. Working as an optimization model, OSAF seeks to maxim-
ize the NPV while still meeting Army requirements.
1.1.1.3 Evaluation of COBRA
Scenarios produced by OSAF are run through the COBRA model, which
includes recurring and one-time costs, including environmental and waste
management costs. These values are derived from Base Operation Support
(BOS) costs, which are included in the Installation Status Report (ISR).
1.1.1.4 Formulation of COAs and/or recommendations
The MVA models result in installation rankings and scores that provide in-
put to the OSAF model. OSAF and MVA outputs are combined to produce
scenarios and COAs that are input to the COBRA tool. Ultimately, this pro-
cess yields final COAs and recommendations.
1.1.2 Opportunities for process improvement
1.1.2.1 Consider a longer NPV horizon
The U.S. Army operates in an environment undergoing constant change.
Budgets, political considerations, international threats, technological de-
velopments, and numerous other concerns require the Army to be in a
constant state of planning and preparing for future needs. Inevitably, a
major question faced by Army planners deals with optimizing the station-
ing of Army Forces for purposes of training, maintaining, and when neces-
sary, deployment. OSAF is a very complex issue that rarely has an obvious
solution. Decisions to station forces in one location versus another have a
myriad of impacts, many of which can have effects for many decades into
the future. As a result, careful analysis must identify and weigh all signifi-
cant factors and impacts of Army stationing decisions.
BRAC 2005 required consideration of a 20-year NPV analysis. Since Army
stationing decisions have very long term implications not only for the
Army, but also for gaining and losing communities, and since the possible
28. ERDC/CERL TR-15-24 6
effects of climate change may not be fully realized for decades, a 20-year
NPV analysis may no longer be adequate. A longer NPV analysis (perhaps
40 to 50 years) may be more appropriate.
1.1.2.2 Consider climate change impacts
Climate change can be expected to affect Army installations in at least two
critical areas: water and energy. Since stationing decisions have very long
term implications and impacts, it is necessary to consider possible future
effects of climate change on Army installations (see Appendix A). In the
course of conducting a stationing analysis, it may become necessary to bet-
ter distinguish between two or more installations that have very similar
MVA scores based on Criteria 1 through 4. In making such distinctions,
CAA must consider not only the abilities of existing and potential receiving
communities to support forces, missions, and personnel (Criterion 7), but
also the environmental impact of a stationing decision, including the im-
pact of costs related to potential environmental restoration, waste man-
agement, and environmental compliance activities (Criterion 8).
1.1.2.3 Include environmental analysis in the stationing analysis process
While the current process is useful, CAA has expressed the belief that the
process may benefit from further development and improvement. In par-
ticular, in its review of the 2005 BRAC, the Government Accountability Of-
fice (GAO) highlighted that DoD’s environmental analysis was incomplete.
Specifically, GAO said that DoD should have given better consideration to
environmental restoration of bases undergoing closure or realignment
(GAO 2005, p 45). To overcome such deficiencies in future analyses, exist-
ing attributes may need to consider additional metrics. If so, there is a
need to identify those metrics, to identify and locate the data available to
evaluate them, and to devise a method to calculate them. A broader con-
cern is whether there is a need to consider additional relevant attributes
not yet included in the current process. Again, if that is the case, then there
is a need to identify those attributes, to identify and locate the data availa-
ble to evaluate them, and to devise a method to calculate them.
Although its stationing decision analysis process has worked well in the
past, CAA has expressed the desire to improve the process for use in future
stationing analyses. Since climate change can be expected to have an im-
pact on the Army’s costs and ability to fulfill its missions, it is in the
29. ERDC/CERL TR-15-24 7
Army’s interest to include an environmental analysis in stationing deci-
sions to enable the Army to better predict and respond to the effects of the
changing climate. Army installation realignment may be affected by cli-
mate change, or it may further exacerbate problems resulting from climate
change in a particular area. Stationing analyses that consider climate fore-
casting can recognize future uncertainties while also striving to best pre-
pare for the consequences of climate change. The inclusion of climate fac-
tors in the stationing analysis process will enable a more complete
modeling and cost analysis.
To assist CAA in its effort to improve the stationing analysis process, this
work aimed to:
• gather and manage a new dataset for use in other efforts
• consider possible additional attributes for the MVA model
• develop environment-related constraints for the OSAF model
• assist in specific scenario-related development
• contribute to analysis of environmental impact (Criterion 8).
1.2 Objectives
The objective of this work was to assist CAA in evaluating the current
Army stationing analysis process and in responding to the critiques on the
process brought forward by the GAO by focusing on the possible ramifica-
tions from Global Climate Change (GCC) on the stationing decision analy-
sis process, specifically with respect to Criteria 7 and 8.
1.3 Approach
The project team studied the CAA stationing analysis process to gain a
working understanding of the existing system. Team members sought to
increase the depth of environmental (and, in particular, climate change-re-
lated) analysis in the existing MVA attributes so that an improved environ-
mental analysis could be used in general stationing. Where it appeared
that climate change might affect existing MVA attributes, the team sought
possible metrics to improve those attributes. The team then sought data
sources that could be applied Army-wide. When such data were available,
the team developed methods for calculation of those metrics.
30. ERDC/CERL TR-15-24 8
This project team focused on attributes and metrics associated with cli-
mate change impacts on water and energy at Army installations and facili-
ties. In parallel efforts, other project teams considered how climate change
might impact installations’ abilities to deploy forces and to conduct firing
and maneuver training on Army training ranges.
The first step of this approach was to gain a familiarity with the CAA sta-
tioning decision analysis process. The next step was to consider the pro-
jected impacts of climate change and how they might be expected to affect
Army installations. This included an investigation of existing MVA attrib-
utes that appeared to be subject to possible climate change effects. Also
considered were any new MVA attributes that might merit further consid-
eration and development. In considering any candidate MVA attributes,
every attempt was made to keep the “SMART” approach in mind such that
any proposed attributes should be:
• Specific – clear and focused to avoid misinterpretation; assumptions
and definitions should be easily interpreted or explained.
• Measurable – can be quantified and compared to other data; should
allow for meaningful statistical analysis (avoid binary “yes/no”
measures – those become “screening” criteria).
• Attainable – achievable, reasonable, and credible under conditions
expected.
• Realistic – fits into the models and is cost-effective.
• Timely – achievable within the time frame given.
After identifying relevant MVA attributes, metrics were then identified that
could be used to quantitatively score installations against each other. Met-
rics imply the need for data, so existing data sources that could be used in
calculating metrics were investigated. To be useful, data must be reliable,
credible, maintainable, and commonly available for all Army installations.
For all metrics for which suitable data were available, methods for calcula-
tion of scores for each metric were developed and documented.
Subsequent chapters of this report briefly address proposed augmented
MVA attributes, their associated metrics, available data and calculation
methods. More detailed discussions are provided in the appendices.
31. ERDC/CERL TR-15-24 9
1.4 Scope
Seven case study installations that span the continental United States and
are located in a variety of climate zones were selected to provide means to
test the impact of climate change on the U.S. Army (Table 1-1 and Figure 1-
3). All methods used in this study are scalable and can be used to assess all
Army installations located within the United States.
1.5 Mode of technology transfer
It is anticipated that the results of this work will provide a foundation for
follow-on research in support of CAA Army stationing (restructuring and
realignment) analyses.
Table 1-1. Summary of climate zone and installations
Installation State ASHRAE Climate Zone
Fort Lewis WA Mixed-Marine
Fort Bliss TX Warm-Dry
Fort Riley KS Mixed-Moist
Fort Drum NY Cold-Moist
Fort Bragg NC Warm-Moist
Fort Wainwright AK Subarctic
Schofield Barracks HI Very Hot
Figure 1-3. Spatial distribution of the case study sites in relation to their climate zones.
32. ERDC/CERL TR-15-24 10
2 Climate Change Impacts – General
Climate change is a real phenomenon that (per the 2014 National Climate
Assessment) already impacts the United States and that can be expected to
impact Army installations and operations in a variety of ways. Although
climate change is not always obvious, ongoing effects in the coming dec-
ades are expected to be significant, especially as related to global tempera-
ture changes, the frequency and intensity of storms, increases in numbers
and intensities of droughts and floods, and changes in supply and costs of
associated water and energy resources.
2.1 Impact of climate change on water
2.1.1 Changed water cycle
The Earth’s water is always in movement, cycling from the atmosphere to
land and the oceans (via precipitation and runoff) and back to the atmos-
phere. This hydrologic cycle (Figure 2-1) is a dynamic and naturally vary-
ing process that is necessary for all life to exist. While societies and ecosys-
tems are accustomed to this variability, climate change is affecting the
hydrologic cycle in new ways at various times and geographic scales (Ge-
ogakakos et al. 2014). While the mass of water on Earth remains constant
over time, the portioning of the water into ice reservoirs, fresh water, salt
water, and atmospheric water is shifting. These shifts may result in in-
creased drought, warmer temperatures, and storms of greater intensity.
The warming of the planet is expected to result in significant changes in
the water cycle since the movement of water in the oceans and the atmos-
phere is one of the primary mechanisms for the redistribution of heat
around the world (Karl, Melillo, and Peterson 2009). Warm air can hold
more moisture than cold air. For every 1 °F temperature increase, the ca-
pacity of the atmosphere to hold water increases by about 4% (Braconnot
et al. 2007). As global temperatures increase, the atmosphere will hold ad-
ditional moisture from evaporation of water from both land and the sea.
33. ERDC/CERL TR-15-24 11
Figure 2-1. The hydrologic cycle is the cycle of water moving from the Earth to atmosphere and
back. The hydrologic cycle is naturally in flux, but climate change is altering the hydrologic cycle.
Source: Evans and Perlman 2014
2.1.2 Changed precipitation patterns
The individual components of the water cycle are linked to each other so
that changes in one part of the cycle can affect other portions of the cycle.
Concurrent changes in atmospheric circulation are moving storm tracks
northward, reducing precipitation in the arid Southwest and intensifying
the drought in that area, while increasing precipitation in the Northeast,
Midwest, and Alaska (Karl, Melillo, and Peterson 2009).
Increased evaporation of water vapor into the atmosphere will ultimately
result in increased global precipitation. This increased precipitation will
not be uniformly distributed so that some locations will see significant to-
tal annual precipitation increases while other locations will experience de-
creased annual precipitation totals. Another effect is that individual pre-
cipitation events may be much larger than normal since high levels of
34. ERDC/CERL TR-15-24 12
water vapor in the atmosphere and warmer temperatures feed the inten-
sity of storm events (Walsh et al. 2014).
Models predict that the northern United States will have additional precip-
itation (particularly in the winter and spring) while the southern United
States will have reduced precipitation, particularly in the spring. While to-
tal precipitation amounts may fall or remain constant in the southern
United States, the amount of rain falling in single storm events is likely to
increase in most regions.
2.1.3 Loss of snowpack
Furthermore, the proportion of precipitation falling as rain versus snow
has increased. Snowpack, a vital water source and cooling agent, is shrink-
ing. Analyses conducted by the U.S. Environmental Protection Agency
(USEPA) found a decline in snowpack at 75% of their monitoring sites in
the western United States with an average decline of about 14% (USEPA
2014a). As Figure 2-2 shows, the decline has not been generally consistent.
There has been a noted increase in snowpack in the Sierra Nevada Moun-
tain Range. The declines in the snowpack are temporarily increasing water
supplies and increasing precipitation, resulting in some flooding. In the
long term, these regions will have less water, as an increase in air tempera-
ture of 4.3 °F could reduce stream flows by 12% or more for much of the
western United States (Berghuijs, Woods, and Hrachowitz 2014).
In western states that depend on spring thaws, increased snowpack melts
from higher temperatures will temporarily increase flooding and river flow
rates, and improve water quality, but will eventually cause water supplies
to diminish as those snowpacks are no longer restored during the warmer
winter months. Current weather patterns manifest these regional shifts.
Figure 2-3 shows that shifts in flood frequency have not been evenly dis-
tributed throughout the United States. The Northeast has had increases in
flooding while much of the Southwest has experienced reductions in flood-
ing (Peterson et al. 2013).
35. ERDC/CERL TR-15-24 13
Figure 2-2. Trends in April snowpack from 1955-2013 in the western United States
demonstrate that, in general, there has been a decline in the snowpack size.
Source: USEPA (2014a).
Figure 2-3. Regional trends in century-long flooding.
Source: Peterson et al. (2013).
36. ERDC/CERL TR-15-24 14
2.1.4 Localized water shortages
The implications of GCC on water resources in the United States will vary
between regions. Some areas will experience minor divergences from the
norm while others will undergo increases in extremes (Peterson et al.
2013). Areas such as the southwestern United States are expected to con-
tinue to experience reduced precipitation levels and decreased water flow
in rivers and streams due to lower annual precipitation and reduced snow-
melt. These areas will have to cope with increasing water scarcity despite a
rising population. This combination of circumstances will accelerate in-
creases in the cost of water, place limitations on irrigation, and degrade
overall water quality.
In the Southwest, the fastest growing region in the United States, there is a
clash between population growth and reduced rainfall and water supplies.
Figure 2-4 shows seven metropolitan areas in which conflict over water
supplies is likely to occur by 2025: Denver, CO; Houston, TX; Santa Fe,
NM, Salt Lake City, UT; Carson City and Los Vegas, NV; and San Fran-
cisco, CA (Melillo, Richmond, and Yohe 2014). This analysis, which ex-
cludes climate change-related water pressures, demonstrates that current
water demands are higher than supply. Additional water pressures associ-
ated with climate change can only exacerbate these water conflicts (Karl,
Melillo, and Peterson 2009).
These conflicts have already begun. California state water officials, in re-
sponse to the multi-year drought that has caused a rapid decline in the
smelt population and coupled with the demands of the urban California
population, have ordered the water dependent farmers of the San Joaquin
Valley in California to reduce their water intake for the good of the roughly
two-thirds of Californians who are downstream users of the Sacramento-
San Joaquin River Delta (Hackman 2015). Figure 2-5 shows a popular re-
sponse to the restriction.
In 2014, Texas state regulators forced hundreds of farmers to stop pumping
water from the Brazos River because a petrochemical plant downstream
with senior rights to the water demanded more water from upstream. How-
ever, in the name of safety and public health, cities and power plants along
the river were exempted from this requirement (Wines 2014).
37. ERDC/CERL TR-15-24 15
Figure 2-4. This map demonstrates regions in the Western United States where water supply
conflicts are likely to occur by 2025. This analysis does not factor in climate change
Source: Karl, Melillo and Peterson (2009).
Figure 2-5. Sign in Central California protesting the reductions in water for farming.
Source: Lynn Friedman/Flickr.
38. ERDC/CERL TR-15-24 16
The effects of climate change and the public’s desire to support current
quality of life levels are pressuring water supplies throughout the United
States even in relatively water rich locations. For example, the over-pump-
ing of New Jersey’s Potomac-Raritan-Magothy aquifer system has dropped
its water levels by more than 100 ft. This over-pumping of the aquifer,
combined with rising sea levels has resulted in increasing salt water intru-
sion into the freshwater supply. As freshwater is less dense than salinated
water, the aquifer is still able to produce potable water. Yet the farther the
water level is drawn down, the more that saltwater is able to intrude and
contaminate the aquifer.
2.1.5 Sea level rise
Increasing temperatures contribute to shifting of hydrologic patterns
through accelerated melting of Arctic glaciers, which in turn increases the
rate of global sea level rise (SLR), which is well documented and will have
tremendous implications on the mission of the U.S. Army. Because of SLR,
some installations may have reduced access to training lands while in
other areas, key infrastructure may be damaged or destroyed. Over the
past century, the Global Mean Sea Level (GMSL) rose at an average rate of
1.7 mm a year. From 1993-2010, sea levels have risen by an average rate of
3.2 mm per year (Stocker et al. 2014). Thermal expansion, the melting of
glaciers and polar ice-caps, and ice loss in Greenland and Antarctica are all
causes for the rise in GMSL. Figure 2-6 shows SLR projections from 1990
to 2100 based on three emissions scenarios.
Figure 2-6. Projected SLR from 1990 to 2100, based on three different emissions scenarios,
and observed annual global SLR over the past half century (red line), relative to 1990.
Source: NRC (2010).
39. ERDC/CERL TR-15-24 17
2.2 Impact of climate change on energy
The effects of climate change on energy and water are closely related. Wa-
ter plays an integral role in the production of electricity, and the energy in-
frastructure is vulnerable to conditions characterized by too much or too
little water—those conditions caused by the warming climate. GCC projec-
tions touch every sector of energy, from production and generation, to
transportation and distribution, to demand. The main GCC factors that
create vulnerability in the energy sector are: (1) increasing air and water
temperatures, (2) decreasing water availability across regions and seasons
and (3) increasing intensity and frequency of storm events, flooding, and
SLR (USDOE 2013).
2.2.1 Increasing air and water temperatures
Air and water temperatures affect many energy sectors such as oil and gas
production, thermoelectric power generation, biofuel production, solar en-
ergy, the electric grid, and energy demand:
• Oil and gas production would experience changed infrastructure re-
quirements due to thawing permafrost in the Arctic with longer ice-free
Arctic seasons.
• Plants using coal, natural gas, nuclear, and geothermal means to gener-
ate electrical energy also require significant amounts of water in their
cooling processes. Increasing ambient air and water temperatures in-
creases the likelihood that effluent water temperatures will be higher
than allowable standards, which can damage the local ecology and in-
crease the risk of facility shutdowns (USDOE 2013).
• Biofuels and bio-energy would require higher irrigation demand and
would be more susceptible to crop damage from extreme heat events
and droughts.
• Crystalline silicon photovoltaic (PV) cells are sensitive to increasing
temperatures and are more susceptible to heat-related efficiency losses
(USDOE 2013).
• Approximately 7% of power is lost in transmission and distribution
(EIA 2007). Assuming that temperatures rise as expected, a California
study predicts that transmission losses will increase while the capacity
of transmission lines will decrease (Sathaye 2013).
• As air temperature increases, the demand for energy for cooling will in-
crease in warmer climates.
40. ERDC/CERL TR-15-24 18
2.2.2 Decreased water availability
Decreased water availability would affect all stages of oil and gas produc-
tion from drilling to production and refining. Decreased water availability
would also likely affect transportation by reducing water levels of naviga-
ble rivers, which would disrupt barge transport of petroleum products and
coal. Decreased water availability would reduce the efficiency and capacity
of hydropower plants and any type of power-generating plants that require
cooling. The associated increased chances of drought would also diminish
the production of biofuels.
2.2.3 Increasing intensity and frequency of storm events, flooding, and
SLR
In addition to raising the global sea level, increased temperatures and
melting of polar ice-caps will result in increasing intensity and frequency
of extreme storm events and floods. This trend is likely to continue as air
temperatures increase, thereby melting more of the polar ice-caps. The
greater frequency of more extreme events increases the probability of
damage to all types of infrastructure, including the highly vulnerable en-
ergy sector. Extreme weather and flooding have damaged electrical grids,
oil platforms, rail and barge transportation systems, and have inundated
commodity fields for biofuels. SLR has the potential to impact coastal
power-generating facilities and river fuel transport systems.
41. ERDC/CERL TR-15-24 19
3 Climate Change Impacts on the Army
3.1 Army energy and water strategies
3.1.1 Army energy strategy
For DoD, energy security means assuring access to reliable supplies of energy
and the ability to protect and deliver sufficient energy to meet mission-essen-
tial requirements. DoD’s Strategic Energy Security Goals (ESGs) are to:
• Reduce energy consumption
• Increase energy efficiency
• Increase renewable/alternative energy
• Assure access to energy supply
• Mitigate harmful environmental impacts.
Three key objectives defined to ensure energy security include:
1. Developing more “energy-efficient weapons systems, platforms, equip-
ment and facilities”; investing in cost-effective energy sources; and inte-
grating energy analysis into decision making and business processes.
2. Promoting energy security of non-DoD capabilities, equipment and infra-
structure that indirectly support defense missions and assets.
3. Advancing future missions and capability through technological innovation.
3.1.2 Army water strategy
The Army generally defines water resources in terms of their value for con-
sumption—their availability to be consumed, their availability to support
additional consumers, and their costs. For example, the Water Quantity
MVA attribute defines the amount of water that an installation can con-
sume. This enterprise-wide strategy is underscored in recent Army direc-
tives, such as the Army Energy Security Implementation Strategy (AESIS)
Plan and Executive Order (EO) 13514, which requires the following water
use reductions relative to a 2007 baseline:
• potable water (26% by the end of FY20)
• industrial, landscaping, and agricultural water (20% by the end of
FY20) (Army Energy and Water Management Program 2014).
42. ERDC/CERL TR-15-24 20
Yet the effects of water and water stress go beyond the consumptive uses of
the resource. Reductions in a water supply will have implications on other
sectors—ranging from electricity production, to wetland amphibians, to re-
duced crop production. The Army often overlooks the destructive conse-
quences of too much or too little water, such as SLR, drought, and increased
flooding. The main Army water management goal, which deals with the de-
structive nature of water, is the sustainability goal (EPAct 05, Sec. 109).
Bifurcating the “natural” and consumptive uses of water in Army analysis
leads to an incomplete understanding of water stress as it affects Army in-
stallations. This narrow interpretation of water ignores the other effects
that water may have on an installation, while recognizing that potable wa-
ter is crucial for survival.
These recommendations and analyses are based on a holistic understand-
ing of the effect that water has on the MV of an installation by pairing the
current view of consumption with natural forces. This water analysis ex-
plores the nexus of water consumption and natural forces, shedding light
on the relationship between these two considerations. For example, this
work demonstrates how climate change may reduce water supplies in
some portions of the United States (a natural force) and how that may re-
duce the amount of water available for Army use (consumption). Analysis
conducted by the RAND Corporation for the U.S. Army found that water
scarcity due to climate change will be one of the key challenges for the
United States Army in coming years (Lachman et al. 2013).
3.2 Reduced ability to respond
Climate change will affect the capacity of the U.S. Army to respond to
events in fulfillment of its mission. The 2014 Quadrennial Defense Review
stated that, because of climate change, the frequency, scale, and complex-
ity of future military missions may be affected (DoD 2014). Rather than
building a military to respond to the effects of climate change, the Center
for Naval Analyses (CNA) Corporation’s Military Advisory Board has ad-
vised the U.S. military to be ready to respond to the variety of challenges
that will come. The reduction in the Army’s ability to respond to its mis-
sion as a result of climate change can be characterized in three ways: re-
duced capacity, reduced military training, and reduced infrastructure
(CNA Military Advisory Board 2014).
43. ERDC/CERL TR-15-24 21
Destruction of the infrastructure will affect an installation’s readiness to
deploy. The CNA Military Advisory Board has stated that it is just as im-
portant to look at the infrastructure in the communities surrounding in-
stallations as the installations themselves. The readiness risk is higher now
than at any previous historical point as there is less redundancy in person-
nel. The military has been engineered to develop more combat capacity
with fewer units, so that consequently “the degradation of a given base to-
day has much more impact to overall military capability than in the past.”
(CNA Military Advisory Board 2014, 24). Installations will clearly be af-
fected if compromises to the infrastructure in the communities surround-
ing the installation hinder Soldiers and civilians from getting to work. It
will not be sufficient to harden Army installations if, for example, roads
leading to the installation are impassable due to high waters or the region
experiences a power outage due to a water shortage at a power plant’s
cooling facilities.
Increased storm intensities and SLR will destroy crucial infrastructure that
military installations require. Rising seas and storm surges can be large
enough to damage bridges, such as the Mantoloking Bridge (Figure 3-1),
which was washed out during Hurricane Sandy (2012). The effects of the
storm demonstrate the vulnerability of infrastructure to both SLR and
storm surges. Currently more than 60,000 miles of coastal roads are occa-
sionally exposed to coastal waves and surges (Douglass and Krolak 2008).
SLR and storms of greater intensity will increase the number of roads and
severity of roads inundated with seawater. The risk of roads being washed
out after a storm surge event reduces the capacity of service members to
rapidly deploy.
The coasts of the United States are major economic hubs that serve as cru-
cial points in the supply chain. Six of the top 10 freight gateways in the
United States (by value of shipment) will be placed at risk by SLR. The
Gulf Coast, the vulnerability of which was demonstrated in the hurricanes
of 2005, has seven of the 10 largest domestic ports as measured by tons of
traffic (National Research Council et al. 2008). Destruction of this infra-
structure could affect the rapid deployability of units, as regional infra-
structure that they depend on may not be usable.
44. ERDC/CERL TR-15-24 22
Figure 3-1. An image of the washed out Mantoloking Bridge in New Jersey after Hurricane
Sandy in 2012.
Source: Nesius (2012)
Additionally, destruction of ports may affect shipments of food and other
goods to installations and their surrounding regions. Rising sea levels can
restrict boats from passing under bridges, affecting commerce, travel, and
supply lines. For example, in Fishing Creek, MD, SLR has caused rising
tides such that many fishing boats and some cargo boats can no longer
clear the Maryland Route 261 bridge to get to the Chesapeake Bay (Hille
2013). In California, over 1,900 miles of roads are currently at risk of a
100-year storm event. This number is expected to double to 3,500 miles if
global SLR exceeds 1.4 meters.
3.3 Reduced capacity
The military’s overall mission capacity is likely to be reduced because of
climate change. As storm events increase in intensity, active Army, Army
Reserve, and Army National Guard units could be called on to respond to
these storm events. The CNA Corporation’s Military Advisory Board ex-
pects that the use of active forces in Defense Support of Civil Authorities
(DSCA) will increase, stressing the Guard, Reserve, and the U.S. Army
Corps of Engineers (USACE). Further complicating the capacity of the
Army is the implementation of the “total force” concept, in which some ca-
pabilities exist only in the National Guard, Army Reserves, or USACE.
45. ERDC/CERL TR-15-24 23
However, these components are being deployed with increasing frequency
to respond to natural disasters such as wildfires, flooding, snow storms,
and or natural disasters in which troops are required to provide and dis-
tribute water. The CNA Military Advisory Board (2014, p 23) writes that:
We believe that the increased frequency, duration, and magnitude of these
extreme weather events will stress these organizations’ capacities and in-
crease the degree to which active forces will be called on in DSCA missions.
A number of climate change effects (increasing air and water tempera-
tures, storms of greater intensity, and droughts) can decrease water qual-
ity (Geogakakos et al. 2014). More specifically, increased sediment, nitro-
gen, and pollutant loads will reduce the quality of water resources. In this
new climate regime, Army installations may be forced to curtail activities
to prevent their water supplies from exceeding the threshold of contami-
nants in water legally defined by the CWA, which ensures clean water by
requiring that contaminants present in water be below the Total Maximum
Daily Load (TMDL), a contamination threshold set by states, territories, or
authorized tribes. TMDL is a calculation of the amount of pollutant that a
body of water can receive and still be potable (USEPA 2014). When the
level of contaminants is above the TMDL, waterways are classified as “im-
paired water” and are subject to strict pollution and reporting standards.
Army installations are not exempt from TMDL restrictions. While opera-
tional shifts to reduce TMDL of contaminants may be minor and tempo-
rary, these shifts could be required for an indefinite period. Installations
may have to change infrastructure, water treatment technologies, or use of
facilities to reduce their runoff TMDL (USEPA Office of Water 2008). One
result of having water surrounding an installation classified as impaired is
a reduction in training or other activities that may pollute water. For ex-
ample, in 2011, a 1.2-mile segment of the Little Cross Creek on Fort Bragg
was measured above the TMDL level and was classified as “impaired wa-
ter” (Figure 3-2). As a result of this classification, Fort Bragg has been re-
quired to perform increased monitoring and reporting. Fort Bragg’s permit
application (No. NCS000331 2011) to discharge storm water into the Little
Cross Creek lists the following required actions: reporting use of Best
Management Practices (BMPs), annual reporting on the effectiveness of
BMPs, development of a monitoring plan for each pollutant of concern,
and the development of an implementation plan.
46. ERDC/CERL TR-15-24 24
Figure 3-2. Impaired waterway at Fort Bragg, NC.
3.4 Reduced availability of training lands
Extreme weather events such as droughts, floods, snow, and ice storms
have significant impacts on military training operations through increased
risks to life and safety, injury, and reduction in mission performance. In
wartime operations, Commanders are forced to take large risks to execute
their mission in extreme weather events. However, in peacetime training,
Commanders are expected to refrain from putting lives at risk under ex-
treme weather conditions. The expected change in weather patterns from
climate change will reduce the number of training days. If conditions are
too dry, the risk of wildfires increases, reducing training capacity. Under
such dry conditions, the use of live-fire, high explosive rounds, and tracer
rounds is suspended (or allowed only with extraordinarily precautionary
measures) when the risk of wildfires is high. Furthermore, heavy rainfall
and low visibility increases risks and limits training where visual feedback
is required (Hayden et al. 2013, CNA Military Advisory Board 2014).
Texas experienced historic droughts in 2011. Under these drought condi-
tions, three fires started at Fort Hood that summer during live-fire train-
ing. During the 2011 season, over 19,000 acres of training land (over 8% of
47. ERDC/CERL TR-15-24 25
installation land) were consumed in wildfires (Vanover 2014). As a re-
sponse to the fire risk, training with live rounds and tracer rounds was sus-
pended. The ban on this training extended for so long that Commanders
ultimately used helicopters to drench training lands and prepositioned fire
trucks to enable Soldiers to train with live-fire (CNA Military Advisory
Board 2014).
Furthermore, SLR will inundate low-lying buildings and reduce available
training land. The 2014 Quadrennial Defense Review recognized this chal-
lenge in its statement that “the Department’s operational readiness hinges
on unimpeded access to land, air, and sea training and test space” (DoD
2014). Rising sea levels and large storms increase the likelihood of inland
flooding from storm surges. Analysis of 55 sites on the Atlantic, Pacific,
and Gulf coasts of the contiguous United States conducted by Climate Cen-
tral, a nonprofit organization focused on researching and reporting the sci-
ence and impacts of climate change, found that 66% of these locations are
expected to have a 100-year flood event within the next 18 years. Addition-
ally, they determined that many of these floods would be caused by storm
surges (Strauss, Tebaldi, and Ziemlinski 2012). For the Army, coastal
training lands may become unavailable for training maneuvers with higher
tides and lands saturated with water.
3.5 Reduced energy security
Overall, the effects of climate change on the existing energy infrastructure
may be modest, but local and industry specific impacts could be large, espe-
cially in sensitive areas prone to warming (Alaska) or weather disruptions
(coastal regions) (Bull et al. 2007). Electric grid vulnerability can increase
the occurrence of power outages. Army activities, including basic day-to-day
functions, are dependent on this interconnected electrical network.
For example, reductions in precipitation (increasing drought conditions) es-
pecially in the Pacific Northwest of the United States, have already affected
the Bonneville Power Administration (BPA). BPA markets electric power
from the Bonneville Dam located on the Columbia River to Joint Base Lewis-
McChord (JBLM) through a utility services contract for Federal sites (Steucke
2012). Figure 3-3 shows four transmission lines serving the installation.
48. ERDC/CERL TR-15-24 26
Figure 3-3. Transmission lines owned by four electric utility companies that service JBLM.
BPA’s vulnerabilities to climate change include a reduction in the surface
water supply due to decreased snowpack in the winter and earlier snow melt
in the spring (Melillo et al. 2014). The resulting lower river flows will di-
rectly affect the energy supply to JBLM because the BPA and City of Centra-
lia, WA, use hydropower to generate electricity. Since BPA is a major elec-
tric provider to the region (30% of electric power used in the Northwest
[BPA 2013]), predicted climate changes that affect the timing of snowmelt
streamflows will increase the competition for water resources and can limit
the availability of electricity to JBLM (Melillo, Richmond, and Yohe 2014).
Damaged infrastructure due to SLR, storm surge, and flooding
With a changing climate, installations are at risk of flooding from SLR,
storm surge, and inland storm events. SLR and storm surge will have a
minimal impact on the direct mission of the U.S. Army, as only 10 installa-
tions are located on the coast. However, these 10 coastal installations face
the challenge of land loss due to SLR. This analysis concludes that by
2070, an additional 2,703 acres of Army installations are expected to be
49. ERDC/CERL TR-15-24 27
inundated with sea water. While this accounts for just over 0.58% of land
of coastal installations, the effects range from 0.1 acres at Fort Hamilton to
over 1,400 acres at Joint Base Langley-Eustis.
The infrastructure that installations rely on is also at risk of SLR and in-
land flooding resulting from climate change. Since the sites in the Defense
Critical Infrastructure Program (DCIP) are classified, this analysis cen-
tered on community infrastructure at risk of SLR and flooding. The tools
and methods developed for analyzing community infrastructure can be ap-
plied to sites cataloged in DCIP. The community infrastructure analyzed
was that located within 40 miles of an installation that was at risk of flood-
ing during the specific horizon or storm event. Temporary disruptions to
the services provided by these facilities because of changing climate may
affect the physiological well-being of service members. For example, if a
number of schools in the community surrounding an installation were de-
stroyed in a storm event, this would not directly affect the capacity of the
installation, but it would affect service members and supporting civilians
with children who attend those schools who would be unable to accom-
plish their work to full capacity.
In addition to the 10 coastal installations, an additional 18 are located
within 40 miles of the coast. These installations will not lose land to SLR,
but will be affected by the loss of infrastructure in the surrounding region.
3.5.1 Limitations and assumptions of SLR and storm surge analysis
3.5.1.1 Storm surge threshold
For calculating storm surge, the selected threshold was the likelihood that
in the decade examined (either 2050 or 2070), there is at least a 51%
chance that water will exceed the elevation threshold. This threshold was
selected for two reasons. First, a 51% threshold demonstrates that there is
a higher likelihood of water reaching that point in the decade than not,
thereby demonstrating a real risk. Secondly, the 50% threshold is used on
the Climate Central website and in its data downloads. For each coastal
city or county, users are able to download an Excel spreadsheet that pro-
vides the decade by which there is a ⅙ and ½ chance of flooding to eleva-
tions of 1 to 10 ft above local mean high tide. By using their existing scale,
it was possible to fit into the existing common uses of the data.
50. ERDC/CERL TR-15-24 28
3.5.1.2 Rounding of SLR
The National Oceanic and Atmospheric Administration (NOAA) data pro-
vide SLR impacts in 1-ft intervals, rather than on specific time lines. As a
result, the projected SLR (determined from the NOAA tidal gauges) was
rounded to the nearest foot. When analyzing military installations within
40 miles of a coast for SLR in 2050, the majority of the installations (57%)
had their estimates rounded down. As a result, these estimations reflect a
level of conservatism. One challenge of this rounding is that the changes in
the landscape resulting from climate change are not fully illustrated. For
example, Fort AP Hill outside of Washington DC is expected to have 0.97
ft of SLR in 2050 and 1.44 ft in 2070. When rounding is applied, it appears
as if the installation has no changes in its SLR vulnerability.
3.5.1.3 Extent of storm surge
To determine the vulnerability of energy infrastructure to climate change,
a national dataset was developed. One limitation of this dataset is the scale
of the underlying SLR data, which was provided at National Weather Ser-
vice Weather Forecast Office (WFO) regions broken out at the state level.
In Figure 3-4, some states such as Georgia had their entire coast depicted
as a single zone, whereas Florida’s coast was broken into six separate
parts. As these layers represent the expectations for how that amount of
SLR would affect the region and it is not on a specific time scale, places in
the same region may experience the projected amount of SLR at different
times. When rounding is applied, the extent of SLR for the years 2050 and
2070 is consistent across data zones with the exception of Massachusetts.
A larger problem comes when calculating storm surge. For example, Fort
Meade and Aberdeen Proving Ground both have a greater than 50%
chance of having a 5-ft storm surge by 2050. Fort Belvoir, which is in the
same region, may experience an 8-ft surge. Determining the exact lines
where the surge levels shift is nearly impossible with the underlying data.
As a result, the averages of expected surges were calculated for each zone.
51. ERDC/CERL TR-15-24 29
Figure 3-4. SLR regions and data availability. Due to its complex coastal geography, Louisiana
is not part of the dataset.
3.5.2 Community infrastructure assumptions
3.5.2.1 Community infrastructure within 40 miles
While an installation may not be located on the coast, it may rely on
coastal ports or regional coastal infrastructure for supplies. A threshold of
40 miles was selected as it incorporates the regional dependency of an in-
stallation. The Comprehensive Evaluation of Projects with Respect to Sea
Level Change (CESL) tool, which analyzes USACE Civil Works sites’ vul-
nerability to climate change, uses a distance of 40 miles. Additionally, 40
miles is the distance used in the Army Stationing and Installation Plan
(ASIP) to capture those who live off-base and commute. Therefore, the 40-
mile threshold may be used to capture the community and infrastructure
that service members are presumed to rely on. Finally, a 40-mile threshold
recognizes that installations are situated within regions, and depend on
the surrounding region for services and will be affected by what occurs
within the region.
52. ERDC/CERL TR-15-24 30
3.5.2.2 Community infrastructure location
To calculate the community infrastructure at risk of destruction from SLR,
inland flooding, and storm surge, point data from the Homeland Security
Infrastructure Program (HSIP) Gold 2012 dataset representing the ad-
dresses of community infrastructure were obtained. These data simply
represent the X-Y location of a site and do not account for building size or
multiple buildings on a property (i.e., a school campus with multiple build-
ings). A school’s street address may not be located in an area that is sus-
ceptible to flooding while in actuality a large portion of the facility may be
located within a flood zone. Rather than selecting infrastructure located
directly in a flood zone, the infrastructure located within 300 ft of the
flood hazard was selected. An obvious limitation of this method is a lack of
elevation data since an address may be located within 300 ft of flooding,
but is directly uphill and therefore does not risk being flooded.
3.5.2.3 Summary of infrastructure at risk nationally
Flooding—whether from SLR, storm surges, or inland flooding events—
will affect infrastructure surrounding U.S. Army installations. Table B-1
(in Appendix B to this report, p 101) summarizes the categories of infra-
structure at risk of destruction for Army installations nationally. The ma-
jority of the infrastructure identified in this analysis as “at risk” are non-
emergency community services such as churches, nursing homes, daycare
centers, libraries, and public schools. While exact percentages vary be-
tween scenarios, they comprise about 70% of the total infrastructure at
risk. This large percentage of the total risk is understandable as many
communities will have many of these service facilities. This analysis uses a
percent of infrastructure at risk, which creates a bias toward certain facil-
ity types (like churches and daycares) that are more commonly located
within communities.
Table 3-1 lists community infrastructure nationally that is at risk of SLR
and flooding. The table demonstrates that more non-essential facilities will
be affected than essential services. However, the disruption of certain fa-
cilities like electricity generation plants or fire stations will have tremen-
dous impacts on an installation and its region.