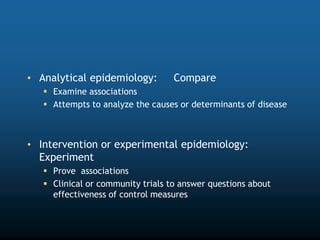
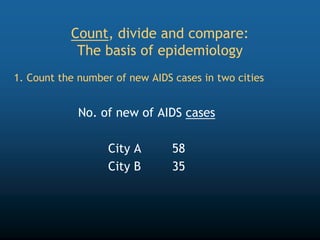
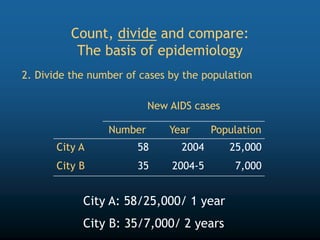
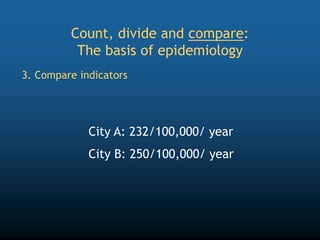
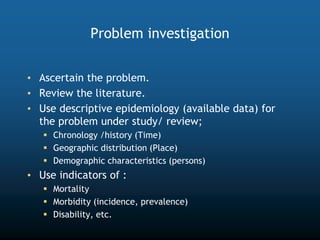
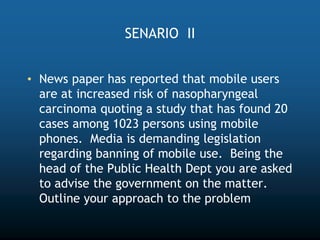
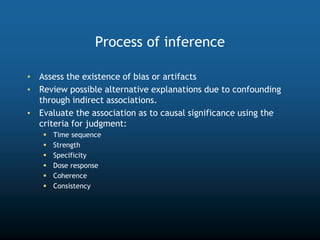
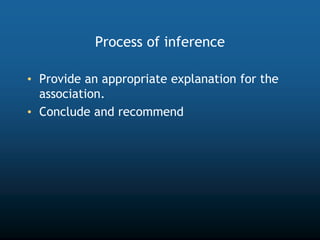
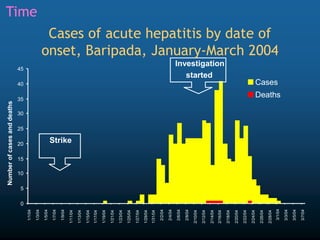
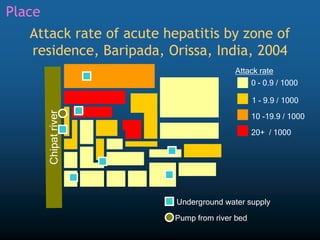
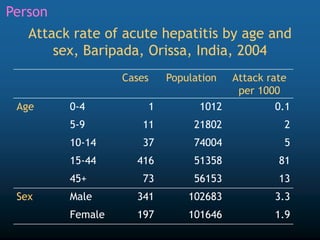
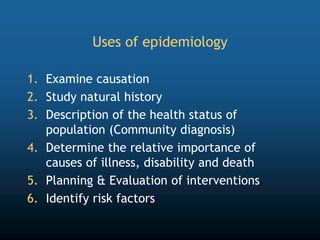
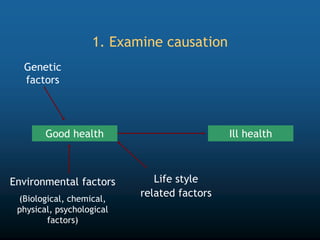
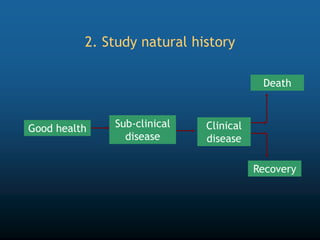
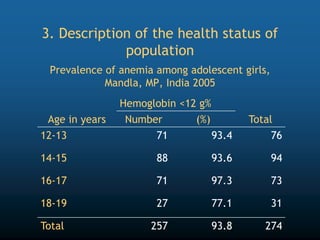
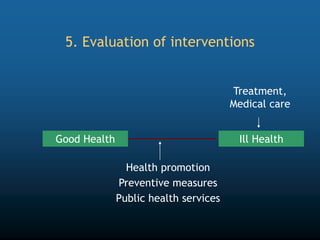
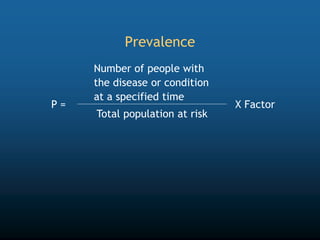
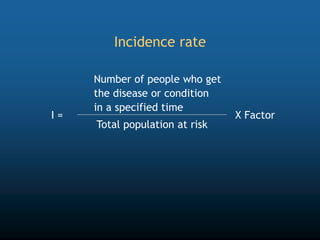
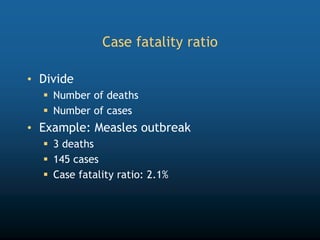
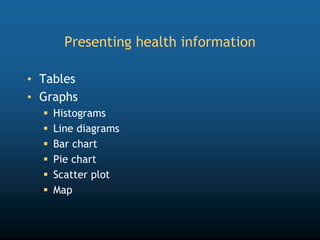
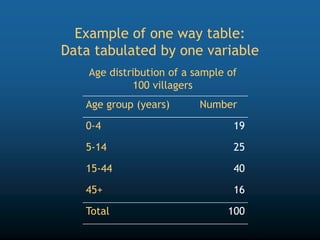
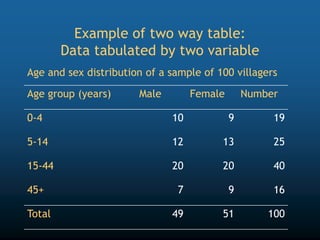
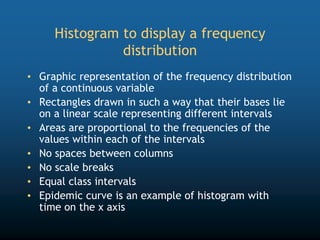
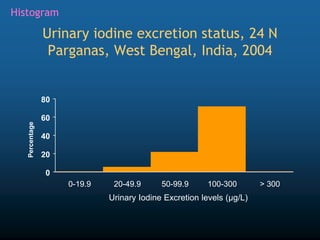
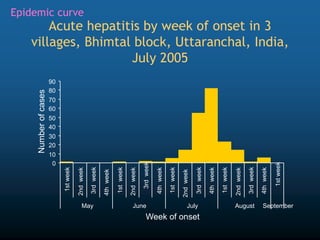
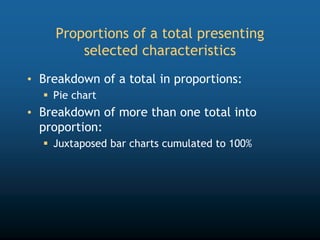
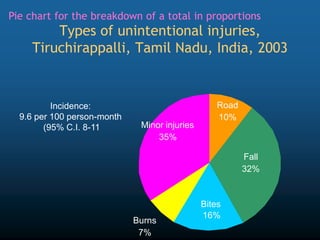
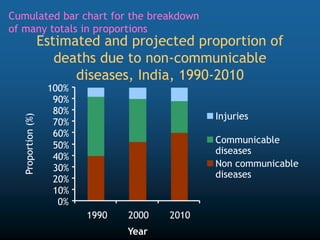
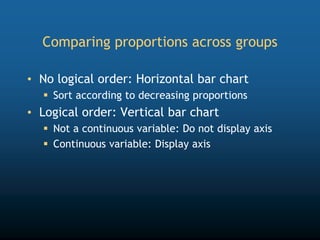
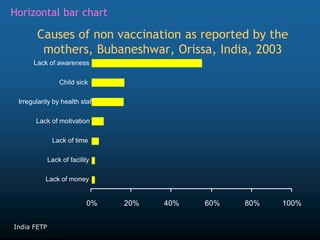
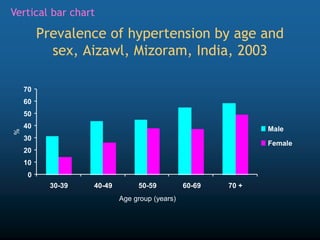
Epidemiological approach
Dr D Dutt
Professor
• John Snow (1813-1853)
• London Cholera epidemic 1854
• Broad street pump
• 32 Years before discovery of V. cholerae
Definition of epidemiology
Epidemiology is the study of the distribution
and determinants of health-related events or
states in population groups and the application
of this study to the control of health problems
(Last JM ed. Dictionary of Epidemiology, Oxford University Press, 1995)
Comparing the job of a clinician
and the job of an epidemiologist
The clinician
• Deals with patients
• Takes a history
• Conducts a physical
• Makes a diagnosis
• Proposes a treatment
• Follows up the patient
The epidemiologist
• Deals with populations
• Frames the question
• Investigates
• Draws conclusions
• Gives recommendations
• Evaluates programmes
Epidemiolgy
• Events do not occur due to chance
• Definition ( Quoted by Morris) : “a means of
learning or asking questions ..and getting
answers that leads to more questions.
• When- where-whom –why-how- so what?
Reasoning
Previous to scientific revolution (17th Century)
• Logic
• Philosophy
Scientific method
• Observation
• Measurement
• Experimentation
Epidemiological approach
• Hypothetical deductive reasoning
1. Theory /observation
2. Review existing information
3. Define/refine hypothesis
4. Design study
5. Collect and analyze data
6. Test hypothesis
7. Formulate conclusion
Epidemiological approach
• Descriptive epidemiology: Ask questions
 What is the problem?
 Who is involved? ( Person)
 Where does the problem occurs? (Place)
 When does the problem occurs? (Person)
• Analytical epidemiology: Compare
 Examine associations
 Attempts to analyze the causes or determinants of disease
• Intervention or experimental epidemiology:
Experiment
 Prove associations
 Clinical or community trials to answer questions about
effectiveness of control measures
Count, divide and compare:
The basis of epidemiology
1. Count the number of new AIDS cases in two cities
No. of new of AIDS cases
City A 58
City B 35
New AIDS cases
Number Year Population
City A 58 2004 25,000
City B 35 2004-5 7,000
2. Divide the number of cases by the population
City A: 58/25,000/ 1 year
City B: 35/7,000/ 2 years
Count, divide and compare:
The basis of epidemiology
City A: 232/100,000/ year
City B: 250/100,000/ year
3. Compare indicators
Count, divide and compare:
The basis of epidemiology
Agent host, environment
VECTOR
AGENT
HOST ENVIRONMENT
Biologic,
Chemical,
Physical (injury, trauma)
Social
Psychological
Genotype
Nutrition
Immunity
Behaviour
Sanitation
Weather
Pollution
Socio-Cultural
Political
• Related to health action
SENARIO I
• The EMR Dept has instructed you to
investigate a rumor of increased cases of
blindness in infants in 2 districts in Uttar
Pradesh . It is being thought that possibly it
is arsenic toxicity while in utero that has
caused the blindness. Discuss the way you
will approach the problem and investigate
Problem investigation
• Ascertain the problem.
• Review the literature.
• Use descriptive epidemiology (available data) for
the problem under study/ review;
 Chronology /history (Time)
 Geographic distribution (Place)
 Demographic characteristics (persons)
• Use indicators of :
 Mortality
 Morbidity (incidence, prevalence)
 Disability, etc.
• General a hyphothesis.
• Test the hypothesis using analytic designs:
 Cross – sectional
 Case – control
 Cohort
• Design Experiment in animals /humans if
possible
• Draw conclusions and take action
SENARIO II
• News paper has reported that mobile users
are at increased risk of nasopharyngeal
carcinoma quoting a study that has found 20
cases among 1023 persons using mobile
phones. Media is demanding legislation
regarding banning of mobile use. Being the
head of the Public Health Dept you are asked
to advise the government on the matter.
Outline your approach to the problem
Process of inference
• Assess the existence of bias or artifacts
• Review possible alternative explanations due to confounding
through indirect associations.
• Evaluate the association as to causal significance using the
criteria for judgment:
 Time sequence
 Strength
 Specificity
 Dose response
 Coherence
 Consistency
Process of inference
• Provide an appropriate explanation for the
association.
• Conclude and recommend
SENARIO III
• Several persons have died due to diarrhea
dehydration in your district. Investigate the
possibility of a cholera epidemic .
Approach to investigating an epidemic
• Define the problem. What is the etiologic
agent?/confirm the diagnosis. Is it an
epidemic?
• Appraise existing data. Determine the date
and hour of onset; make an epidemic curve.
Prepare a spot map of cases; consider home,
work and places of recreation and special
meetings. Where did exposure occur?
Calculate attack rates if possible.
• Formulate a hypothesis.
• Test the hypothesis. Search for added cases;
evaluate all of the data
• Draw conclusions and devise practical
applications. Write a report. Undertake
long-term surveillance and prevention.
The basic principles of
descriptive epidemiology
• Time
 When did the event happen?
• Place
 Where did the event happen?
• Person
 Who was affected?
0
5
10
15
20
25
30
35
40
45
1/1/04
1/3/04
1/5/04
1/7/04
1/9/04
1/11/04
1/13/04
1/15/04
1/17/04
1/19/04
1/21/04
1/23/04
1/25/04
1/27/04
1/29/04
1/31/04
2/2/04
2/4/04
2/6/04
2/8/04
2/10/04
2/12/04
2/14/04
2/16/04
2/18/04
2/20/04
2/22/04
2/24/04
2/26/04
2/28/04
3/1/04
3/3/04
3/5/04
3/7/04
Number
of
cases
and
deaths
Cases
Deaths
Investigation
started
Strike
Cases of acute hepatitis by date of
onset, Baripada, January-March 2004
Time
Attack rate of acute hepatitis by zone of
residence, Baripada, Orissa, India, 2004
0 - 0.9 / 1000
1 - 9.9 / 1000
10 -19.9 / 1000
20+ / 1000
Attack rate
Underground water supply
Pump from river bed
Place
Attack rate of acute hepatitis by age and
sex, Baripada, Orissa, India, 2004
Cases Population Attack rate
per 1000
Age 0-4 1 1012 0.1
5-9 11 21802 2
10-14 37 74004 5
15-44 416 51358 81
45+ 73 56153 13
Sex Male 341 102683 3.3
Female 197 101646 1.9
Person
Uses of epidemiology
1. Examine causation
2. Study natural history
3. Description of the health status of
population (Community diagnosis)
4. Determine the relative importance of
causes of illness, disability and death
5. Planning & Evaluation of interventions
6. Identify risk factors
1. Examine causation
Genetic
factors
Environmental factors
(Biological, chemical,
physical, psychological
factors)
Good health Ill health
Life style
related factors
2. Study natural history
Good health Sub-clinical
disease
Clinical
disease
Recovery
Death
Prevalence of anemia among adolescent girls,
Mandla, MP, India 2005
Age in years
Hemoglobin <12 g%
Total
Number (%)
12-13 71 93.4 76
14-15 88 93.6 94
16-17 71 97.3 73
18-19 27 77.1 31
Total 257 93.8 274
3. Description of the health status of
population
Disease DALYs*
(000)
Mortality
(000)
Included in IDSP
Tuberculosis 7577 421 Yes
Measles 6471 190 Yes
Malaria 577 20 Yes
* Disability-adjusted life years
4. Determine the relative importance of
causes of illness, disability and death
5. Evaluation of interventions
Good Health Ill Health
Treatment,
Medical care
Health promotion
Preventive measures
Public health services
6. Identify those sections of the
population which have the greatest risk
from specific causes of ill health
Characteristics
Univariate
odds ratio
(95% CI)
Adjusted odds
ratio
(95% CI)
Hookworm infestation 12 (5-29) 10 (4-24)
Consumption of IFA < 90 days 4.1 (2-8) 2.7 (1-7)
Education below middle school * 4 (3-7) 2.3 (1-4)
Number of pregnancy > 2 3.6 (2-6) 1.9 (1-4)
* Middle school = Seventh class in Orissa
Factors associated with
anemia among pregnant women, Orissa, 2004
= 5 / 2 = 2.5/1
A ratio places in relation two quantities
that may be unrelated
• The quotient of two numbers
• Numerator NOT necessarily INCLUDED in the
denominator
• Allows to compare quantities of different
nature
Examples of ratio
• Number of beds per doctor
 85 beds for 1 doctor
• Number of participants per facilitator
• Sex ratio:
 Male / Female
2 / 4 = 0.5=50%
A proportion measures a
subset of a total quantity
• The quotient of two numbers
• Numerator NECESSARILY INCLUDED
in the denominator
• Quantities have to be of the same nature
• Proportion always ranges between 0 and 1
• Percentage = proportion x 100
Example of proportion
• Tuberculosis cases in a district:
 400 male cases
 200 female cases
• Question
 What is the proportion of male cases among all
cases?
 What is the proportion of female cases among all
cases?
A rate measures the speed of occurrence
of health events
• The quotient of two numbers
• Defined duration of observation
• Numerator
 Number of EVENTS observed for a given time
• Denominator (includes time)
 Population at risk in which the events occur
2
----- = 0.02 / year
100
Observed in 2004
Example of rate
• Mortality rate of tetanus in country X in 1995
 Tetanus deaths: 17
 Population in 1995: 58 million
 Mortality rate = 0.029/100,000/year
• Rate may be expressed in any power of 10
 100, 1,000, 10,00, 100,000
Measures of disease frequency
• Prevalence
 Number of cases of a disease in a defined
population at specified point of time
• Incidence
 Number of new cases, episodes or events occurring
over a defined period of time
Prevalence
Number of people with
the disease or condition
at a specified time
Total population at risk
X Factor
P =
Incidence rate
Number of people who get
the disease or condition
in a specified time
Total population at risk
X Factor
I =
Case fatality ratio
• Divide
 Number of deaths
 Number of cases
• Example: Measles outbreak
 3 deaths
 145 cases
 Case fatality ratio: 2.1%
BASIC EPIDEMIOLOGY
MR. S. Hazra
Deptt. of Epidemiology
AIIH & PH
Kolkata
Presenting health information
• Tables
• Graphs
 Histograms
 Line diagrams
 Bar chart
 Pie chart
 Scatter plot
 Map
Tables
• Data presented in columns and rows by one
or more classification variable
• Title- Concise, self explanatory explaining
clearly all information being presented
• Rows and columns should be clearly labeled
• Categories should be clearly shown
Age distribution of a sample of
100 villagers
Example of one way table:
Data tabulated by one variable
Age group (years) Number
0-4 19
5-14 25
15-44 40
45+ 16
Total 100
Example of two way table:
Data tabulated by two variable
Age group (years) Male Female Number
0-4 10 9 19
5-14 12 13 25
15-44 20 20 40
45+ 7 9 16
Total 49 51 100
Age and sex distribution of a sample of 100 villagers
Graphs
• Charts based on length
• Bar charts (horizontal, vertical, grouped, stacked)
• Charts based on proportion
• Pie chart
• Geographic co-ordinate charts (maps)
• Spot map
• Area map
Malaria in Kurseong block, Darjeeling
District, West Bengal, India, 2000-2004
0
5
10
15
20
25
30
35
40
45
January
February
March
April
May
June
July
August
September
October
November
December
January
February
March
April
May
June
July
August
September
October
November
December
January
February
March
April
May
June
July
August
September
October
November
December
January
February
March
April
May
June
July
August
September
October
November
December
January
February
March
April
May
June
July
August
September
October
November
December
2000 2001 2002 2003 2004
Months
Incidence
of
malaria
per
10,000
Incidence of malaria
Incidence of Pf malaria
Line graph for time series
Histogram to display a frequency
distribution
• Graphic representation of the frequency distribution
of a continuous variable
• Rectangles drawn in such a way that their bases lie
on a linear scale representing different intervals
• Areas are proportional to the frequencies of the
values within each of the intervals
• No spaces between columns
• No scale breaks
• Equal class intervals
• Epidemic curve is an example of histogram with
time on the x axis
0
20
40
60
80
0-19.9 20-49.9 50-99.9 100-300 > 300
Urinary Iodine Excretion levels (µg/L)
Percentage
Histogram
Urinary iodine excretion status, 24 N
Parganas, West Bengal, India, 2004
Acute hepatitis by week of onset in 3
villages, Bhimtal block, Uttaranchal, India,
July 2005
0
10
20
30
40
50
60
70
80
90
1st
week
2nd
week
3rd
week
4th
week
1st
week
2nd
week
3rd
week
4th
week
1st
week
2nd
week
3rd
week
4th
week
1st
week
2nd
week
3rd
week
4th
week
1st
week
May June July August September
Week of onset
Number
of
cases
Epidemic curve
Proportions of a total presenting
selected characteristics
• Breakdown of a total in proportions:
 Pie chart
• Breakdown of more than one total into
proportion:
 Juxtaposed bar charts cumulated to 100%
Road
10%
Fall
32%
Bites
16%
Burns
7%
Minor injuries
35%
Types of unintentional injuries,
Tiruchirappalli, Tamil Nadu, India, 2003
Incidence:
9.6 per 100 person-month
(95% C.I. 8-11
Pie chart for the breakdown of a total in proportions
Estimated and projected proportion of
deaths due to non-communicable
diseases, India, 1990-2010
0%
10%
20%
30%
40%
50%
60%
70%
80%
90%
100%
1990 2000 2010
Year
Proportion
(%)
Injuries
Communicable
diseases
Non communicable
diseases
Cumulated bar chart for the breakdown
of many totals in proportions
Comparing proportions across groups
• No logical order: Horizontal bar chart
 Sort according to decreasing proportions
• Logical order: Vertical bar chart
 Not a continuous variable: Do not display axis
 Continuous variable: Display axis
Causes of non vaccination as reported by the
mothers, Bubaneshwar, Orissa, India, 2003
0% 20% 40% 60% 80% 100%
Lack of money
Lack of facility
Lack of time
Lack of motivation
Irregularity by health staff
Child sick
Lack of awareness
India FETP
Horizontal bar chart
0
10
20
30
40
50
60
70
30-39 40-49 50-59 60-69 70 +
Age group (years)
%
Male
Female
Prevalence of hypertension by age and
sex, Aizawl, Mizoram, India, 2003
Vertical bar chart
Cholera cases by residence, Kanchrapara,
N-24 Parganas, West Bengal, India, 2004
Spot map
20-49
50-99
100+
1-19
0
Attack rate per
100,000
population
Pipeline crossing
open sewage drain
Open drain
Incidence of acute hepatitis by block,
Hyderabad, AP, India, March-June 2005
Hypothesis generated:
Blocks with hepatitis are those
supplied by pipelines crossing
open sewage drains
Incidence by area

Epidemiological approach 03.ppt for mbbs students

  • 1.
  • 3.
    • John Snow(1813-1853) • London Cholera epidemic 1854 • Broad street pump • 32 Years before discovery of V. cholerae
  • 4.
    Definition of epidemiology Epidemiologyis the study of the distribution and determinants of health-related events or states in population groups and the application of this study to the control of health problems (Last JM ed. Dictionary of Epidemiology, Oxford University Press, 1995)
  • 5.
    Comparing the jobof a clinician and the job of an epidemiologist The clinician • Deals with patients • Takes a history • Conducts a physical • Makes a diagnosis • Proposes a treatment • Follows up the patient The epidemiologist • Deals with populations • Frames the question • Investigates • Draws conclusions • Gives recommendations • Evaluates programmes
  • 6.
    Epidemiolgy • Events donot occur due to chance • Definition ( Quoted by Morris) : “a means of learning or asking questions ..and getting answers that leads to more questions. • When- where-whom –why-how- so what?
  • 7.
    Reasoning Previous to scientificrevolution (17th Century) • Logic • Philosophy Scientific method • Observation • Measurement • Experimentation
  • 8.
    Epidemiological approach • Hypotheticaldeductive reasoning 1. Theory /observation 2. Review existing information 3. Define/refine hypothesis 4. Design study 5. Collect and analyze data 6. Test hypothesis 7. Formulate conclusion
  • 9.
    Epidemiological approach • Descriptiveepidemiology: Ask questions  What is the problem?  Who is involved? ( Person)  Where does the problem occurs? (Place)  When does the problem occurs? (Person)
  • 10.
    • Analytical epidemiology:Compare  Examine associations  Attempts to analyze the causes or determinants of disease • Intervention or experimental epidemiology: Experiment  Prove associations  Clinical or community trials to answer questions about effectiveness of control measures
  • 11.
    Count, divide andcompare: The basis of epidemiology 1. Count the number of new AIDS cases in two cities No. of new of AIDS cases City A 58 City B 35
  • 12.
    New AIDS cases NumberYear Population City A 58 2004 25,000 City B 35 2004-5 7,000 2. Divide the number of cases by the population City A: 58/25,000/ 1 year City B: 35/7,000/ 2 years Count, divide and compare: The basis of epidemiology
  • 13.
    City A: 232/100,000/year City B: 250/100,000/ year 3. Compare indicators Count, divide and compare: The basis of epidemiology
  • 14.
    Agent host, environment VECTOR AGENT HOSTENVIRONMENT Biologic, Chemical, Physical (injury, trauma) Social Psychological Genotype Nutrition Immunity Behaviour Sanitation Weather Pollution Socio-Cultural Political
  • 15.
    • Related tohealth action
  • 16.
    SENARIO I • TheEMR Dept has instructed you to investigate a rumor of increased cases of blindness in infants in 2 districts in Uttar Pradesh . It is being thought that possibly it is arsenic toxicity while in utero that has caused the blindness. Discuss the way you will approach the problem and investigate
  • 17.
    Problem investigation • Ascertainthe problem. • Review the literature. • Use descriptive epidemiology (available data) for the problem under study/ review;  Chronology /history (Time)  Geographic distribution (Place)  Demographic characteristics (persons) • Use indicators of :  Mortality  Morbidity (incidence, prevalence)  Disability, etc.
  • 18.
    • General ahyphothesis. • Test the hypothesis using analytic designs:  Cross – sectional  Case – control  Cohort • Design Experiment in animals /humans if possible • Draw conclusions and take action
  • 19.
    SENARIO II • Newspaper has reported that mobile users are at increased risk of nasopharyngeal carcinoma quoting a study that has found 20 cases among 1023 persons using mobile phones. Media is demanding legislation regarding banning of mobile use. Being the head of the Public Health Dept you are asked to advise the government on the matter. Outline your approach to the problem
  • 20.
    Process of inference •Assess the existence of bias or artifacts • Review possible alternative explanations due to confounding through indirect associations. • Evaluate the association as to causal significance using the criteria for judgment:  Time sequence  Strength  Specificity  Dose response  Coherence  Consistency
  • 21.
    Process of inference •Provide an appropriate explanation for the association. • Conclude and recommend
  • 22.
    SENARIO III • Severalpersons have died due to diarrhea dehydration in your district. Investigate the possibility of a cholera epidemic .
  • 23.
    Approach to investigatingan epidemic • Define the problem. What is the etiologic agent?/confirm the diagnosis. Is it an epidemic? • Appraise existing data. Determine the date and hour of onset; make an epidemic curve. Prepare a spot map of cases; consider home, work and places of recreation and special meetings. Where did exposure occur? Calculate attack rates if possible.
  • 24.
    • Formulate ahypothesis. • Test the hypothesis. Search for added cases; evaluate all of the data • Draw conclusions and devise practical applications. Write a report. Undertake long-term surveillance and prevention.
  • 25.
    The basic principlesof descriptive epidemiology • Time  When did the event happen? • Place  Where did the event happen? • Person  Who was affected?
  • 26.
  • 27.
    Attack rate ofacute hepatitis by zone of residence, Baripada, Orissa, India, 2004 0 - 0.9 / 1000 1 - 9.9 / 1000 10 -19.9 / 1000 20+ / 1000 Attack rate Underground water supply Pump from river bed Place
  • 28.
    Attack rate ofacute hepatitis by age and sex, Baripada, Orissa, India, 2004 Cases Population Attack rate per 1000 Age 0-4 1 1012 0.1 5-9 11 21802 2 10-14 37 74004 5 15-44 416 51358 81 45+ 73 56153 13 Sex Male 341 102683 3.3 Female 197 101646 1.9 Person
  • 29.
    Uses of epidemiology 1.Examine causation 2. Study natural history 3. Description of the health status of population (Community diagnosis) 4. Determine the relative importance of causes of illness, disability and death 5. Planning & Evaluation of interventions 6. Identify risk factors
  • 30.
    1. Examine causation Genetic factors Environmentalfactors (Biological, chemical, physical, psychological factors) Good health Ill health Life style related factors
  • 31.
    2. Study naturalhistory Good health Sub-clinical disease Clinical disease Recovery Death
  • 32.
    Prevalence of anemiaamong adolescent girls, Mandla, MP, India 2005 Age in years Hemoglobin <12 g% Total Number (%) 12-13 71 93.4 76 14-15 88 93.6 94 16-17 71 97.3 73 18-19 27 77.1 31 Total 257 93.8 274 3. Description of the health status of population
  • 33.
    Disease DALYs* (000) Mortality (000) Included inIDSP Tuberculosis 7577 421 Yes Measles 6471 190 Yes Malaria 577 20 Yes * Disability-adjusted life years 4. Determine the relative importance of causes of illness, disability and death
  • 34.
    5. Evaluation ofinterventions Good Health Ill Health Treatment, Medical care Health promotion Preventive measures Public health services
  • 35.
    6. Identify thosesections of the population which have the greatest risk from specific causes of ill health Characteristics Univariate odds ratio (95% CI) Adjusted odds ratio (95% CI) Hookworm infestation 12 (5-29) 10 (4-24) Consumption of IFA < 90 days 4.1 (2-8) 2.7 (1-7) Education below middle school * 4 (3-7) 2.3 (1-4) Number of pregnancy > 2 3.6 (2-6) 1.9 (1-4) * Middle school = Seventh class in Orissa Factors associated with anemia among pregnant women, Orissa, 2004
  • 36.
    = 5 /2 = 2.5/1 A ratio places in relation two quantities that may be unrelated • The quotient of two numbers • Numerator NOT necessarily INCLUDED in the denominator • Allows to compare quantities of different nature
  • 37.
    Examples of ratio •Number of beds per doctor  85 beds for 1 doctor • Number of participants per facilitator • Sex ratio:  Male / Female
  • 38.
    2 / 4= 0.5=50% A proportion measures a subset of a total quantity • The quotient of two numbers • Numerator NECESSARILY INCLUDED in the denominator • Quantities have to be of the same nature • Proportion always ranges between 0 and 1 • Percentage = proportion x 100
  • 39.
    Example of proportion •Tuberculosis cases in a district:  400 male cases  200 female cases • Question  What is the proportion of male cases among all cases?  What is the proportion of female cases among all cases?
  • 40.
    A rate measuresthe speed of occurrence of health events • The quotient of two numbers • Defined duration of observation • Numerator  Number of EVENTS observed for a given time • Denominator (includes time)  Population at risk in which the events occur 2 ----- = 0.02 / year 100 Observed in 2004
  • 41.
    Example of rate •Mortality rate of tetanus in country X in 1995  Tetanus deaths: 17  Population in 1995: 58 million  Mortality rate = 0.029/100,000/year • Rate may be expressed in any power of 10  100, 1,000, 10,00, 100,000
  • 42.
    Measures of diseasefrequency • Prevalence  Number of cases of a disease in a defined population at specified point of time • Incidence  Number of new cases, episodes or events occurring over a defined period of time
  • 43.
    Prevalence Number of peoplewith the disease or condition at a specified time Total population at risk X Factor P =
  • 44.
    Incidence rate Number ofpeople who get the disease or condition in a specified time Total population at risk X Factor I =
  • 45.
    Case fatality ratio •Divide  Number of deaths  Number of cases • Example: Measles outbreak  3 deaths  145 cases  Case fatality ratio: 2.1%
  • 46.
    BASIC EPIDEMIOLOGY MR. S.Hazra Deptt. of Epidemiology AIIH & PH Kolkata
  • 47.
    Presenting health information •Tables • Graphs  Histograms  Line diagrams  Bar chart  Pie chart  Scatter plot  Map
  • 48.
    Tables • Data presentedin columns and rows by one or more classification variable • Title- Concise, self explanatory explaining clearly all information being presented • Rows and columns should be clearly labeled • Categories should be clearly shown
  • 49.
    Age distribution ofa sample of 100 villagers Example of one way table: Data tabulated by one variable Age group (years) Number 0-4 19 5-14 25 15-44 40 45+ 16 Total 100
  • 50.
    Example of twoway table: Data tabulated by two variable Age group (years) Male Female Number 0-4 10 9 19 5-14 12 13 25 15-44 20 20 40 45+ 7 9 16 Total 49 51 100 Age and sex distribution of a sample of 100 villagers
  • 51.
    Graphs • Charts basedon length • Bar charts (horizontal, vertical, grouped, stacked) • Charts based on proportion • Pie chart • Geographic co-ordinate charts (maps) • Spot map • Area map
  • 52.
    Malaria in Kurseongblock, Darjeeling District, West Bengal, India, 2000-2004 0 5 10 15 20 25 30 35 40 45 January February March April May June July August September October November December January February March April May June July August September October November December January February March April May June July August September October November December January February March April May June July August September October November December January February March April May June July August September October November December 2000 2001 2002 2003 2004 Months Incidence of malaria per 10,000 Incidence of malaria Incidence of Pf malaria Line graph for time series
  • 53.
    Histogram to displaya frequency distribution • Graphic representation of the frequency distribution of a continuous variable • Rectangles drawn in such a way that their bases lie on a linear scale representing different intervals • Areas are proportional to the frequencies of the values within each of the intervals • No spaces between columns • No scale breaks • Equal class intervals • Epidemic curve is an example of histogram with time on the x axis
  • 54.
    0 20 40 60 80 0-19.9 20-49.9 50-99.9100-300 > 300 Urinary Iodine Excretion levels (µg/L) Percentage Histogram Urinary iodine excretion status, 24 N Parganas, West Bengal, India, 2004
  • 55.
    Acute hepatitis byweek of onset in 3 villages, Bhimtal block, Uttaranchal, India, July 2005 0 10 20 30 40 50 60 70 80 90 1st week 2nd week 3rd week 4th week 1st week 2nd week 3rd week 4th week 1st week 2nd week 3rd week 4th week 1st week 2nd week 3rd week 4th week 1st week May June July August September Week of onset Number of cases Epidemic curve
  • 56.
    Proportions of atotal presenting selected characteristics • Breakdown of a total in proportions:  Pie chart • Breakdown of more than one total into proportion:  Juxtaposed bar charts cumulated to 100%
  • 57.
    Road 10% Fall 32% Bites 16% Burns 7% Minor injuries 35% Types ofunintentional injuries, Tiruchirappalli, Tamil Nadu, India, 2003 Incidence: 9.6 per 100 person-month (95% C.I. 8-11 Pie chart for the breakdown of a total in proportions
  • 58.
    Estimated and projectedproportion of deaths due to non-communicable diseases, India, 1990-2010 0% 10% 20% 30% 40% 50% 60% 70% 80% 90% 100% 1990 2000 2010 Year Proportion (%) Injuries Communicable diseases Non communicable diseases Cumulated bar chart for the breakdown of many totals in proportions
  • 59.
    Comparing proportions acrossgroups • No logical order: Horizontal bar chart  Sort according to decreasing proportions • Logical order: Vertical bar chart  Not a continuous variable: Do not display axis  Continuous variable: Display axis
  • 60.
    Causes of nonvaccination as reported by the mothers, Bubaneshwar, Orissa, India, 2003 0% 20% 40% 60% 80% 100% Lack of money Lack of facility Lack of time Lack of motivation Irregularity by health staff Child sick Lack of awareness India FETP Horizontal bar chart
  • 61.
    0 10 20 30 40 50 60 70 30-39 40-49 50-5960-69 70 + Age group (years) % Male Female Prevalence of hypertension by age and sex, Aizawl, Mizoram, India, 2003 Vertical bar chart
  • 62.
    Cholera cases byresidence, Kanchrapara, N-24 Parganas, West Bengal, India, 2004 Spot map
  • 63.
    20-49 50-99 100+ 1-19 0 Attack rate per 100,000 population Pipelinecrossing open sewage drain Open drain Incidence of acute hepatitis by block, Hyderabad, AP, India, March-June 2005 Hypothesis generated: Blocks with hepatitis are those supplied by pipelines crossing open sewage drains Incidence by area