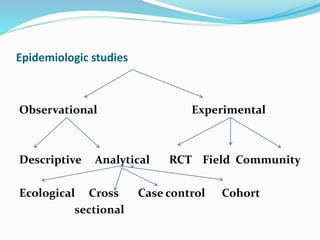
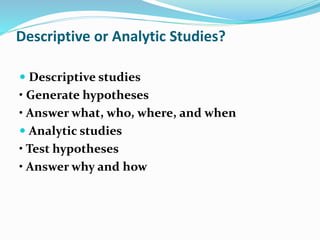
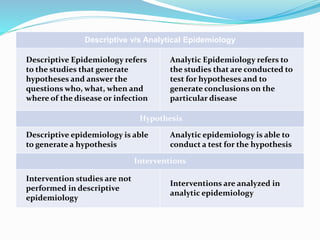
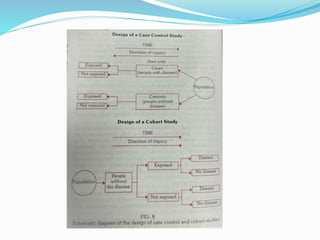
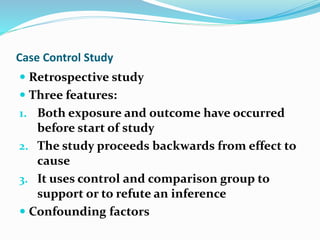
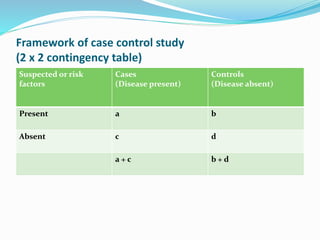
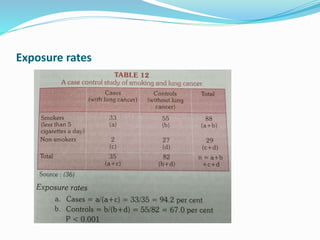
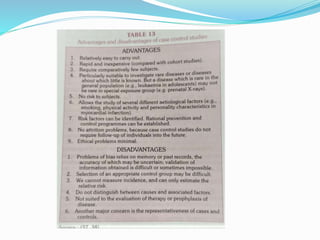
3. Descriptive or Analytic Studies?
Descriptive studies
• Generate hypotheses
• Answer what, who, where, and when
Analytic studies
• Test hypotheses
• Answer why and how
4. Descriptive v/s Analytical Epidemiology
Descriptive Epidemiology refers
to the studies that generate
hypotheses and answer the
questions who, what, when and
where of the disease or infection
Analytic Epidemiology refers to
the studies that are conducted to
test for hypotheses and to
generate conclusions on the
particular disease
Hypothesis
Descriptive epidemiology is able
to generate a hypothesis
Analytic epidemiology is able to
conduct a test for the hypothesis
Interventions
Intervention studies are not
performed in descriptive
epidemiology
Interventions are analyzed in
analytic epidemiology
5. Analytic studies
Determine:
1. Whether or not a statical association exists
between a disease and a suspected factor
2. If one exists, the strength of association
6.
7. Case Control Study
Retrospective study
Three features:
1. Both exposure and outcome have occurred
before start of study
2. The study proceeds backwards from effect to
cause
3. It uses control and comparison group to
support or to refute an inference
Confounding factors
8. Framework of case control study
(2 x 2 contingency table)
Suspected or risk
factors
Cases
(Disease present)
Controls
(Disease absent)
Present a b
Absent c d
a + c b + d
9. Basic steps
1. Selection of cases and controls
2. Matching
3. Measurement of exposure
4. Analysis and interpretation
10. Selection of cases
Definition of cases
1. Diagnostic criteria
2. Eligibility criteria
Sources of cases
1. Hospitals
2. General population
11. Selection of controls
1. Hospital controls
2. Relatives
3. Neighbourhood controls
4. General population
12. Matching
Process by which we select controls in such a
way that they are similar to cases with regards
to certain selected variables, which are known
to influence the disease And which, if not
adequately matched for comparability, could
distort or confound the result
13. Measurement of exposure
Information about exposure should be
obtained in precisely the same manner for
both cases and controls
Obtained by interviews, questionnaires or by
studying past records
14. Analysis
1. Exposure rates among cases and controls to
suspected factor
2. Estimation of disease risk associated with
exposure (ODDS ratio)
16. Frequency rate of lung cancer was definitely
higher among smokers than non smokers
Next step to ascertain statistical association by
calculating p-value
For discrete variable : Chi-square test
For continuous variable : standard error of
difference between two means
17. If p value is less than or equal to 0.05, regards
as “statistically significant”
Smaller the p value, the greater the
significance or probability that association is
not due to chance only
18. Estimation of risk
Incidence among exposed
Relative risk =
Incidence among non exposed
But not used in case control study
19. Odds ratio (Cross product ratio)
Closely related to relative risk
Derivation of Odds ratio is based on 3
assumptions:
1. Disease being investigated must be relatively
rare
2. Cases must be representative of those with
the disease
3. Controls must be representative of those
without the disease
20. Odds ratio = ad / bc
8.1
Interpretation: smokers having 8.1 times
higher risk than non smokers
21. Bias in case control studies
Due to confounding: removed by matching
Memory or recall bias
Selection bias
Berkesonian bias: arises because of the
different rates of admission to hospitals for
people with different diseases
Interviewer bias: removed by double blinding