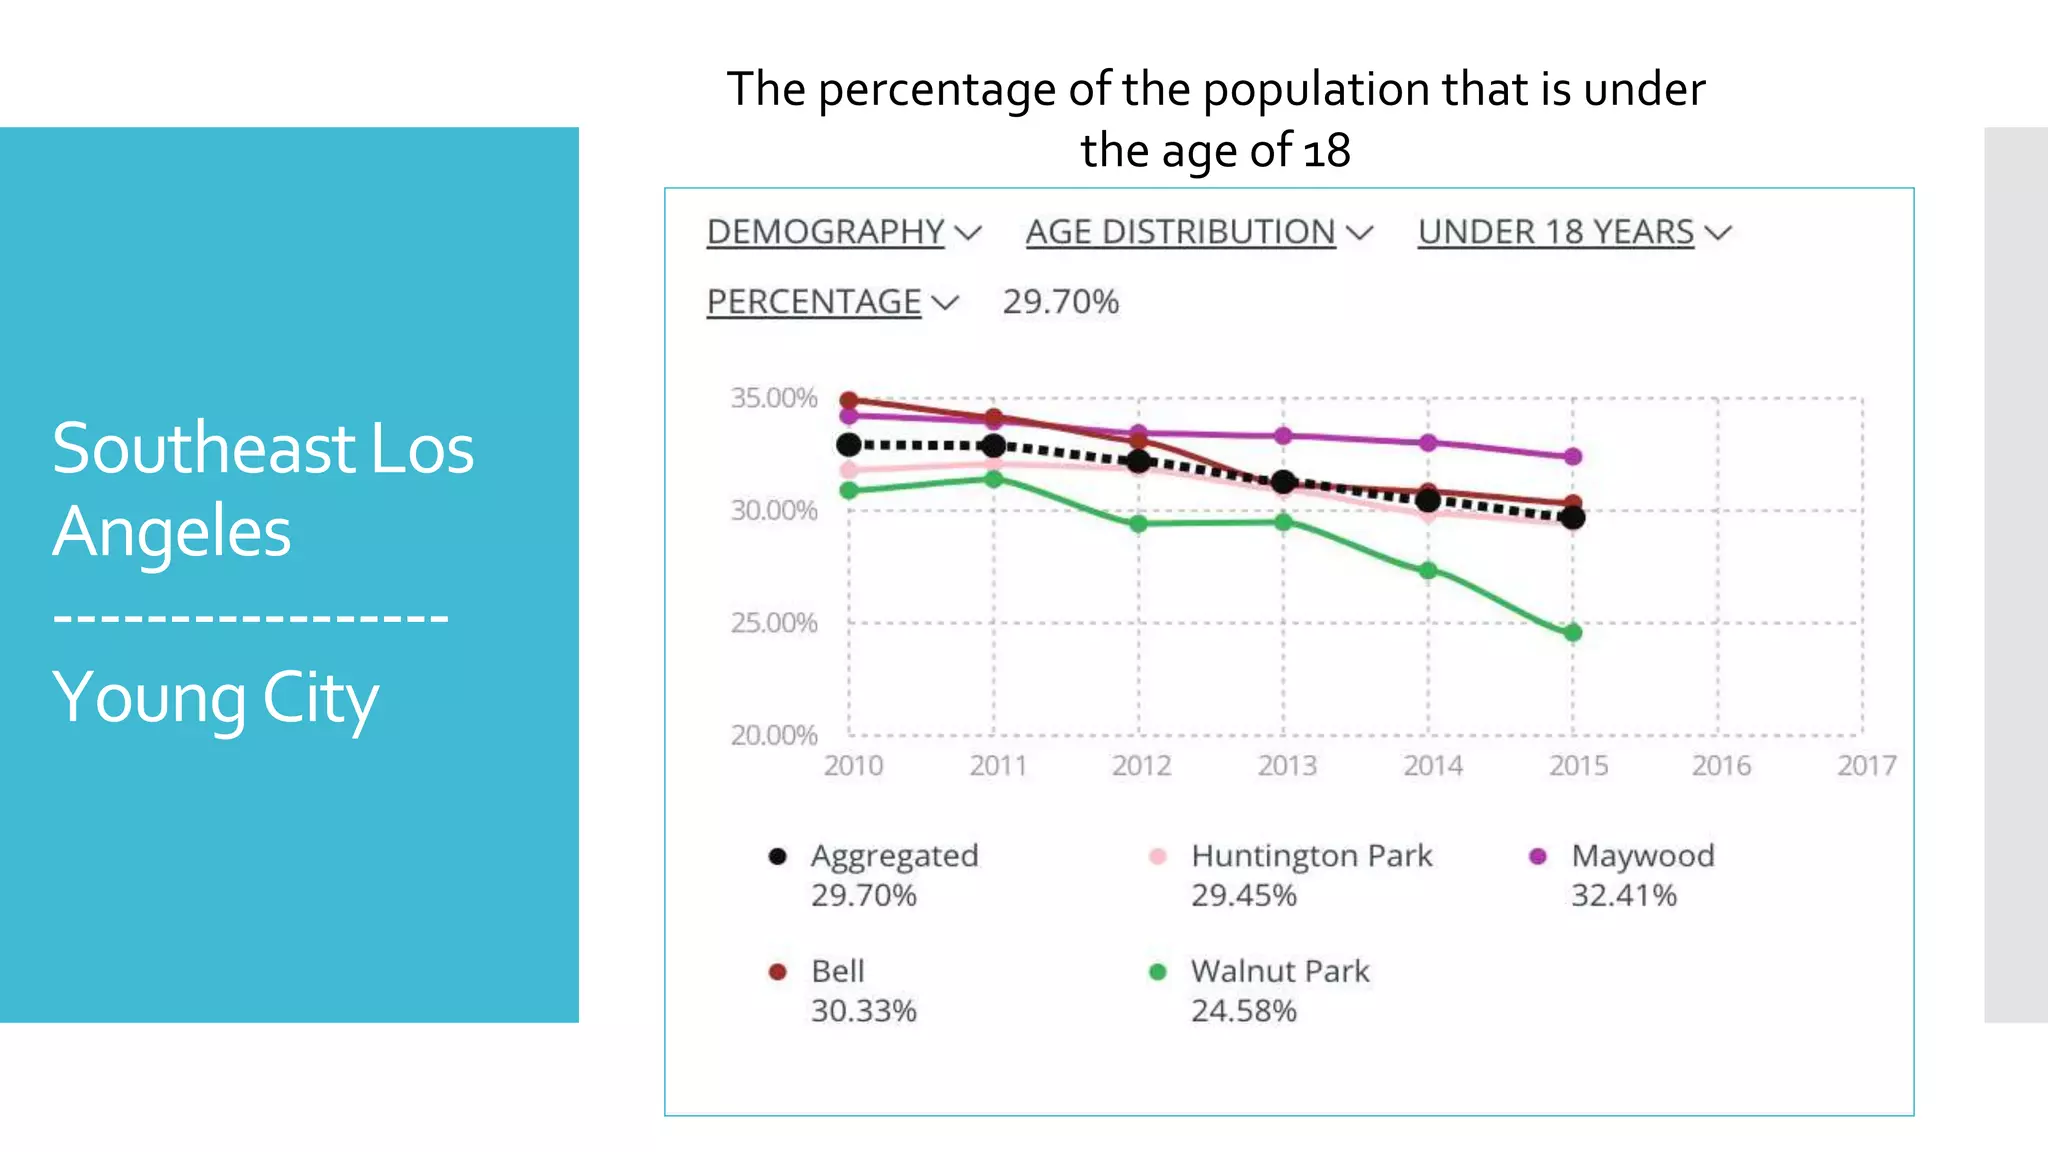
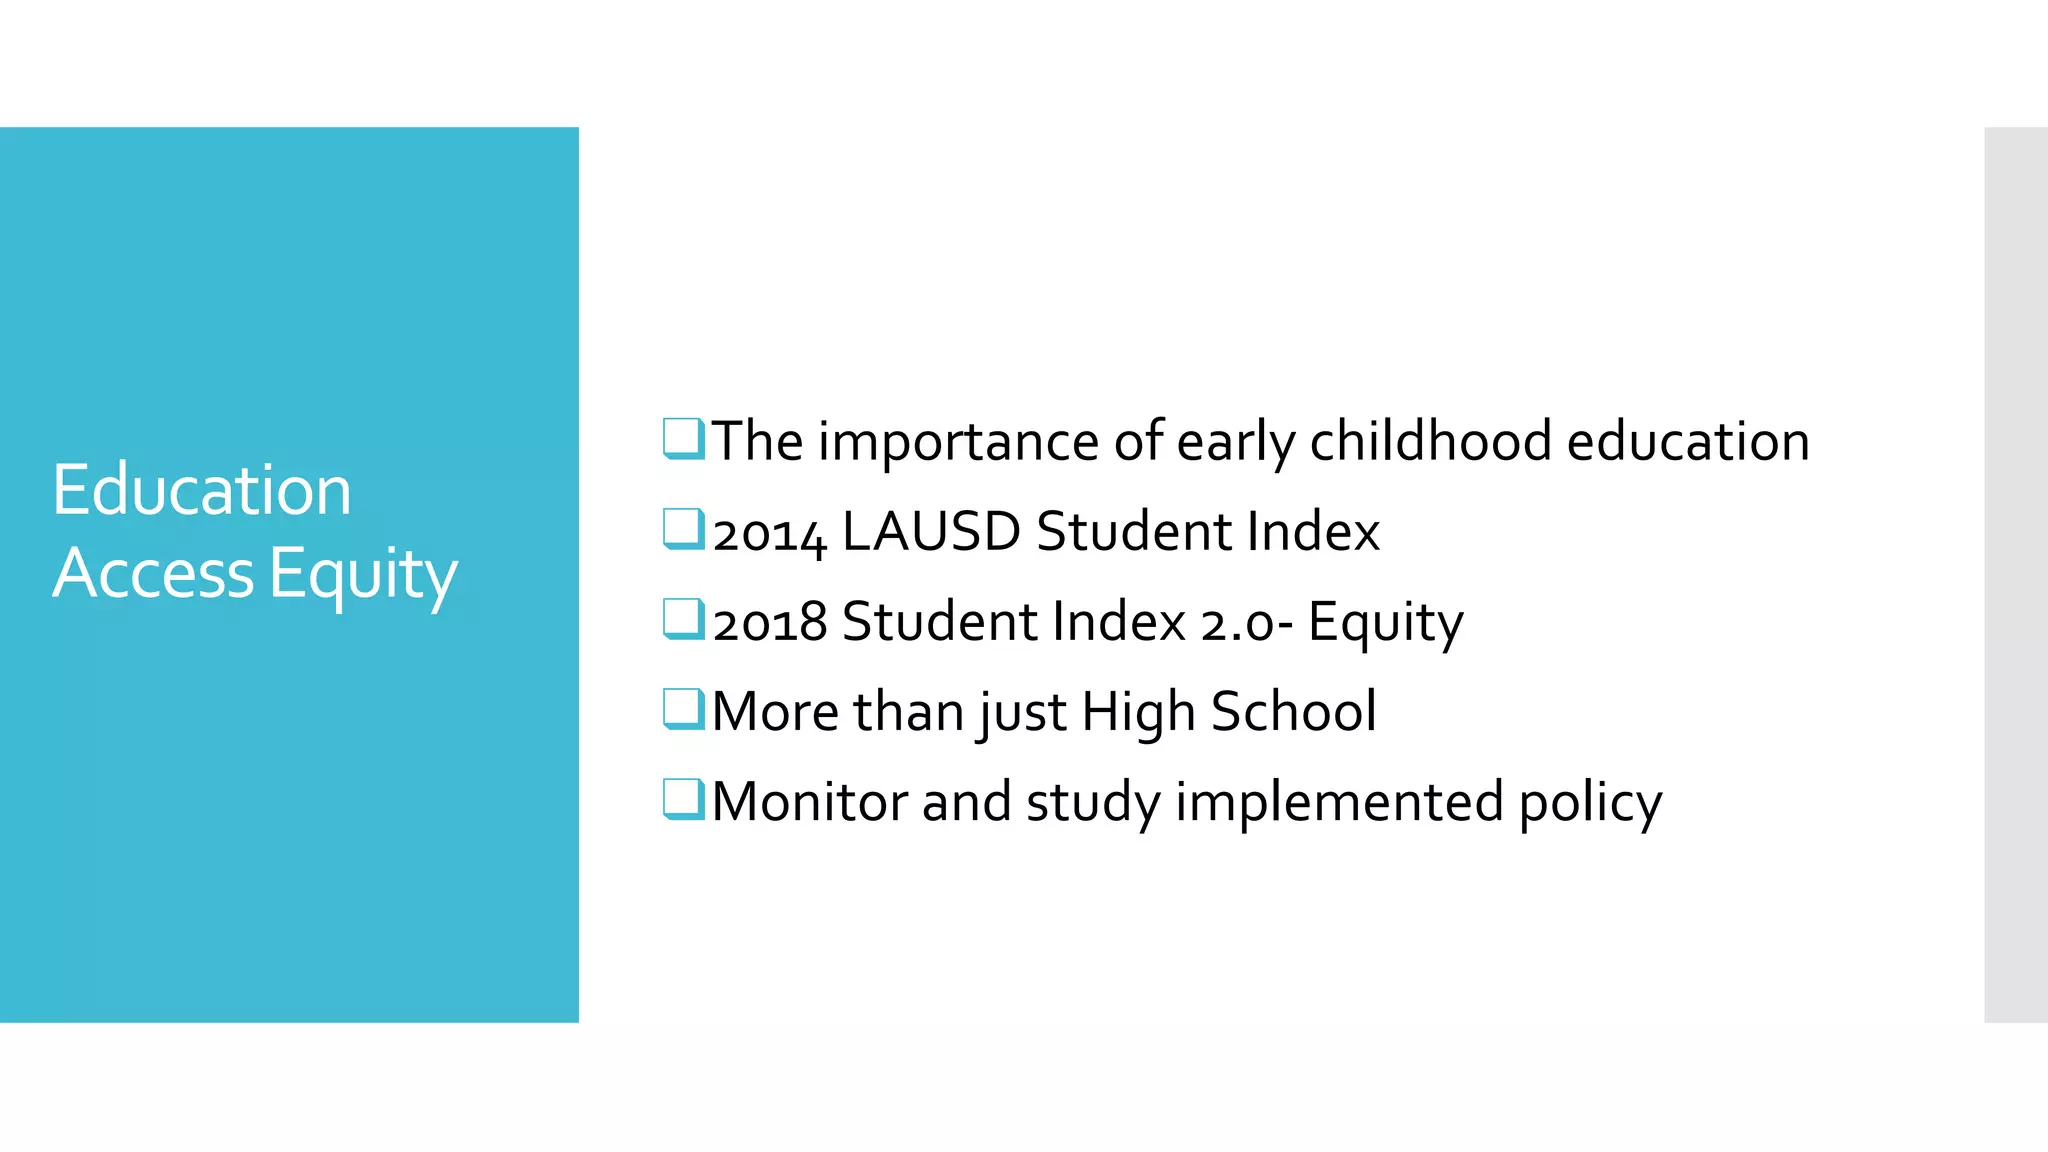
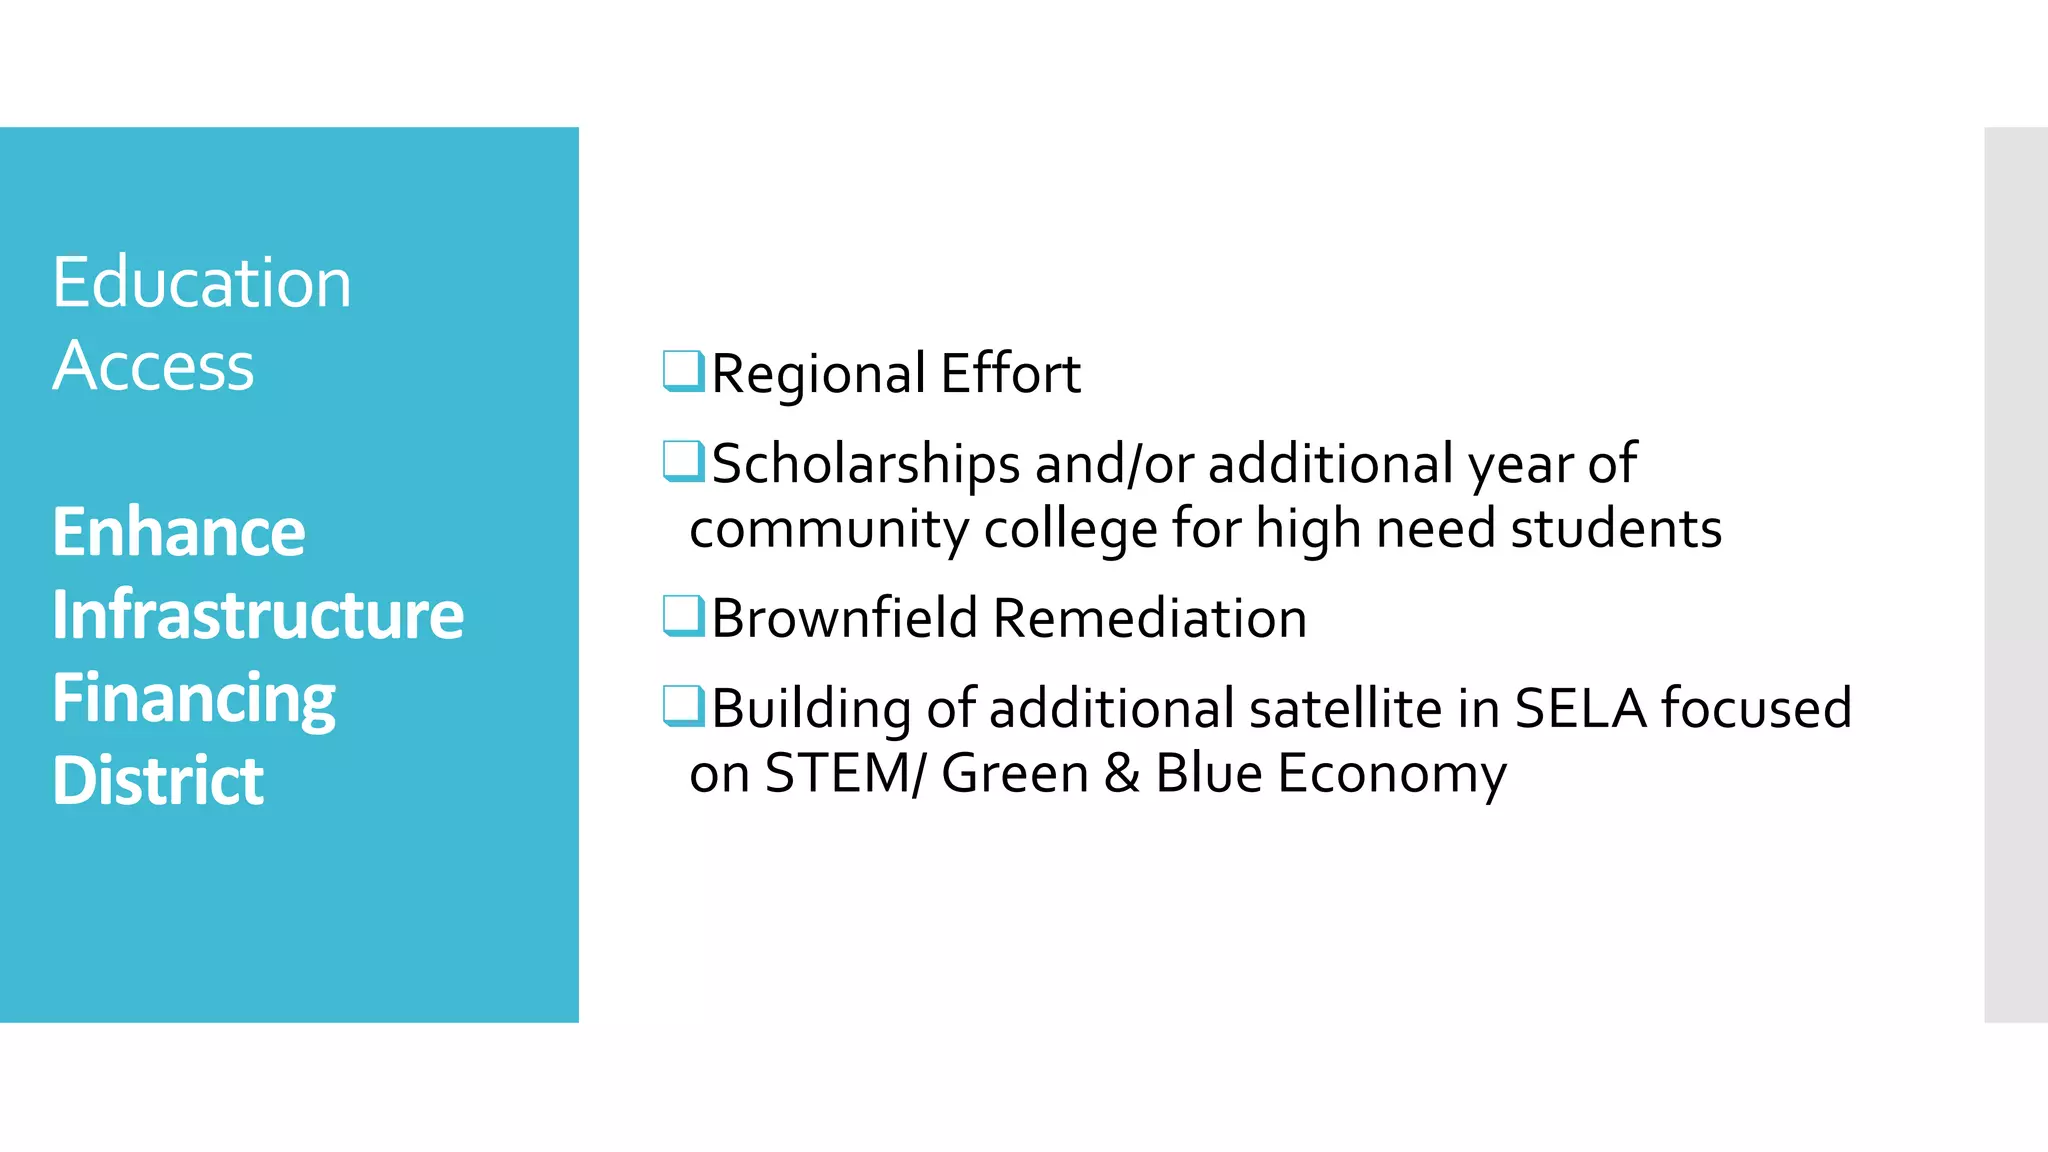
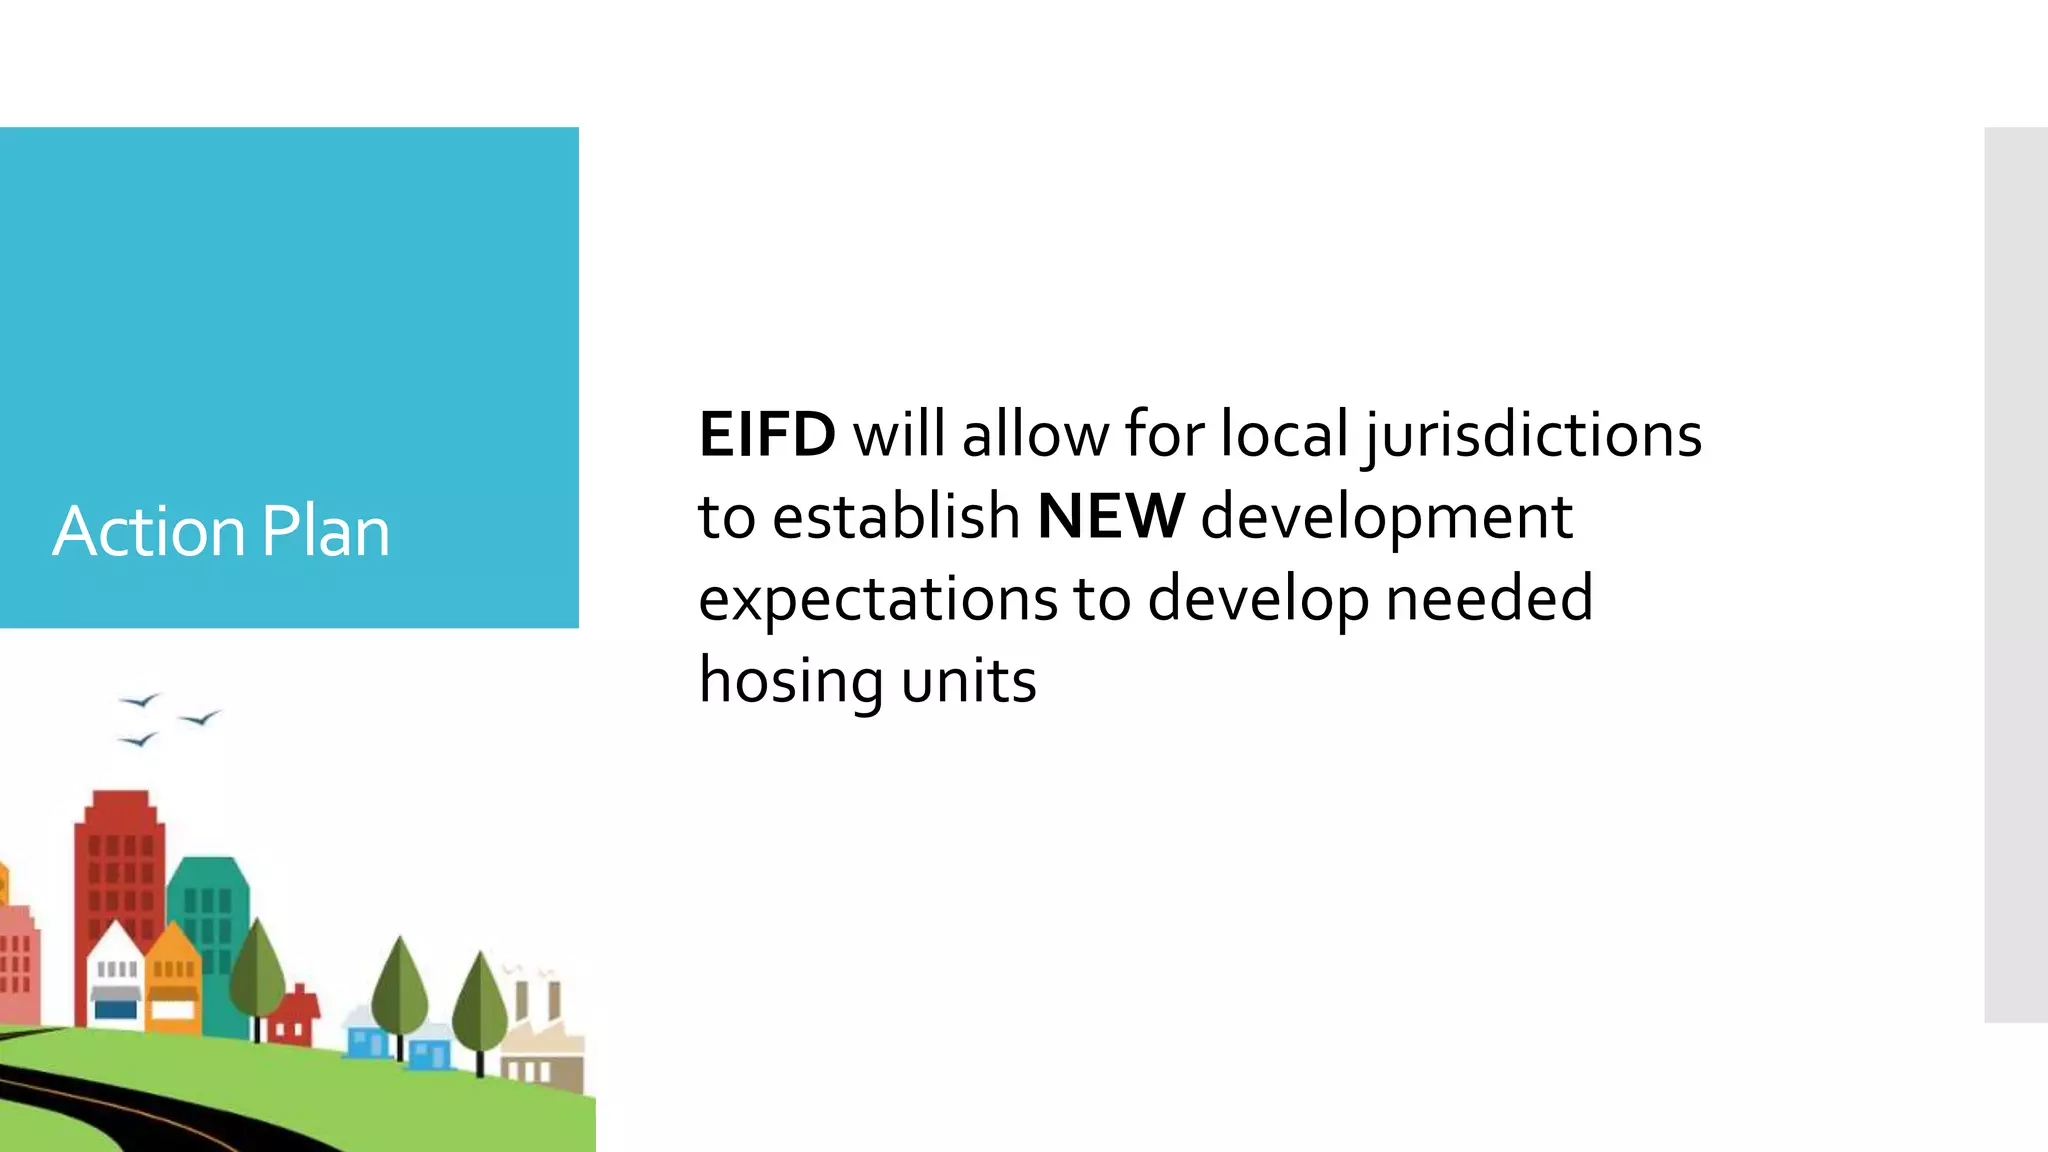
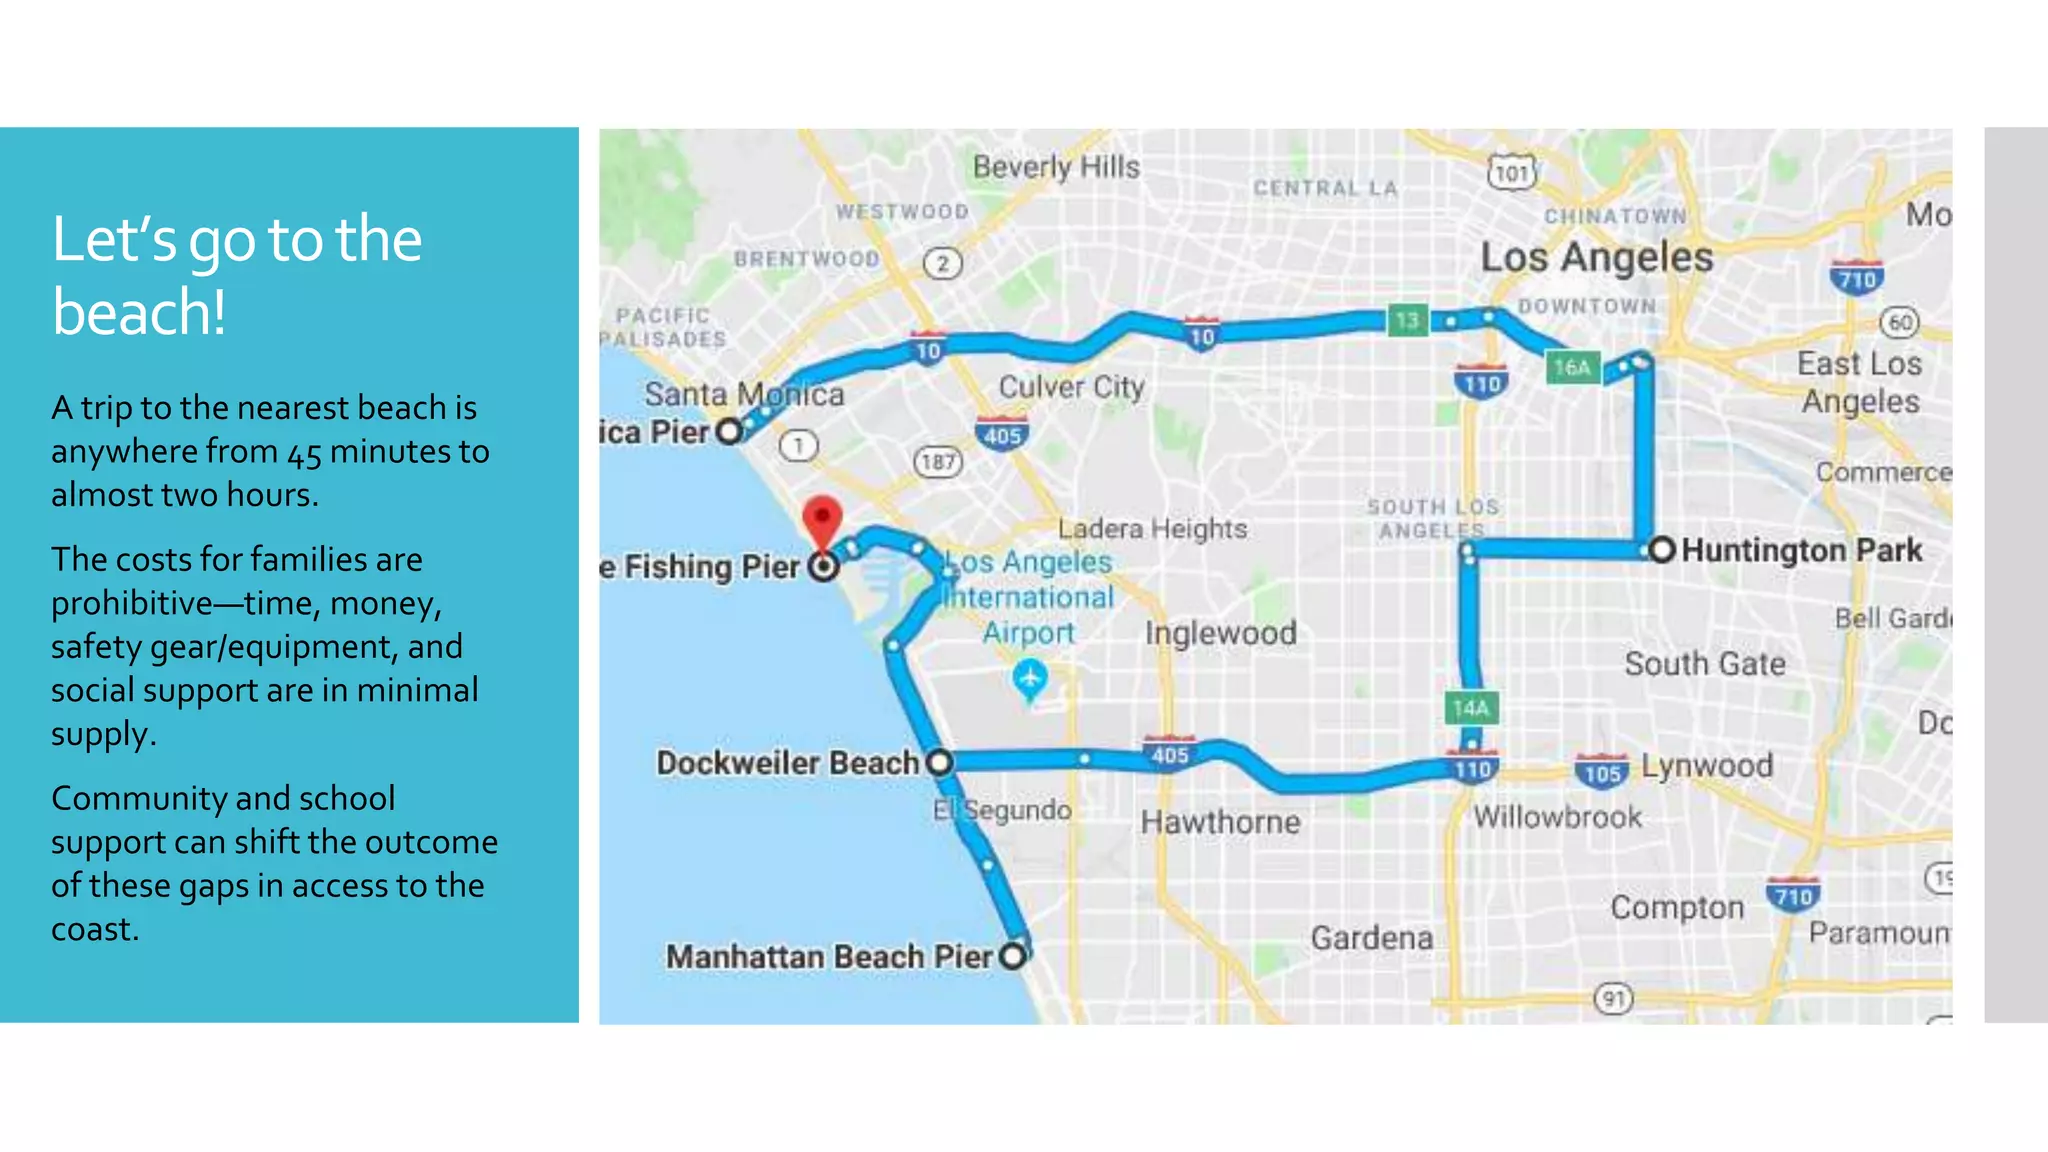
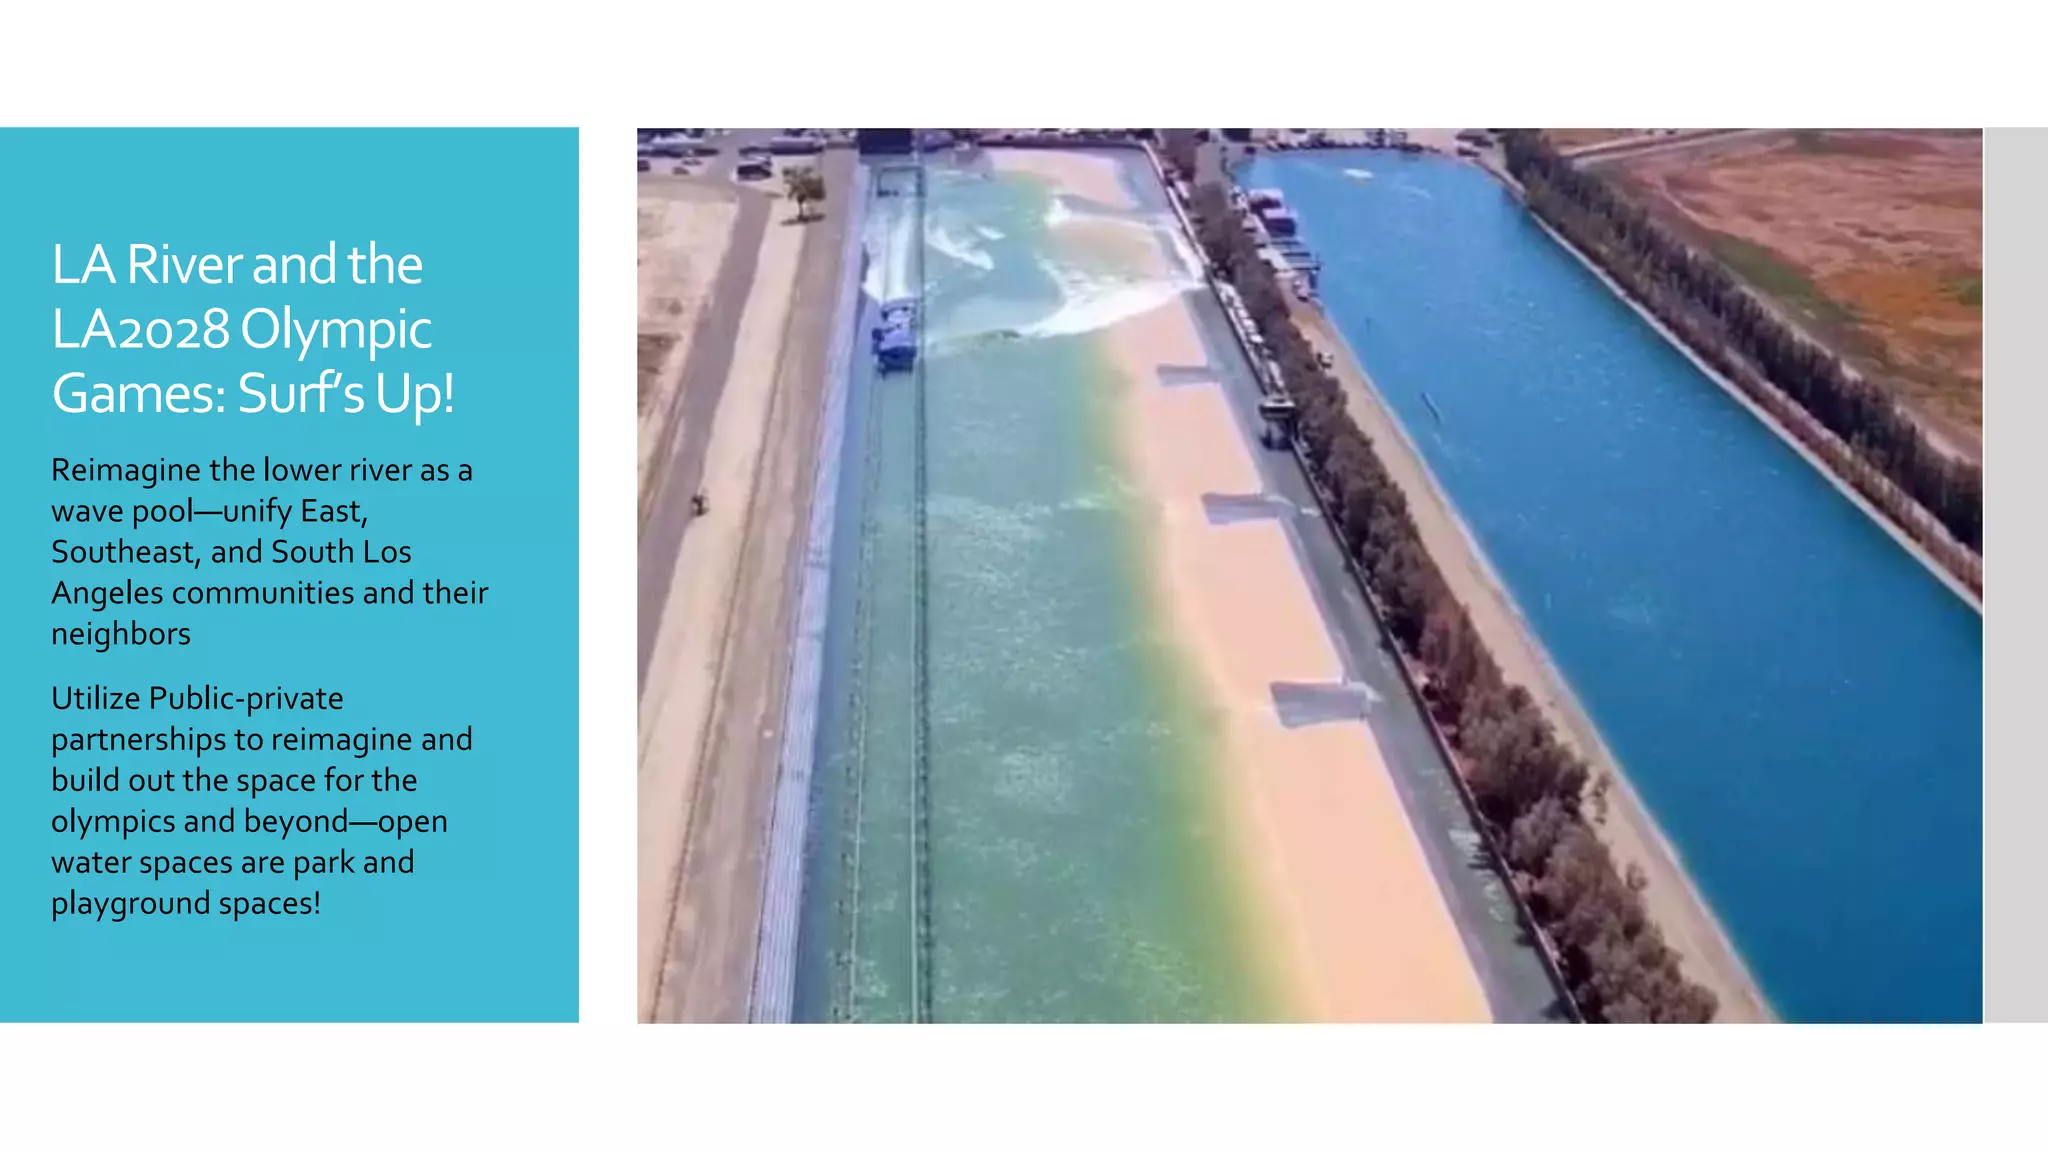
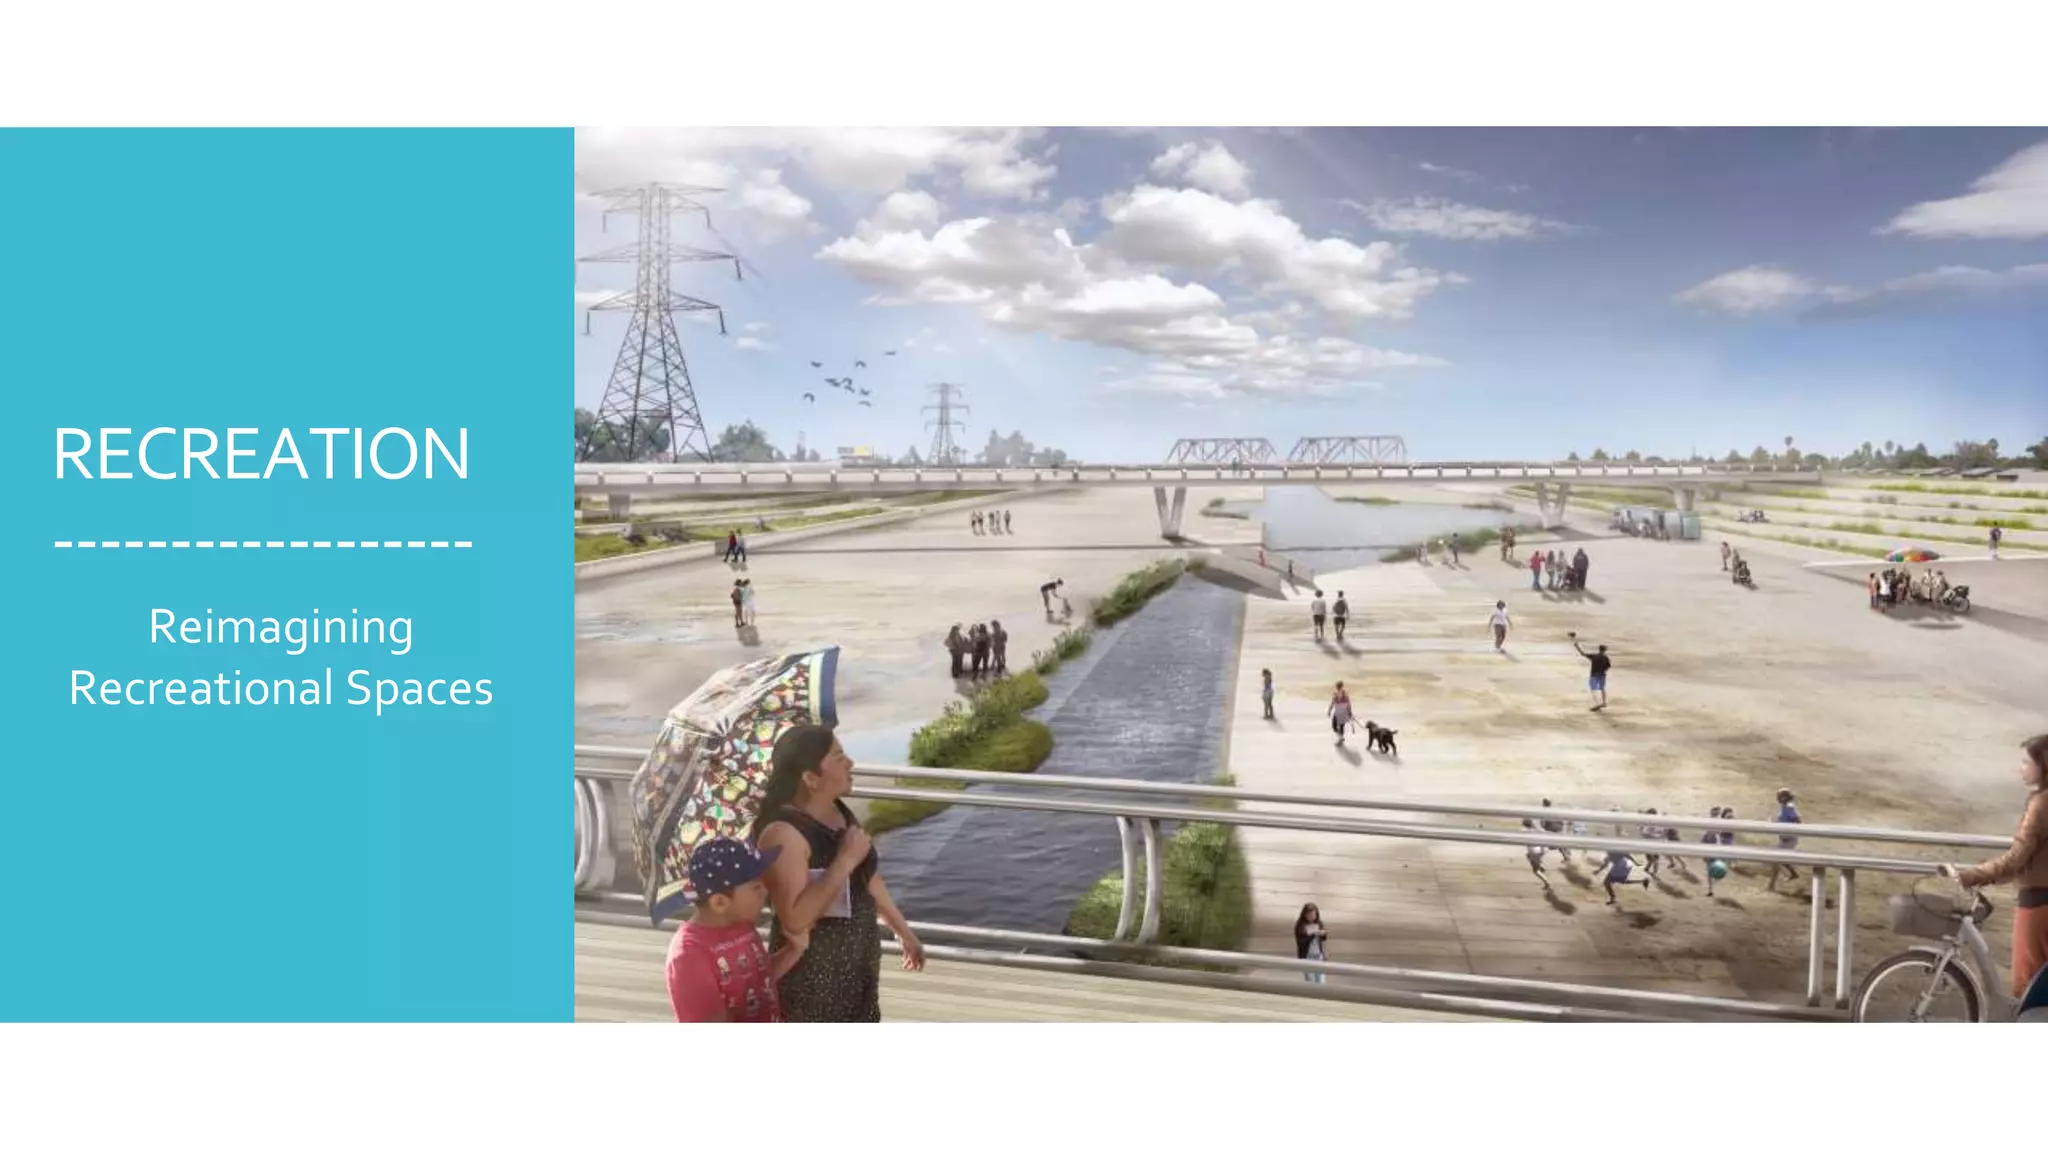
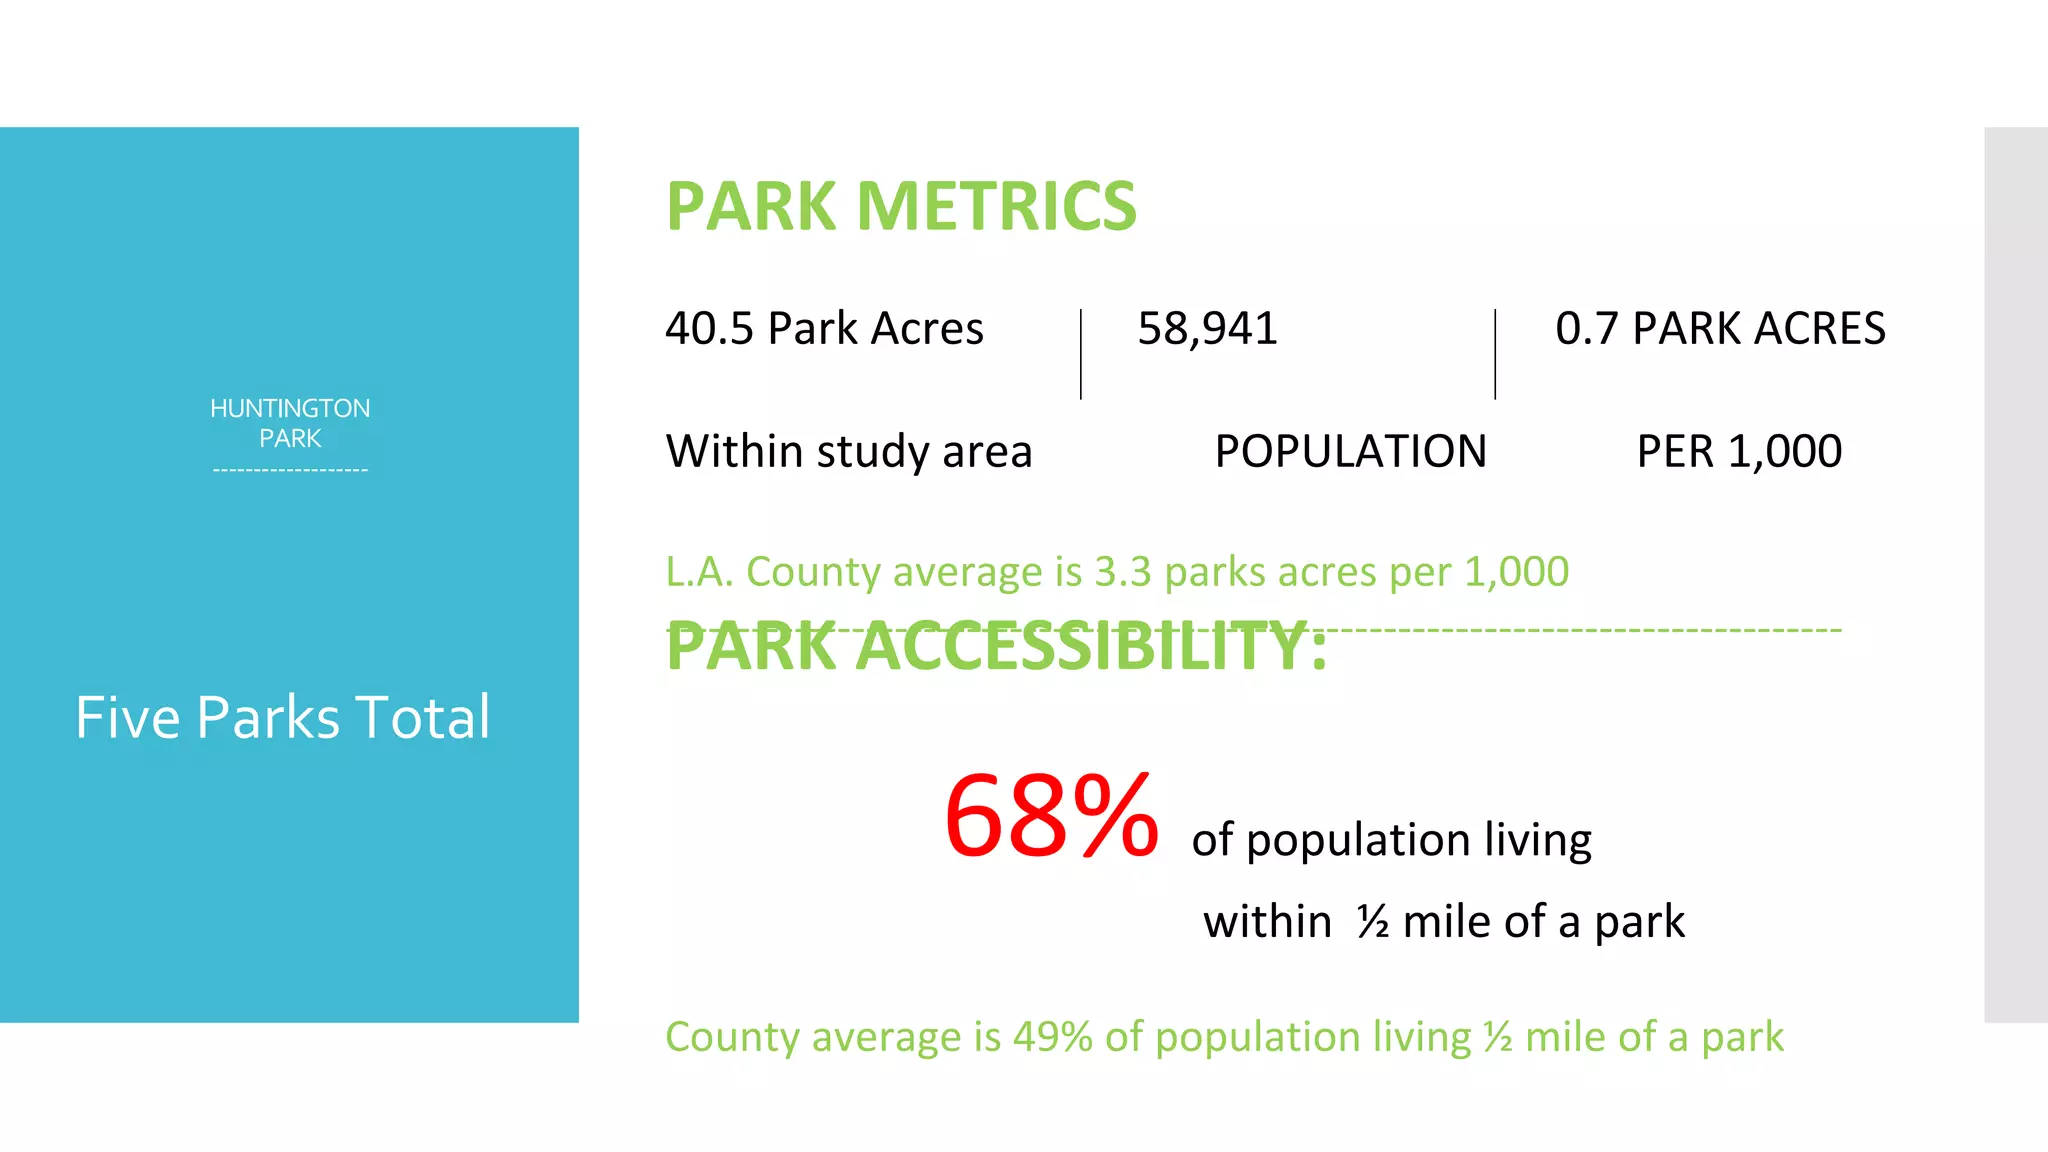
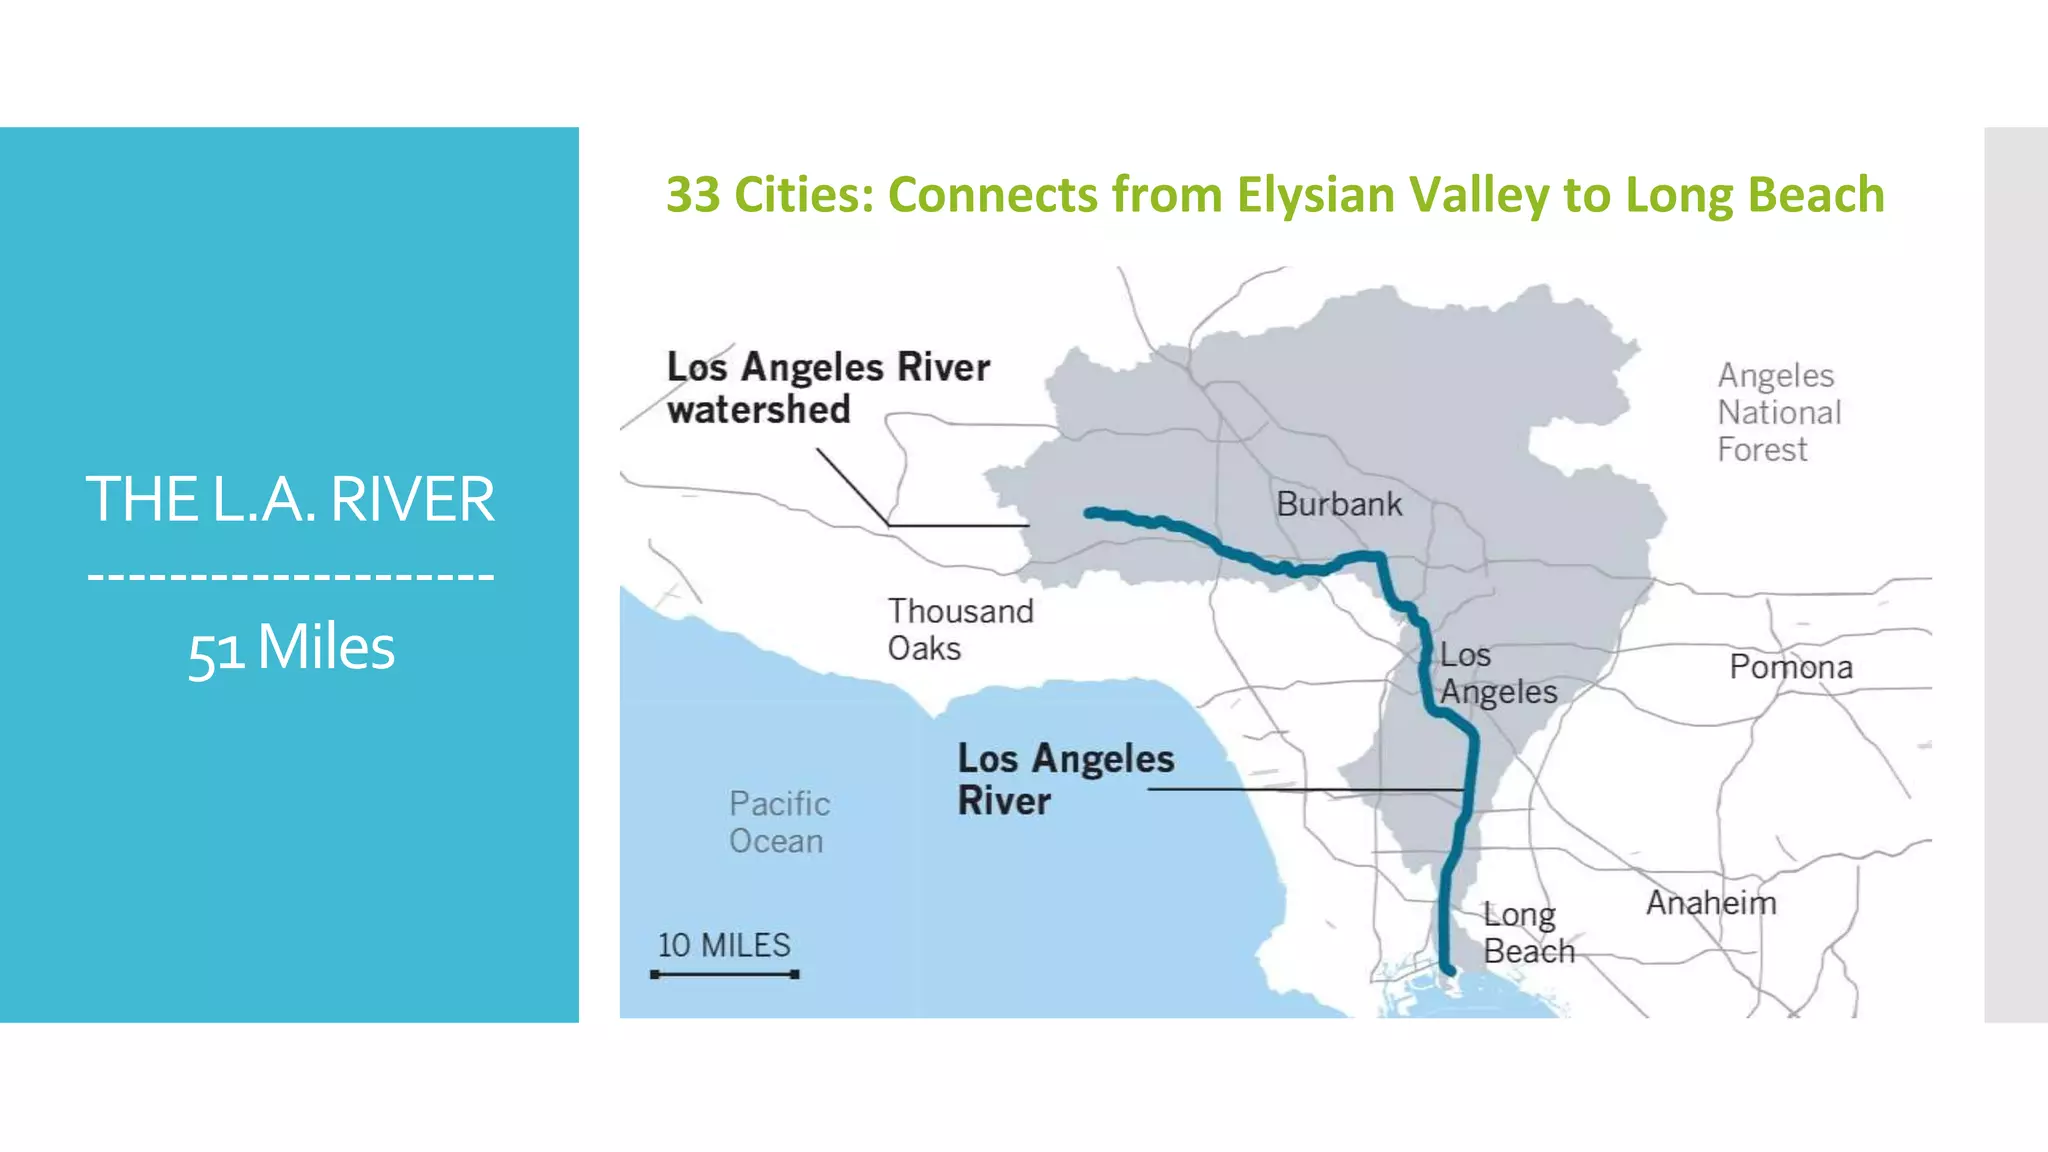
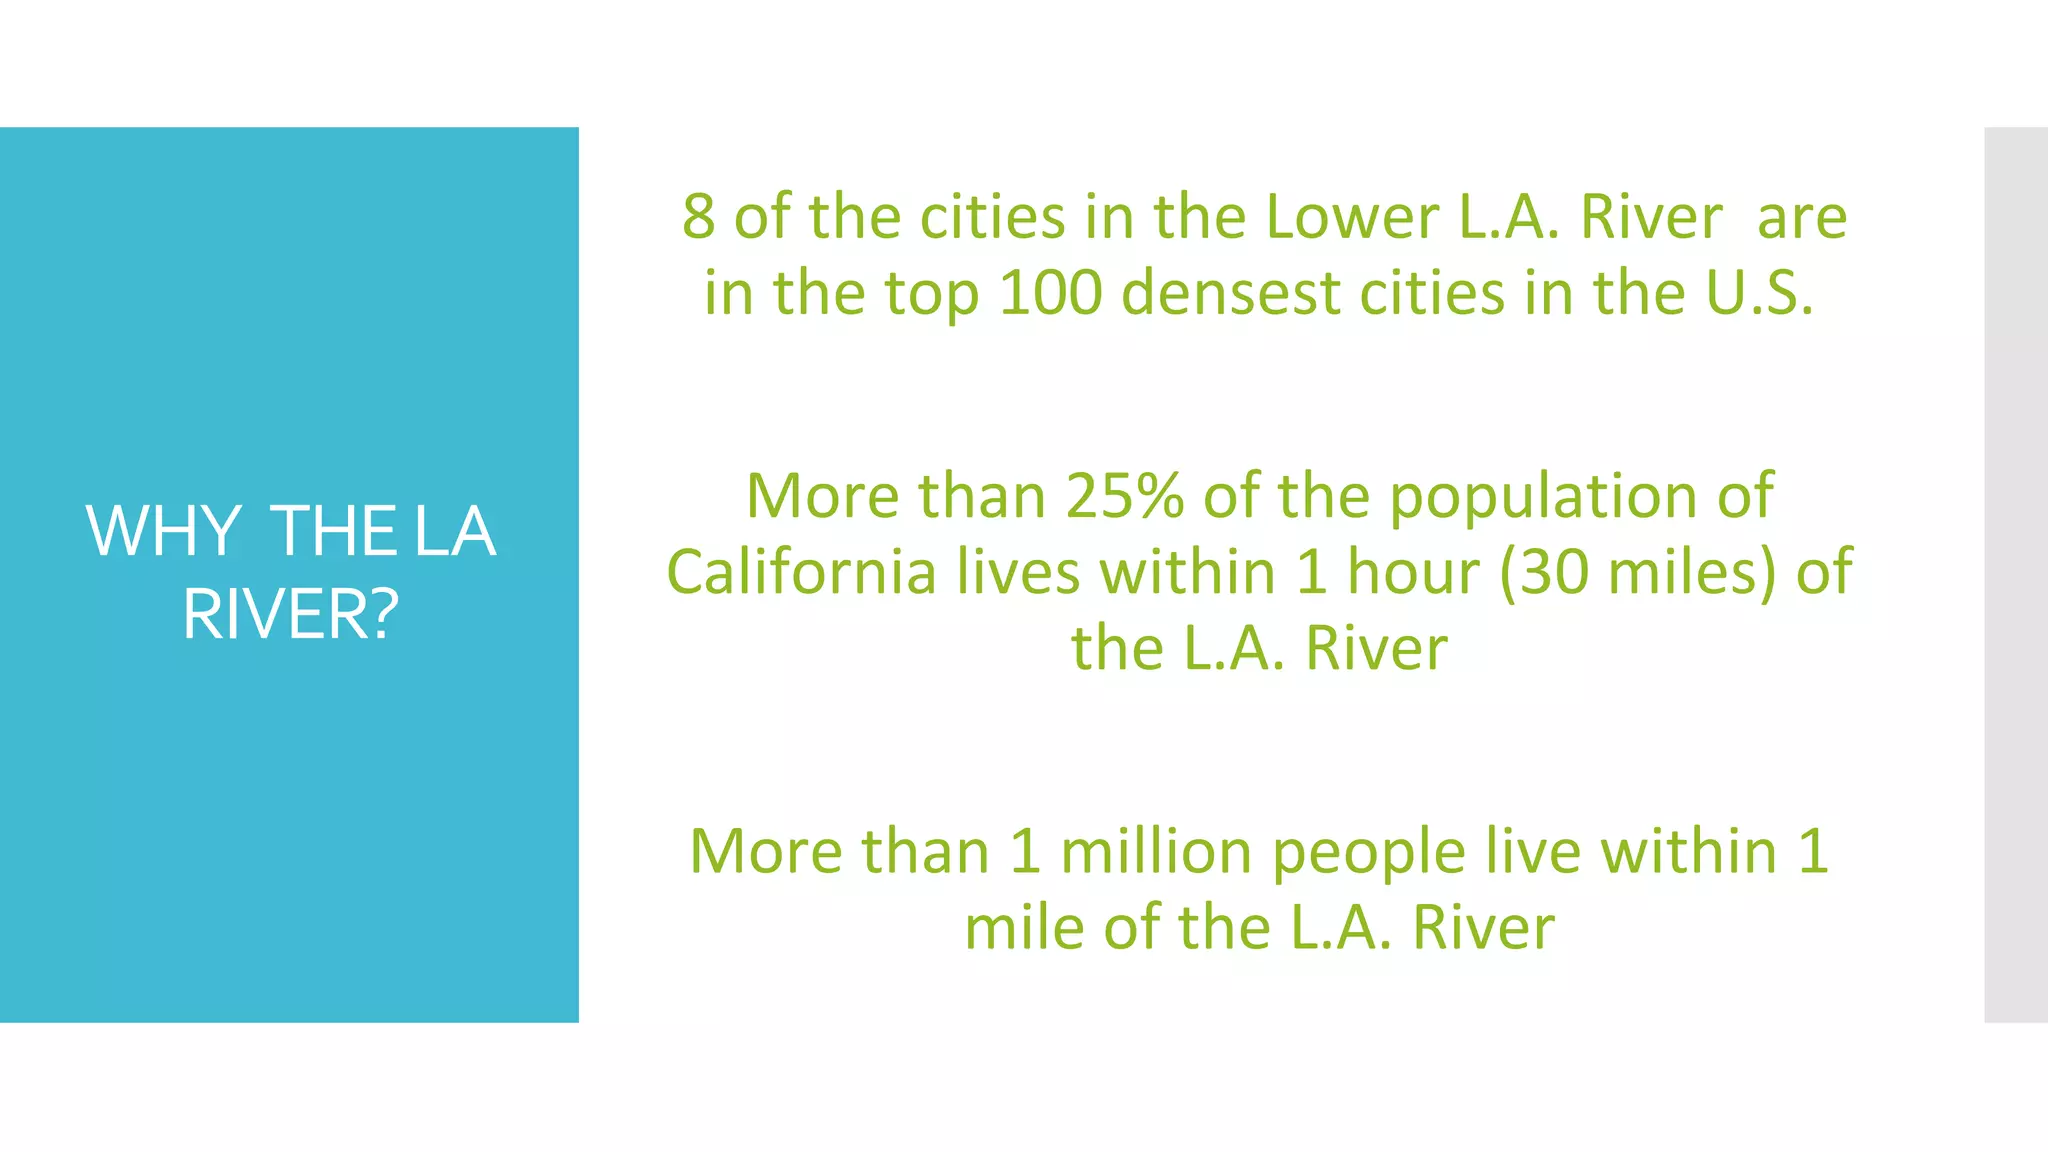
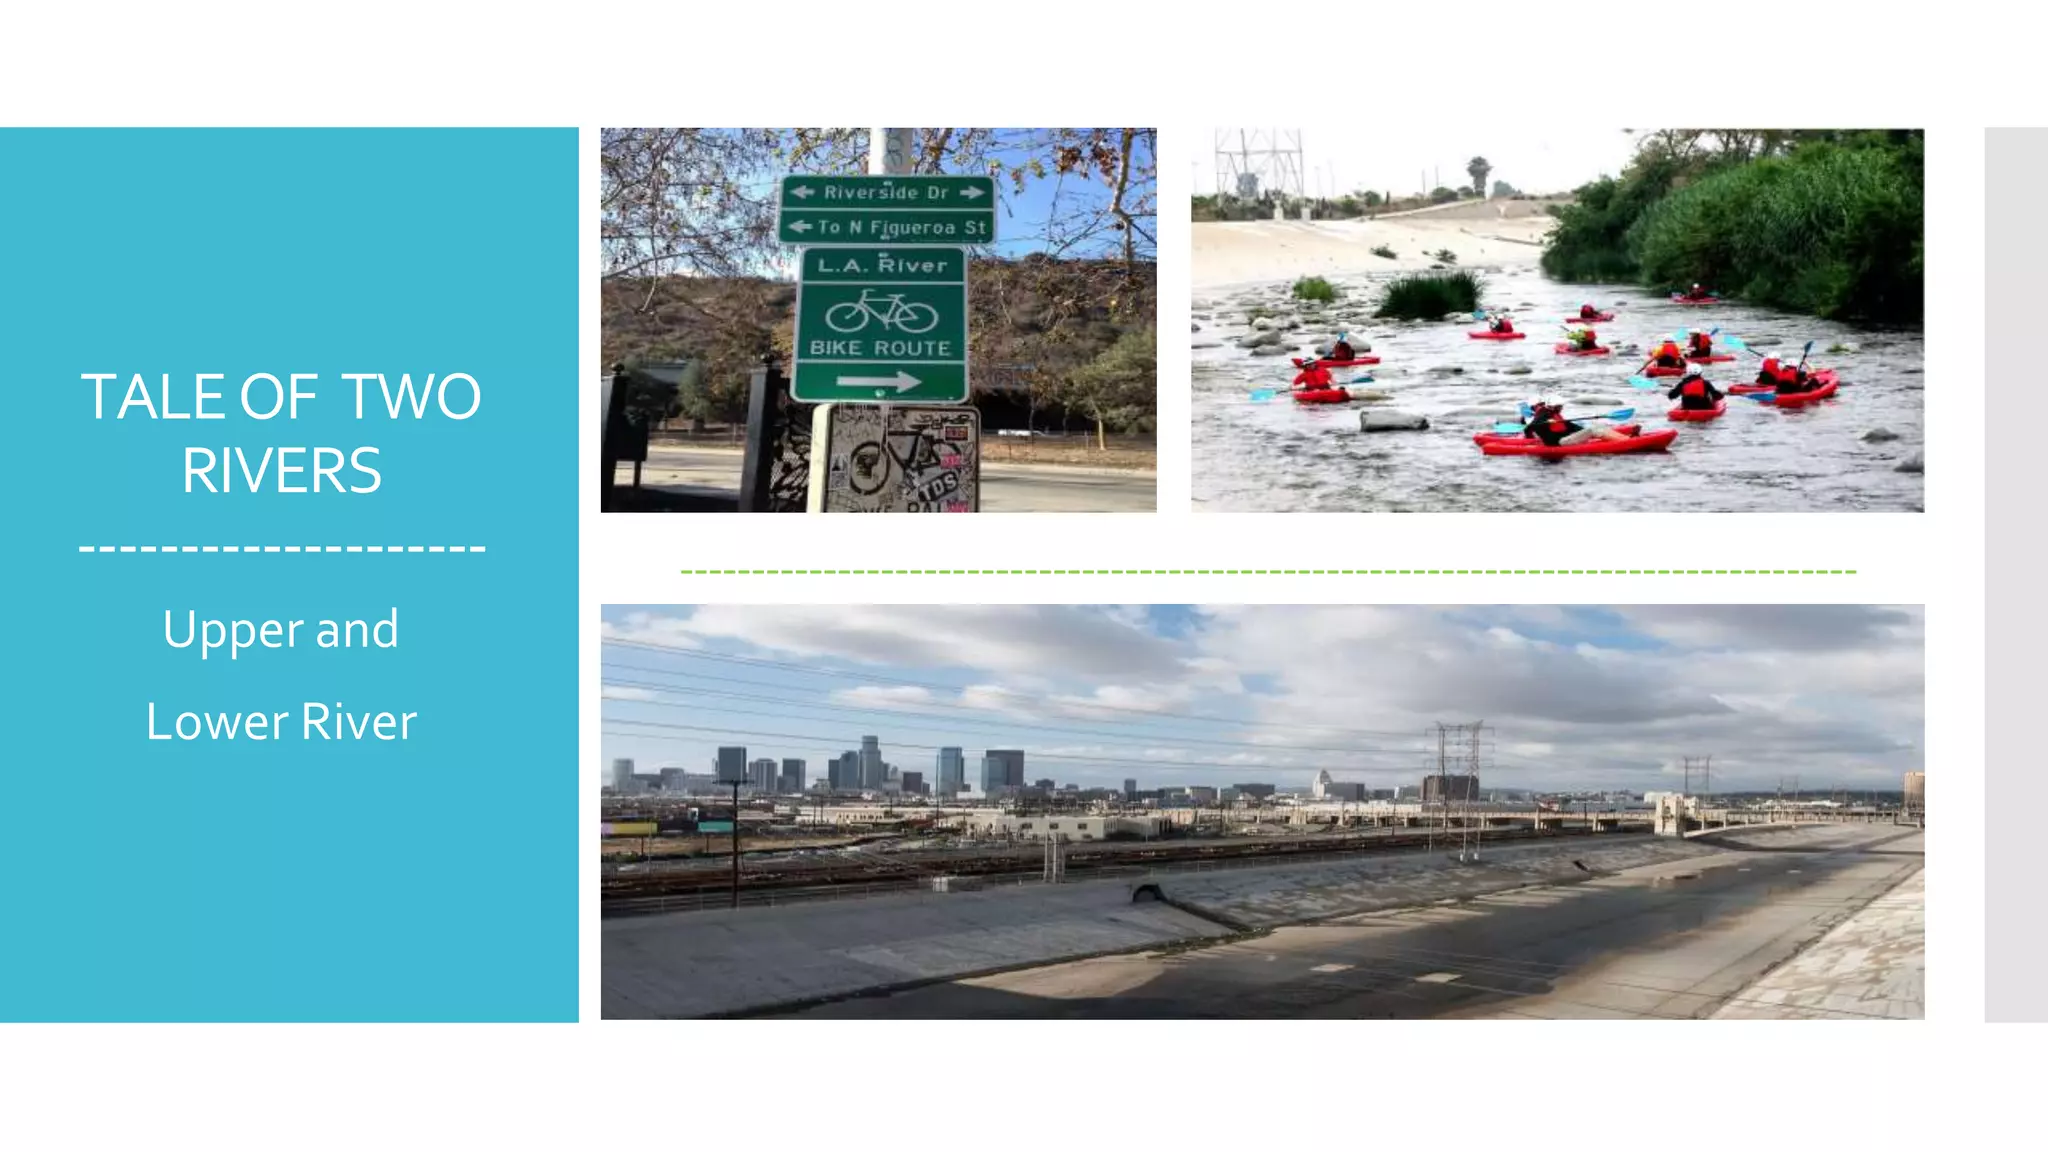
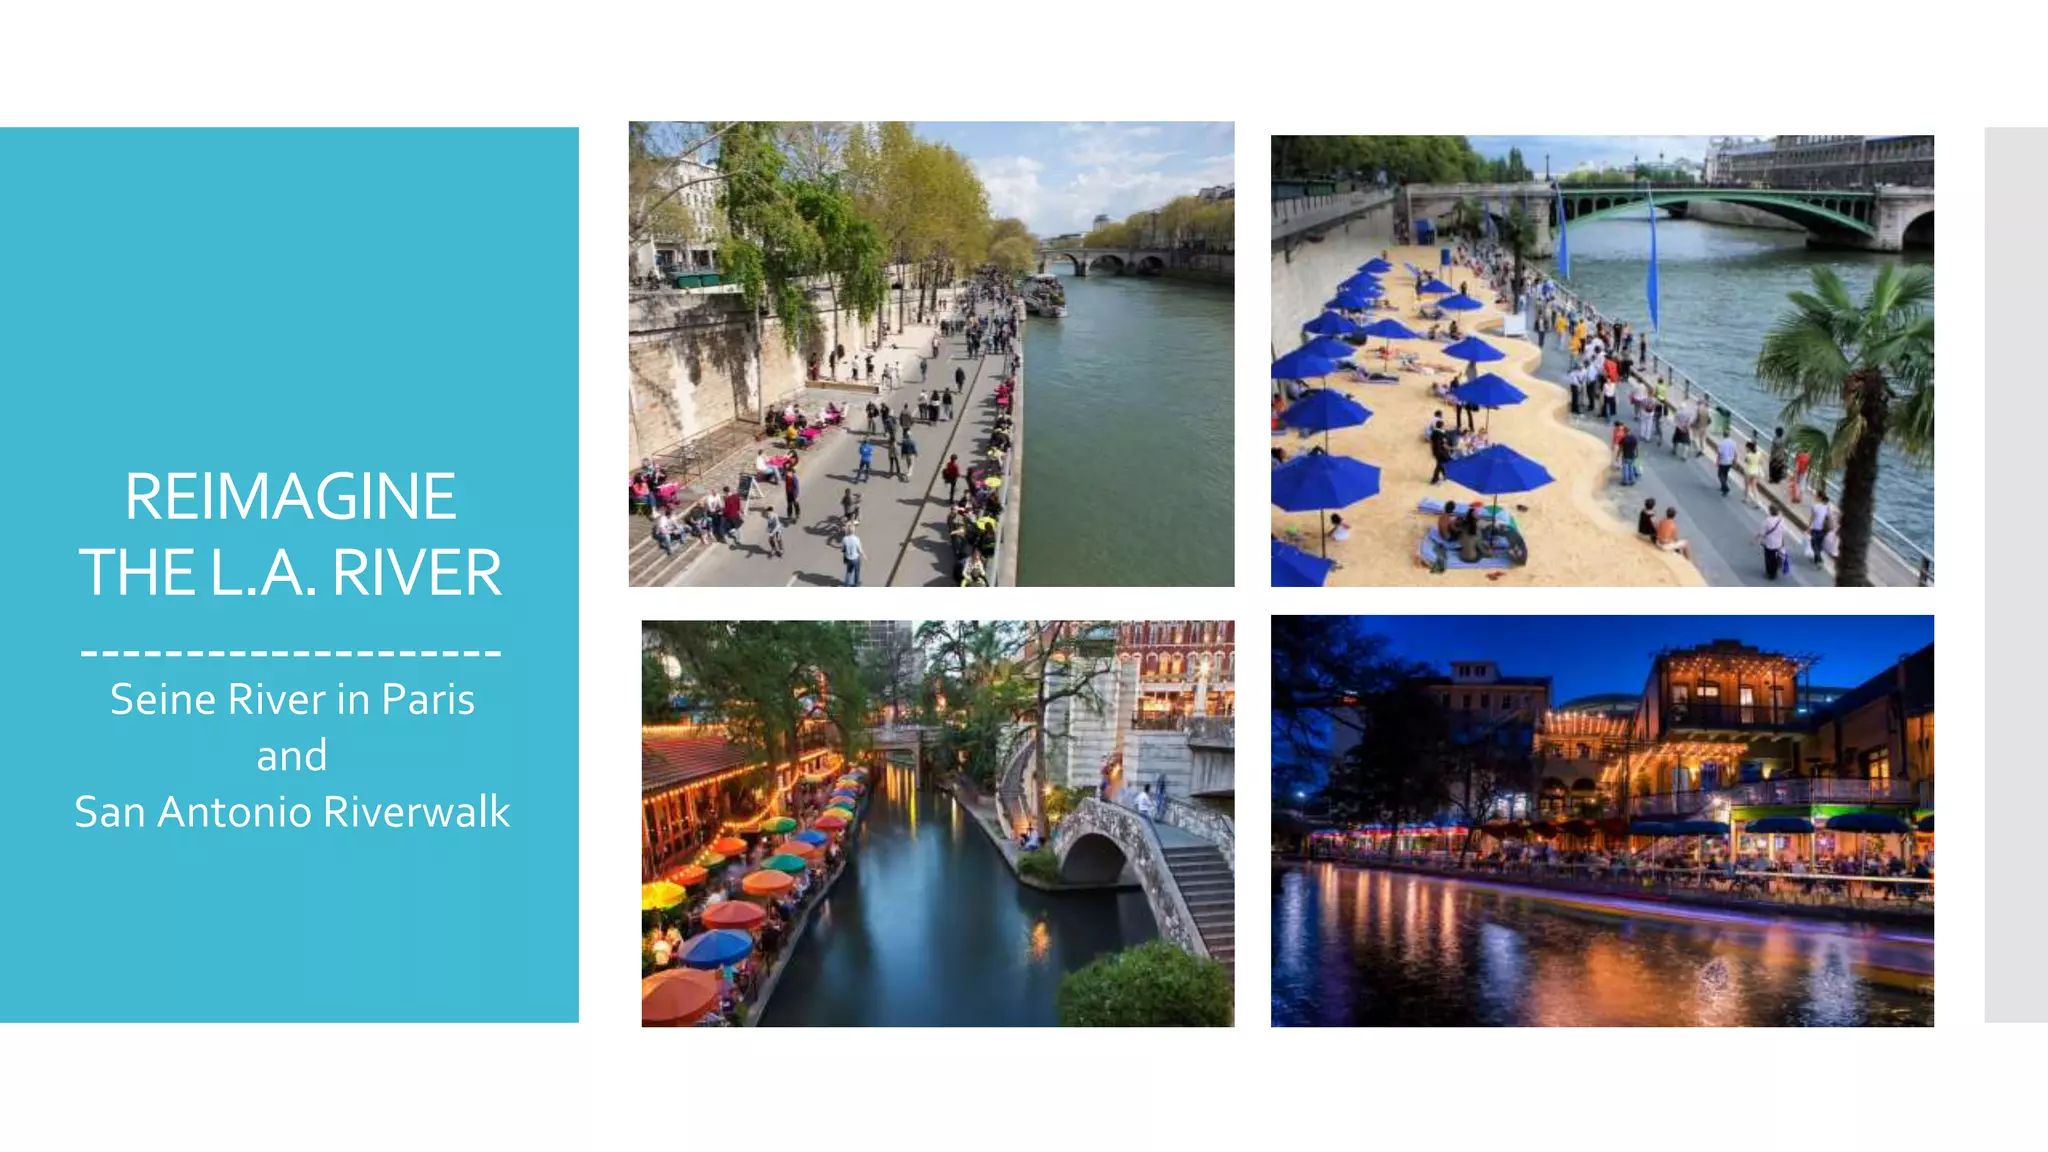
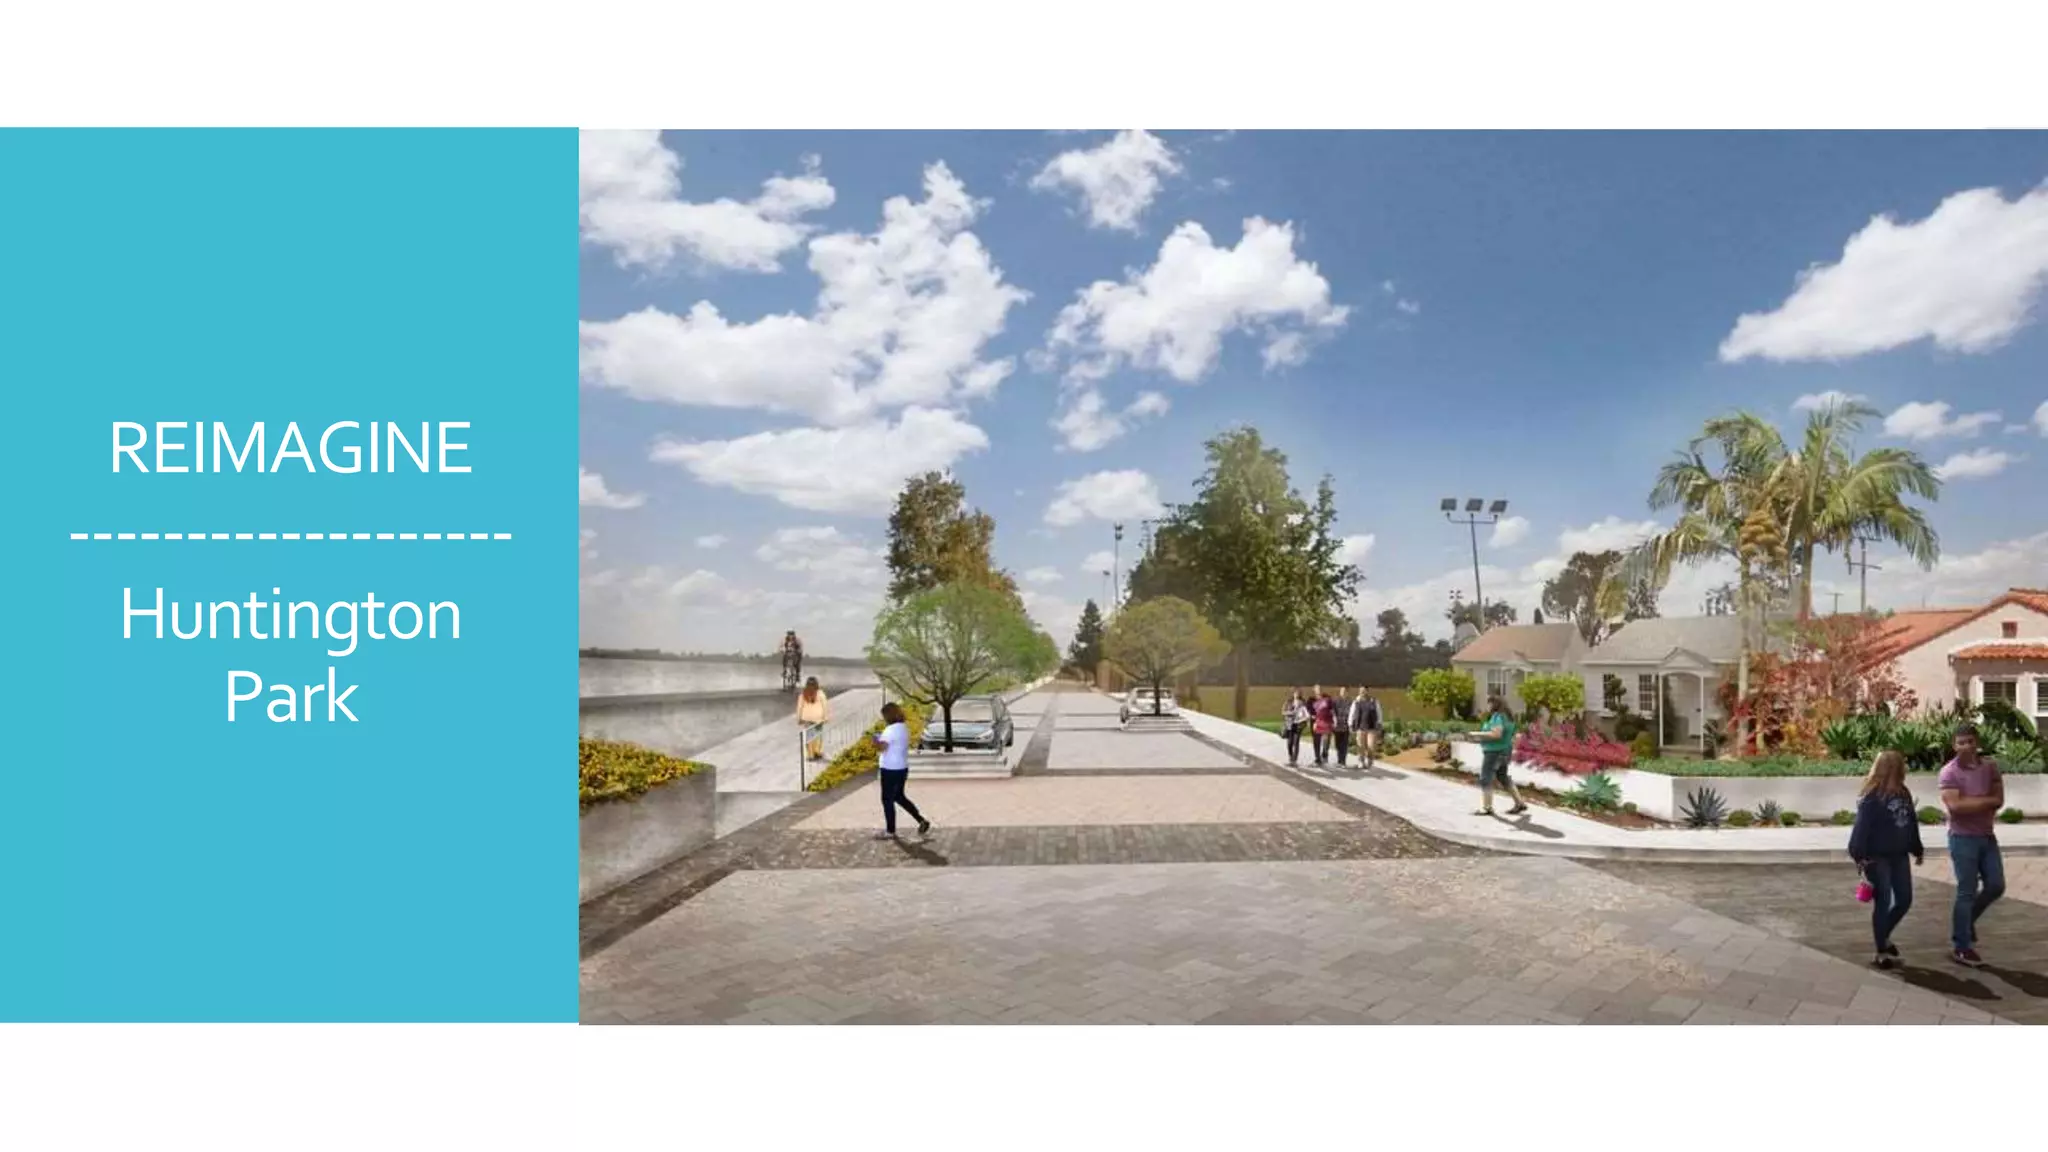
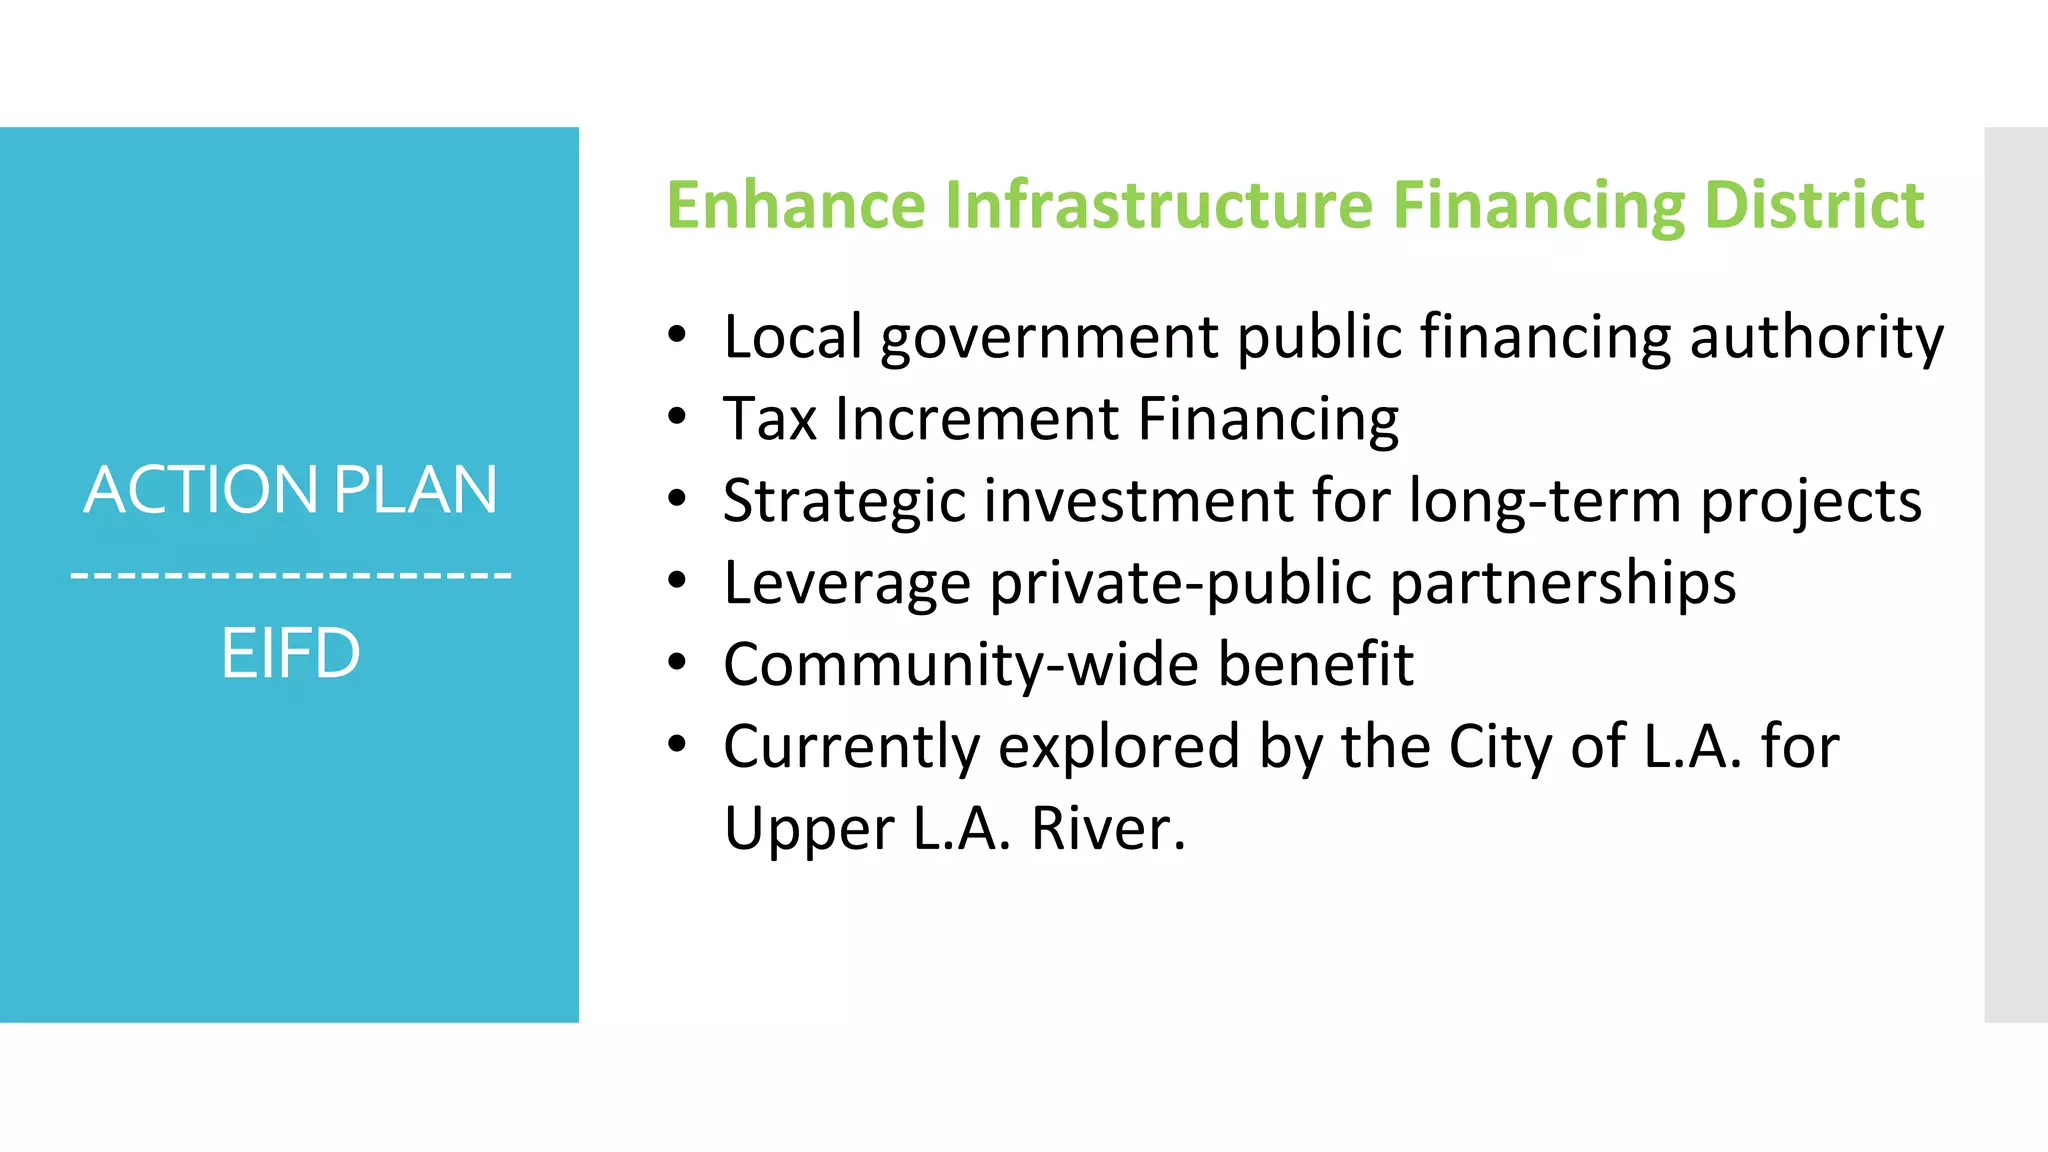
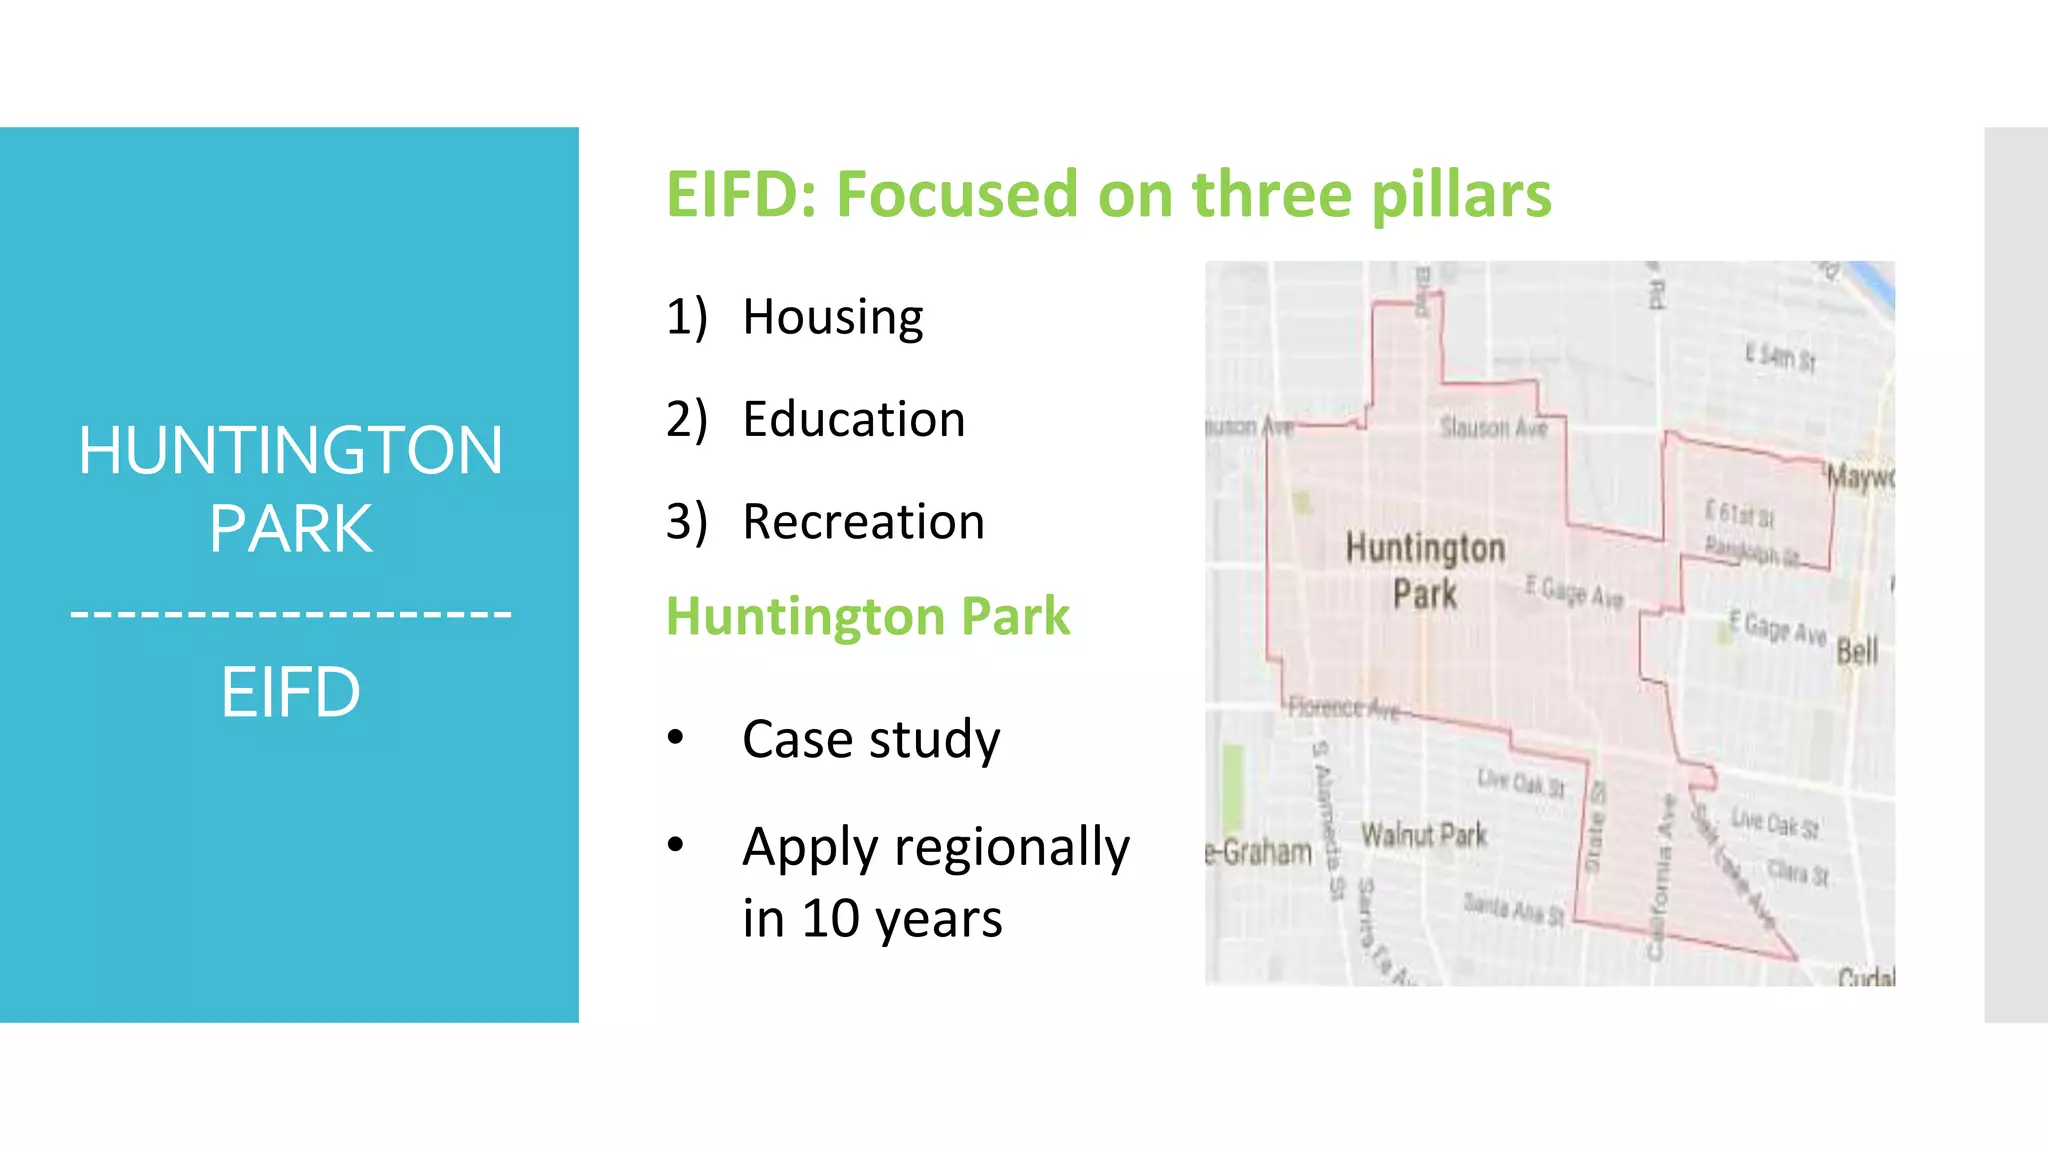
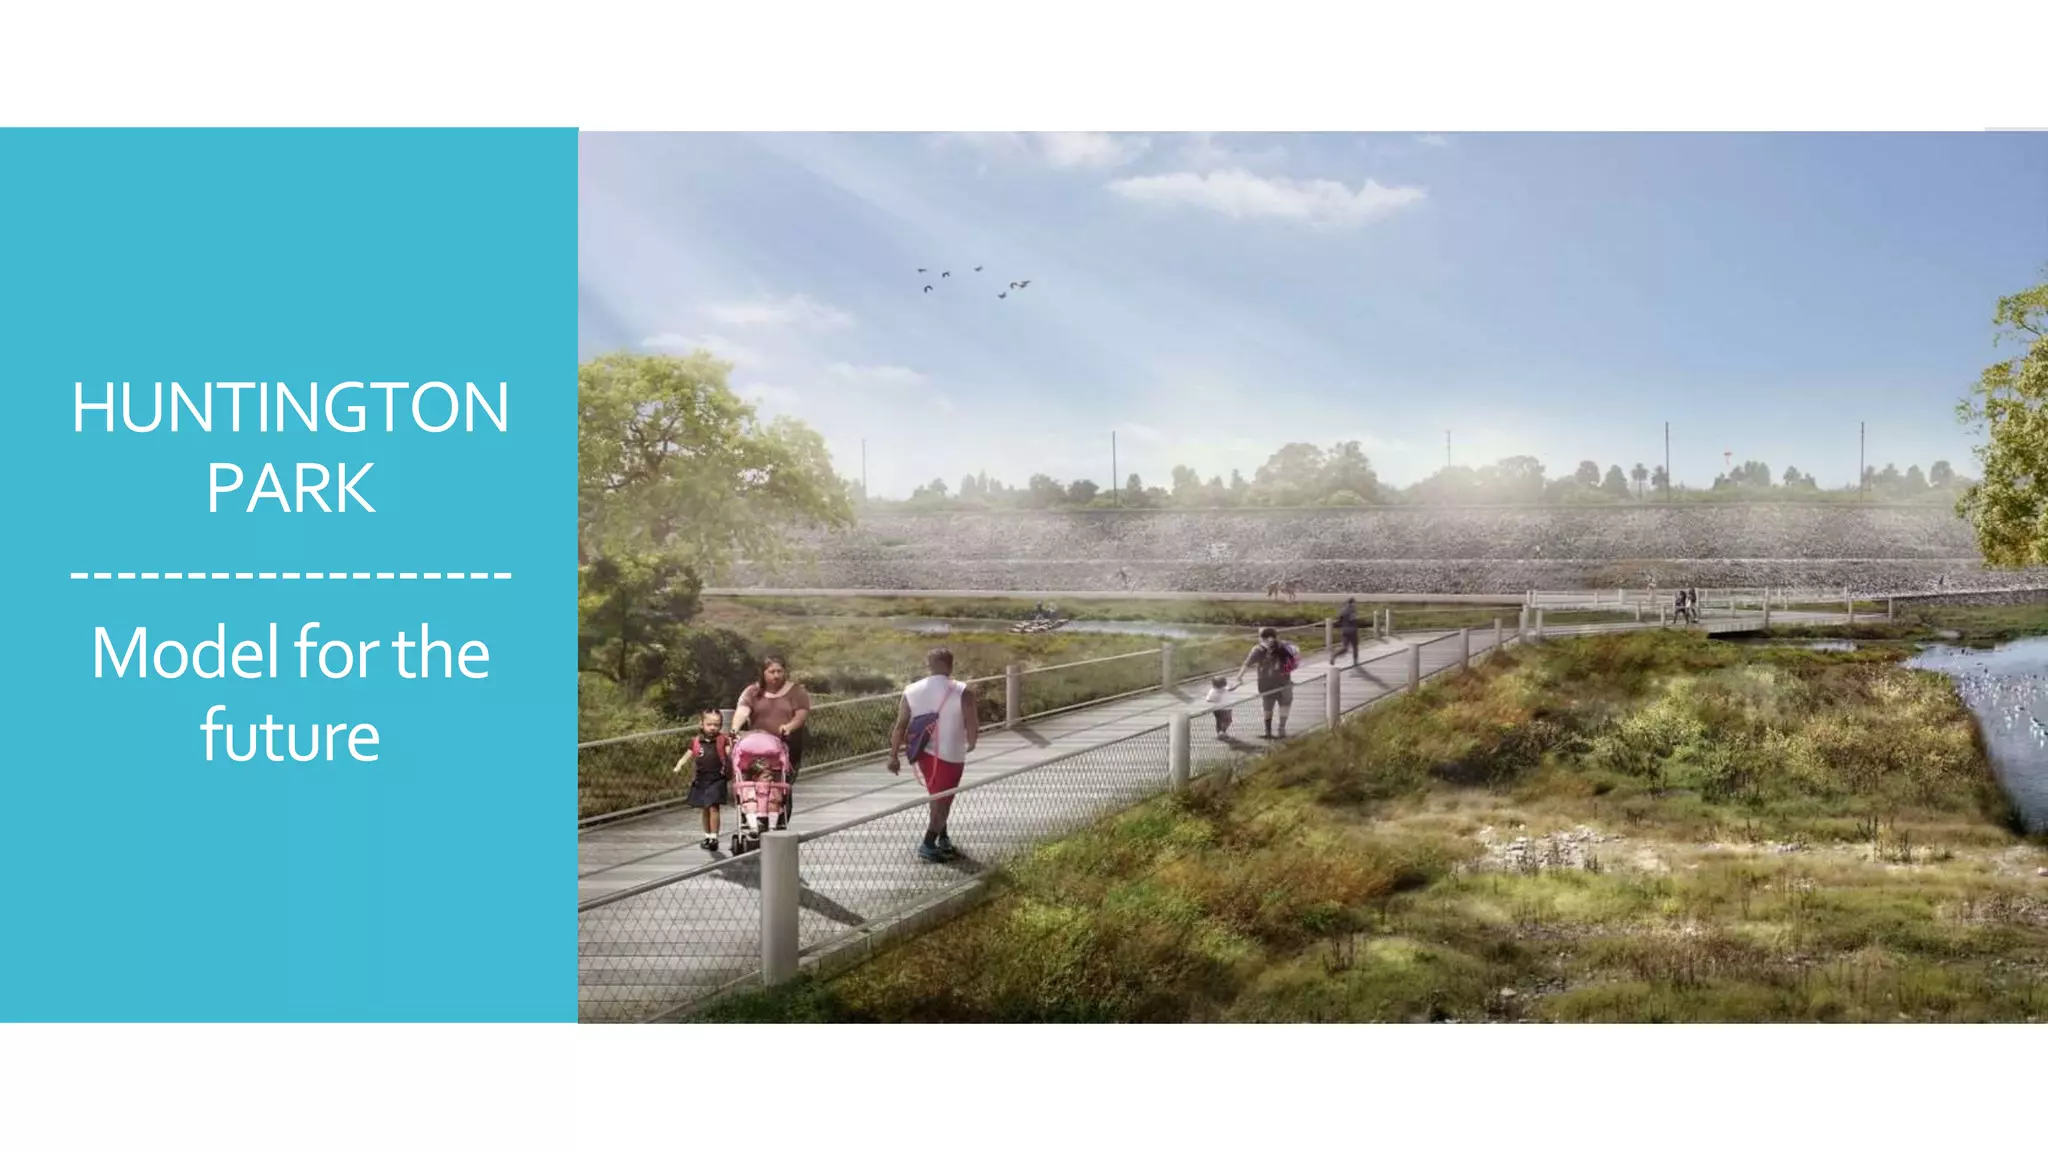
Enhancing Local Access
to Induce the Region’ s
Inclusive Economy
2018 USC Social Innovation Symposium: Team 2 presentation
Source: “The Measure of America 2013-2014”
Measure US Average California
At Least High School Diploma (%) 85.6 80.7
At Least Bachelor's Degree (%) 28.2 30.1
Graduate Degree (%) 10.4 11
Children Under 6 Living in Poverty (%) 24.8 23.6
Adults 65+ Living in Poverty (%) 9 9.7
Per Public Spending, Public K-12 ($) 11,339.3 9,530.2
Annual Costs of Public 4-Year College (average
$)
15,918 18,933.5
Annual Costs of Private 4-Year College (average
$)
32,616.6 38,047.4
Food Stamps Use (%) 9.3 6
Union Membership (%) 12.3 17.2
California & US Averages
Declining State support for higher education
Career Technical
Education
Source: Milken Institute “A Matter of Degrees: The Effects of Educational Attainment on Regional Economic Prosperity” (2013)
Relationship between regional GDP and average
educational attainment of employed workers
Increased
Statewide
housingcosts
California’s
Highhousing
pricesnotoffset
byhigher
wages
Source: Milken Institute
Housing Need vs
Housing Built
Shortfall
Sources: Zillow.
California
Millennials Less
Likely to Buy
Homes
1. Des Moines, IA 44% 1. Honolulu, HI 9%
2. Beaumont-Port Arthur, TX 42% 2. Los Angeles, CA 12%
3. Grand Rapids, MI 42% 3. New York, NY 12%
4. Lafayette, LA 41% 4. Santa Barbara, CA 13%
5. Omaha, NE 38% 5. Salinas, CA 13%
6. Minneapolis-St. Paul, MN 37% 6. San Jose, CA 14%
7. St. Louis, MO 36% 7. San Francisco, CA 14%
8. Baton Rouge, LA 36% 8. Santa Rosa, CA 14%
9. Lansing, MI 36% 9. San Diego, CA 15%
10. Montgomery, AL 36% 10. Oxnard-Ventura, CA 16%
Homeownership rate, young adults ages 23-34
Top 10 Bottom 10
California
Governments Rely
on Variety of
Revenue Sources
Source: California Legislative Analyst’s Office, December 8, 2014
Social
Innovation
Solutions–
LocalFocus
●Prepare the Los Angeles region’s higher education pipeline for the
Future or Work set up regional conversations between business
and policy leaders to coordinate effectively around local workforce
needs while developing the fundamental components necessary
that can enhance a region’s workforce. Invest in the relevance of
California’s high skill job training so that it meets business needs
and continues to support an innovation-based economy. Long
term, let’s develop a sustainable pool of highly-skilled workers, and
strengthen the recent entrepreneurial growth around innovation,
which can act as a beacon attracting the best and the brightest
from around the globe.
●Leverage Community funds, pricing, value capture and State and
local Bonds to incentivize local development that promotes the
need for additional housing and improvements in the built
environment.
SoutheastLos
Angeles
Region:
Huntington
Park
----------------
CityofPerfect
Balance
Huntington
Parktoday
❑As of 2010 population of 59,114 (est. today: 70,000 +)
❑3 square miles
❑97% Latino
❑Median income: $35,600
❑Median age: 30
❑Population under 18: 29.45%
SoutheastLos
Angeles
-----------------
YoungCity
The percentage of the population that is under
the age of 18
Source: Neighborhood Data for
social change
Education
AccessEquity
❑The importance of early childhood education
❑2014 LAUSD Student Index
❑2018 Student Index 2.0- Equity
❑More than just High School
❑Monitor and study implemented policy
Education
Access
Enhance
Infrastructure
Financing
District
❑Regional Effort
❑Scholarships and/or additional year of
community college for high need students
❑Brownfield Remediation
❑Building of additional satellite in SELA focused
on STEM/ Green & Blue Economy
ActionPlan
The percentage of the population that is under
the age of 18
Source: Neighborhood Data for
social change
EIFD will allow for local jurisdictions
to establish NEW development
expectations to develop needed
hosing units
LandValue
Capture
The percentage of the population that is under
the age of 18
Source: Neighborhood Data for
social change
Capture unearned land values increased
by the addition of public infrastructure
Inclusionary
Zoning
The percentage of the population that is under
the age of 18
Source: Neighborhood Data for
social change
Adopt ordinances that require
developers to provide affordable
housing in new buildings, either by
offering a certain percentage of
below-market-rate apartments–or
by paying a fee.
LinkageFees
The percentage of the population that is under
the age of 18
Source: Neighborhood Data for
social change
Local municipalities should require
a fee assessed on development
projects in order to mitigate the
impact of the additional demand
for affordable housing caused by
such activity.
LandTrust
Fund
The percentage of the population that is under
the age of 18
Source: Neighborhood Data for
social change
Independent nonprofit organization
created to oversee affordable
housing and preserve it for future
generations
SaltWaterHeals
Everything
50% of middle school aged
children in Los Angeles have
never been to the beach.
64% of African-American, 45%
of Hispanic/Latino, and 40% of
caucasian children have little
to no swimming ability**
**USA Swimming Foundation study through the University of Memphis and University of Las Vegas, 2017
PublicPrivate
Partnershipsto
benefitHP:
Make-a-Splash
andSurfBus
Foundation
●Make-a-Splash granted pools partner with LAUSD to offer swimming
sections as physical education in school
●Surf Bus Foundation partners with local government (park and recreation
departments) and LAUSD to offer interactive science curriculum to buttress
in-classroom learning.
●79% of children in households with incomes less than $50,000 (HP average is
$39,000) have little to no swimming ability**
●Children who qualify for the free/reduced cost school lunch program are 63%
less likely to have good swimming ability**
●Children who swim with their families are 3x’s more likely to be good
swimmers**
●Huntington Park community members use the coast as intended: as
intergenerational play space where they feel supported and welcome fully
interact with the ocean.
**USA Swimming Foundation study through the University of Memphis and University of Las Vegas, 2017
Make-a-Splashin
HuntingtonPark
7 pools within 7 miles of HP
• Huntington Park High School
• Linda Marquez High School
• Medico Centro
• Maywood YMCA
• Echo Park Deep Pool
• Jesse Owens Public Pool
• Boyle Heights Sports Center
All eligible for Make-a-Splash grant funding
from USA Swimming
Swimming as mandatory pe credit for
LAUSD District 6 schools
Barrierstowater
aremorethan
proximity:FEAR.
78% of African-American
children, 62% of
Hispanic/Latino children,
and 67% of Caucasian
children have parents
with little/no swimming
ability. If parents can
swim, their kids are 4x’s
more likely to have good
swim skills.
Let’sgotothe
beach!
A trip to the nearest beach is
anywhere from 45 minutes to
almost two hours.
The costs for families are
prohibitive—time, money,
safety gear/equipment, and
social support are in minimal
supply.
Community and school
support can shift the outcome
of these gaps in access to the
coast.
SplashForceLA
Surf Bus Foundation partners
with LAUSD, local park and
recreation departments/teen
centers, YMCA, and Boys and
Girls Clubs to bring groups of
scale to the ocean from
elementary school through high
school.
Surf Bus provides
transportation, bathing suits,
safety equipment, and healthy
lunch in summer long immersion
style programs and school year
science field trips.
WaveReadiness
101:Youcannot
stopthewaves…
formal swimming lessons
reduces likelihood of
childhood drowning by
88%**
Students learn Ocean
Literacy principles, ocean
safety and open water
swim skills, and how to
surf and ride waves.
**USA Swimming Foundation study through the University of Memphis and University of Las Vegas, 2017
…butyoucan
learnhowtosurf.
Ocean visits to learn open
water safety, ocean
literacy principles, and
wave readiness skills are
what we call “ocean
socialization” helping
youth develop self-
esteem, motivation,
endurance, and trust (in
self).
Experiential
Learning:PLAY
We learn and act it out in
the classroom…
Experiential
Learning:PLAY
We get to experience our
play in real time with
what makes Los Angeles
most unique: her
seascape and the waves.
Whatifwecould
bringthewaves
tothegroms?
Imagine an LA where a
trip to the waves was as
close as the local LA River
corridor…
LARiverandthe
LA2028Olympic
Games:Surf’sUp!
Reimagine the lower river as a
wave pool—unify East,
Southeast, and South Los
Angeles communities and their
neighbors
Utilize Public-private
partnerships to reimagine and
build out the space for the
olympics and beyond—open
water spaces are park and
playground spaces!
RECREATION
------------------
Reimagining
Recreational Spaces
HUNTINGTON
PARK
-------------------
PARK METRICS
40.5 Park Acres 58,941 0.7 PARK ACRES
Within study area POPULATION PER 1,000
L.A. County average is 3.3 parks acres per 1,000
----------------------------------------------------------------------------------
PARK ACCESSIBILITY:
68% of population living
within ½ mile of a park
County average is 49% of population living ½ mile of a park
Five Parks Total
THEL.A.RIVER
--------------------
51Miles
33 Cities: Connects from Elysian Valley to Long Beach
WHY THELA
RIVER?
8 of the cities in the Lower L.A. River are
in the top 100 densest cities in the U.S.
More than 25% of the population of
California lives within 1 hour (30 miles) of
the L.A. River
More than 1 million people live within 1
mile of the L.A. River
TALEOF TWO
RIVERS
--------------------
Upper and
Lower River
----------------------------------------------------------------------------------
REIMAGINE
THEL.A.RIVER
--------------------
Seine River in Paris
and
San Antonio Riverwalk
REIMAGINE
-------------------
Huntington
Park
ACTIONPLAN
-------------------
EIFD
Enhance Infrastructure Financing District
• Local government public financing authority
• Tax Increment Financing
• Strategic investment for long-term projects
• Leverage private-public partnerships
• Community-wide benefit
• Currently explored by the City of L.A. for
Upper L.A. River.
HUNTINGTON
PARK
-------------------
EIFD
EIFD: Focused on three pillars
1) Housing
2) Education
3) Recreation
Huntington Park
• Case study
• Apply regionally
in 10 years
HUNTINGTON
PARK
-------------------
Modelforthe
future
TheFuture

Enhancing Local Access to Induce the Region's Inclusive Economy

  • 1.
    Enhancing Local Access toInduce the Region’ s Inclusive Economy 2018 USC Social Innovation Symposium: Team 2 presentation
  • 2.
    Source: “The Measureof America 2013-2014” Measure US Average California At Least High School Diploma (%) 85.6 80.7 At Least Bachelor's Degree (%) 28.2 30.1 Graduate Degree (%) 10.4 11 Children Under 6 Living in Poverty (%) 24.8 23.6 Adults 65+ Living in Poverty (%) 9 9.7 Per Public Spending, Public K-12 ($) 11,339.3 9,530.2 Annual Costs of Public 4-Year College (average $) 15,918 18,933.5 Annual Costs of Private 4-Year College (average $) 32,616.6 38,047.4 Food Stamps Use (%) 9.3 6 Union Membership (%) 12.3 17.2 California & US Averages
  • 3.
    Declining State supportfor higher education
  • 4.
    Career Technical Education Source: MilkenInstitute “A Matter of Degrees: The Effects of Educational Attainment on Regional Economic Prosperity” (2013) Relationship between regional GDP and average educational attainment of employed workers
  • 5.
  • 6.
  • 7.
    Source: Milken Institute HousingNeed vs Housing Built Shortfall
  • 8.
    Sources: Zillow. California Millennials Less Likelyto Buy Homes 1. Des Moines, IA 44% 1. Honolulu, HI 9% 2. Beaumont-Port Arthur, TX 42% 2. Los Angeles, CA 12% 3. Grand Rapids, MI 42% 3. New York, NY 12% 4. Lafayette, LA 41% 4. Santa Barbara, CA 13% 5. Omaha, NE 38% 5. Salinas, CA 13% 6. Minneapolis-St. Paul, MN 37% 6. San Jose, CA 14% 7. St. Louis, MO 36% 7. San Francisco, CA 14% 8. Baton Rouge, LA 36% 8. Santa Rosa, CA 14% 9. Lansing, MI 36% 9. San Diego, CA 15% 10. Montgomery, AL 36% 10. Oxnard-Ventura, CA 16% Homeownership rate, young adults ages 23-34 Top 10 Bottom 10
  • 9.
    California Governments Rely on Varietyof Revenue Sources Source: California Legislative Analyst’s Office, December 8, 2014
  • 10.
    Social Innovation Solutions– LocalFocus ●Prepare the LosAngeles region’s higher education pipeline for the Future or Work set up regional conversations between business and policy leaders to coordinate effectively around local workforce needs while developing the fundamental components necessary that can enhance a region’s workforce. Invest in the relevance of California’s high skill job training so that it meets business needs and continues to support an innovation-based economy. Long term, let’s develop a sustainable pool of highly-skilled workers, and strengthen the recent entrepreneurial growth around innovation, which can act as a beacon attracting the best and the brightest from around the globe. ●Leverage Community funds, pricing, value capture and State and local Bonds to incentivize local development that promotes the need for additional housing and improvements in the built environment.
  • 11.
  • 12.
    Huntington Parktoday ❑As of 2010population of 59,114 (est. today: 70,000 +) ❑3 square miles ❑97% Latino ❑Median income: $35,600 ❑Median age: 30 ❑Population under 18: 29.45%
  • 13.
    SoutheastLos Angeles ----------------- YoungCity The percentage ofthe population that is under the age of 18 Source: Neighborhood Data for social change
  • 14.
    Education AccessEquity ❑The importance ofearly childhood education ❑2014 LAUSD Student Index ❑2018 Student Index 2.0- Equity ❑More than just High School ❑Monitor and study implemented policy
  • 15.
    Education Access Enhance Infrastructure Financing District ❑Regional Effort ❑Scholarships and/oradditional year of community college for high need students ❑Brownfield Remediation ❑Building of additional satellite in SELA focused on STEM/ Green & Blue Economy
  • 20.
    ActionPlan The percentage ofthe population that is under the age of 18 Source: Neighborhood Data for social change EIFD will allow for local jurisdictions to establish NEW development expectations to develop needed hosing units
  • 21.
    LandValue Capture The percentage ofthe population that is under the age of 18 Source: Neighborhood Data for social change Capture unearned land values increased by the addition of public infrastructure
  • 26.
    Inclusionary Zoning The percentage ofthe population that is under the age of 18 Source: Neighborhood Data for social change Adopt ordinances that require developers to provide affordable housing in new buildings, either by offering a certain percentage of below-market-rate apartments–or by paying a fee.
  • 27.
    LinkageFees The percentage ofthe population that is under the age of 18 Source: Neighborhood Data for social change Local municipalities should require a fee assessed on development projects in order to mitigate the impact of the additional demand for affordable housing caused by such activity.
  • 28.
    LandTrust Fund The percentage ofthe population that is under the age of 18 Source: Neighborhood Data for social change Independent nonprofit organization created to oversee affordable housing and preserve it for future generations
  • 29.
    SaltWaterHeals Everything 50% of middleschool aged children in Los Angeles have never been to the beach. 64% of African-American, 45% of Hispanic/Latino, and 40% of caucasian children have little to no swimming ability** **USA Swimming Foundation study through the University of Memphis and University of Las Vegas, 2017
  • 30.
    PublicPrivate Partnershipsto benefitHP: Make-a-Splash andSurfBus Foundation ●Make-a-Splash granted poolspartner with LAUSD to offer swimming sections as physical education in school ●Surf Bus Foundation partners with local government (park and recreation departments) and LAUSD to offer interactive science curriculum to buttress in-classroom learning. ●79% of children in households with incomes less than $50,000 (HP average is $39,000) have little to no swimming ability** ●Children who qualify for the free/reduced cost school lunch program are 63% less likely to have good swimming ability** ●Children who swim with their families are 3x’s more likely to be good swimmers** ●Huntington Park community members use the coast as intended: as intergenerational play space where they feel supported and welcome fully interact with the ocean. **USA Swimming Foundation study through the University of Memphis and University of Las Vegas, 2017
  • 31.
    Make-a-Splashin HuntingtonPark 7 pools within7 miles of HP • Huntington Park High School • Linda Marquez High School • Medico Centro • Maywood YMCA • Echo Park Deep Pool • Jesse Owens Public Pool • Boyle Heights Sports Center All eligible for Make-a-Splash grant funding from USA Swimming Swimming as mandatory pe credit for LAUSD District 6 schools
  • 32.
    Barrierstowater aremorethan proximity:FEAR. 78% of African-American children,62% of Hispanic/Latino children, and 67% of Caucasian children have parents with little/no swimming ability. If parents can swim, their kids are 4x’s more likely to have good swim skills.
  • 33.
    Let’sgotothe beach! A trip tothe nearest beach is anywhere from 45 minutes to almost two hours. The costs for families are prohibitive—time, money, safety gear/equipment, and social support are in minimal supply. Community and school support can shift the outcome of these gaps in access to the coast.
  • 34.
    SplashForceLA Surf Bus Foundationpartners with LAUSD, local park and recreation departments/teen centers, YMCA, and Boys and Girls Clubs to bring groups of scale to the ocean from elementary school through high school. Surf Bus provides transportation, bathing suits, safety equipment, and healthy lunch in summer long immersion style programs and school year science field trips.
  • 35.
    WaveReadiness 101:Youcannot stopthewaves… formal swimming lessons reduceslikelihood of childhood drowning by 88%** Students learn Ocean Literacy principles, ocean safety and open water swim skills, and how to surf and ride waves. **USA Swimming Foundation study through the University of Memphis and University of Las Vegas, 2017
  • 36.
    …butyoucan learnhowtosurf. Ocean visits tolearn open water safety, ocean literacy principles, and wave readiness skills are what we call “ocean socialization” helping youth develop self- esteem, motivation, endurance, and trust (in self).
  • 37.
    Experiential Learning:PLAY We learn andact it out in the classroom…
  • 38.
    Experiential Learning:PLAY We get toexperience our play in real time with what makes Los Angeles most unique: her seascape and the waves.
  • 39.
    Whatifwecould bringthewaves tothegroms? Imagine an LAwhere a trip to the waves was as close as the local LA River corridor…
  • 40.
    LARiverandthe LA2028Olympic Games:Surf’sUp! Reimagine the lowerriver as a wave pool—unify East, Southeast, and South Los Angeles communities and their neighbors Utilize Public-private partnerships to reimagine and build out the space for the olympics and beyond—open water spaces are park and playground spaces!
  • 41.
  • 42.
    HUNTINGTON PARK ------------------- PARK METRICS 40.5 ParkAcres 58,941 0.7 PARK ACRES Within study area POPULATION PER 1,000 L.A. County average is 3.3 parks acres per 1,000 ---------------------------------------------------------------------------------- PARK ACCESSIBILITY: 68% of population living within ½ mile of a park County average is 49% of population living ½ mile of a park Five Parks Total
  • 43.
  • 44.
    WHY THELA RIVER? 8 ofthe cities in the Lower L.A. River are in the top 100 densest cities in the U.S. More than 25% of the population of California lives within 1 hour (30 miles) of the L.A. River More than 1 million people live within 1 mile of the L.A. River
  • 45.
    TALEOF TWO RIVERS -------------------- Upper and LowerRiver ----------------------------------------------------------------------------------
  • 46.
  • 47.
  • 48.
    ACTIONPLAN ------------------- EIFD Enhance Infrastructure FinancingDistrict • Local government public financing authority • Tax Increment Financing • Strategic investment for long-term projects • Leverage private-public partnerships • Community-wide benefit • Currently explored by the City of L.A. for Upper L.A. River.
  • 49.
    HUNTINGTON PARK ------------------- EIFD EIFD: Focused onthree pillars 1) Housing 2) Education 3) Recreation Huntington Park • Case study • Apply regionally in 10 years
  • 50.
  • 51.

Editor's Notes

  • #8 https://cleantechnica.com/2013/06/04/california-ranked-as-epicenter-the-of-us-clean-tech-market/