Engl 396 infographics presentation
•Download as PPTX, PDF•
0 likes•324 views
Information graphics summarize complex data in a visual format using images, charts, and diagrams. They communicate information efficiently by conveying more information visually than is possible through text alone. Different types of information graphics include text boxes, charts, tables, diagrams, and maps to succinctly present factual data from credible sources on a topic. Effective infographics have a clear structure and layout with proper citation of sources.
Report
Share
Report
Share

Recommended
Data visualization representation of Analytics data
This presentation shows the how the data can be represented in various ways for easy interpretation of data
Presentation Gartner; Towards Ubiquitous Cartography
This document outlines a presentation on ubiquitous cartography, which proposes that as location technologies improve, maps need to evolve to effectively communicate contextual information, meanings, directions, and privacy in an adaptive way. The presentation covers background on ubiquitous cartography, how maps can support context, communicate location-based meanings, help users find their way, and ensure privacy, concluding with a discussion on developing context-sensitive and formally interpretable map standards and guidelines.
Around a Topic - Presentation Template
An infographic Prezi Template with a round and colorful design concept on a world map background.
A professional looking circle diagram prezi – suitable for a variety of presentation topics.
Present a creative business or company report, data, generate a mindmap of ideas, talk about politics or international relations.
Divide the presentation into sections using colors and symbols – just like a pie chart, add numbers, letters or symbols
Move the lines/circles and create more placeholders for content.
6 Infographics About Presentations
find 6 interesting infographics about creating presentations, the process for presentations, the change in presentation styles over time, when to use slides and more.
Infographics Key Data KPI presentation slides
Infographics of key data values and KPIs - inspirative of creative slide design templates. Flat style diagrams and geometric shapes. Inspiration how to present a text formal data in an unique visual way. Graphics is in modern metro UI graphical style, easily redoable and editable in PowerPoint.
Slideshare.Com Powerpoint
Computer hardware devices include webcams, scanners, mice, speakers, trackballs, and light pens. Webcams connect via USB or network and are used for video calls and conferencing. Scanners optically scan images and documents into digital formats. Mice are pointing devices that detect motion to move a cursor. Speakers have internal amplifiers and audio jacks. Trackballs contain ball and sensors to detect rotation for cursor movement. Light pens allow pointing directly on CRT displays.
Slideshare Powerpoint presentation
Art is a creative expression that stimulates the senses or imagination according to Felicity Hampel. Picasso believed that every child is an artist but growing up can stop that creativity. Aristotle defined art as anything requiring a maker and not being able to create itself.
LinkedIn SlideShare: Knowledge, Well-Presented
70 million professionals use LinkedIn SlideShare to learn about any topic quickly and stand out.
MELJUN CORTES research seminar_1_presentation_techniques
This document provides guidance on effective techniques for presenting data through graphics such as charts, graphs, and tables. It discusses principles of graphic excellence, such as communicating complex ideas clearly and efficiently. Rules for creating high-quality tables and charts are presented, including proper formatting, sourcing, and design elements. A variety of chart types like bar graphs, pie charts, and line graphs are described along with guidelines for choosing the appropriate format to illustrate different types of relationships in the data. The document cautions that while powerful, graphics can potentially mislead if not designed and presented truthfully.
Non – projected
Non-projected visuals such as still pictures, drawings, charts, and posters can translate abstract ideas into more concrete representations. They allow instruction to move from verbal symbols to a more visual level. These visuals are easy to use without equipment and can stimulate creative expression. Common types include still pictures, drawings, organizational charts, timelines, tables, flowcharts, bar graphs, pictorial graphs, circle graphs, line graphs, and posters. Cartoons also appeal to viewers through humor and satire.
Non – projected
Non-projected visuals such as still pictures, drawings, charts, and posters can translate abstract ideas into more concrete representations. They allow instruction to move from verbal symbols to a more visual level. These visuals are inexpensive and easy to use without additional equipment across different subjects and levels of instruction. They can be used to stimulate creative expression or for testing and evaluation. Common types include still pictures, drawings, organizational charts, timelines, tables, flowcharts, graphs like bar graphs and line graphs, as well as posters and cartoons.
Non – projected
Non-projected visuals such as still pictures, drawings, charts, and posters can translate abstract ideas into more concrete representations. They allow instruction to move from verbal symbols to a more visual level. These visuals are inexpensive and easy to use without equipment in many instructional contexts and disciplines. They can stimulate creative expression and be used for testing and evaluation. Common types include still pictures, drawings, organizational charts, timelines, tables, flowcharts, graphs like bar graphs and line graphs, and posters.
Friday Session #64: Key Recipes For Killer Infographics
A slidedeck presented at the 64th Cleverwood Friday Session. Feel free to visit our website for various other courses in digital media http://www.cleverwood.be/learning-hub
Diagramatic and graphical representation of data Notes on Statistics.ppt
Diagrams and graphical representations are essential tools for presenting statistical data in a simple and easy to understand way. There are different types of diagrams that can be used depending on the dataset, including line diagrams, bar diagrams, and pie charts. Graphical representations make data easier to comprehend, allow for comparisons, and are universally accepted. They improve the overall representation of data.
Visual Information writeup
This document discusses visual information and its importance in academic writing. It notes that visuals can help researchers organize and communicate ideas more effectively. Research shows people remember information presented visually much better than through words alone. Visual information includes photographs, videos, graphs, and other visual media. Tables and figures are commonly used types of visual information in academic writing to display statistical data, compare information, and illustrate concepts. Captions should be included to help readers interpret visuals. The document emphasizes that visuals have educational benefits like developing ideas, analyzing complex topics simply, and aiding communication and decision making.
Visual Presentations and Graphical Data
This document provides information on various visual presentation methods such as tabulated data, line graphs, bar graphs, Gantt charts, pictograms, maps, flow charts, pie charts, cartograms, visual planning boards, and computer graphics. It defines each method and provides examples. Key points covered include how tabulated data organizes large amounts of data for easy access and analysis, line graphs show changes over time, bar graphs allow for comparisons, and Gantt charts illustrate project schedules. The document also discusses best practices for visual presentations such as using a single clear font, ensuring images are legible, and that images serve a specific purpose rather than just being decorative.
定制美国西雅图城市大学毕业证学历证书原版一模一样
原版一模一样【微信:741003700 】【美国西雅图城市大学毕业证学历证书】【微信:741003700 】学位证,留信认证(真实可查,永久存档)offer、雅思、外壳等材料/诚信可靠,可直接看成品样本,帮您解决无法毕业带来的各种难题!外壳,原版制作,诚信可靠,可直接看成品样本。行业标杆!精益求精,诚心合作,真诚制作!多年品质 ,按需精细制作,24小时接单,全套进口原装设备。十五年致力于帮助留学生解决难题,包您满意。
本公司拥有海外各大学样板无数,能完美还原海外各大学 Bachelor Diploma degree, Master Degree Diploma
1:1完美还原海外各大学毕业材料上的工艺:水印,阴影底纹,钢印LOGO烫金烫银,LOGO烫金烫银复合重叠。文字图案浮雕、激光镭射、紫外荧光、温感、复印防伪等防伪工艺。材料咨询办理、认证咨询办理请加学历顾问Q/微741003700
留信网认证的作用:
1:该专业认证可证明留学生真实身份
2:同时对留学生所学专业登记给予评定
3:国家专业人才认证中心颁发入库证书
4:这个认证书并且可以归档倒地方
5:凡事获得留信网入网的信息将会逐步更新到个人身份内,将在公安局网内查询个人身份证信息后,同步读取人才网入库信息
6:个人职称评审加20分
7:个人信誉贷款加10分
8:在国家人才网主办的国家网络招聘大会中纳入资料,供国家高端企业选择人才
Manual ISH (International Society of Hypertension)
Manual ISH (International Society of Hypertension)
Practical eLearning Makeovers for Everyone
Welcome to Practical eLearning Makeovers for Everyone. In this presentation, we’ll take a look at a bunch of easy-to-use visual design tips and tricks. And we’ll do this by using them to spruce up some eLearning screens that are in dire need of a new look.
Discovering the Best Indian Architects A Spotlight on Design Forum Internatio...
Discovering the Best Indian Architects A Spotlight on Design Forum Internatio...Designforuminternational
India’s architectural landscape is a vibrant tapestry that weaves together the country's rich cultural heritage and its modern aspirations. From majestic historical structures to cutting-edge contemporary designs, the work of Indian architects is celebrated worldwide. Among the many firms shaping this dynamic field, Design Forum International stands out as a leader in innovative and sustainable architecture. This blog explores some of the best Indian architects, highlighting their contributions and showcasing the most famous architects in India.一比一原版阿肯色大学毕业证(UCSF毕业证书)如何办理
学校原件一模一样【微信:6496090】【阿肯色大学毕业证(UCSF毕业证书)成绩单学位证】【微信:6496090】(留信学历认证永久存档查询)采用学校原版纸张、特殊工艺完全按照原版一比一制作(包括:隐形水印,阴影底纹,钢印LOGO烫金烫银,LOGO烫金烫银复合重叠,文字图案浮雕,激光镭射,紫外荧光,温感,复印防伪)行业标杆!精益求精,诚心合作,真诚制作!多年品质 ,按需精细制作,24小时接单,全套进口原装设备,十五年致力于帮助留学生解决难题,业务范围有加拿大、英国、澳洲、韩国、美国、新加坡,新西兰等学历材料,包您满意。
【业务选择办理准则】
一、工作未确定,回国需先给父母、亲戚朋友看下文凭的情况,办理一份就读学校的毕业证【微信:6496090】文凭即可
二、回国进私企、外企、自己做生意的情况,这些单位是不查询毕业证真伪的,而且国内没有渠道去查询国外文凭的真假,也不需要提供真实教育部认证。鉴于此,办理一份毕业证【微信:6496090】即可
三、进国企,银行,事业单位,考公务员等等,这些单位是必需要提供真实教育部认证的,办理教育部认证所需资料众多且烦琐,所有材料您都必须提供原件,我们凭借丰富的经验,快捷的绿色通道帮您快速整合材料,让您少走弯路。
留信网认证的作用:
1:该专业认证可证明留学生真实身份【微信:6496090】
2:同时对留学生所学专业登记给予评定
3:国家专业人才认证中心颁发入库证书
4:这个认证书并且可以归档倒地方
5:凡事获得留信网入网的信息将会逐步更新到个人身份内,将在公安局网内查询个人身份证信息后,同步读取人才网入库信息
6:个人职称评审加20分
7:个人信誉贷款加10分
8:在国家人才网主办的国家网络招聘大会中纳入资料,供国家高端企业选择人才
→ 【关于价格问题(保证一手价格)
我们所定的价格是非常合理的,而且我们现在做得单子大多数都是代理和回头客户介绍的所以一般现在有新的单子 我给客户的都是第一手的代理价格,因为我想坦诚对待大家 不想跟大家在价格方面浪费时间
对于老客户或者被老客户介绍过来的朋友,我们都会适当给一些优惠。
选择实体注册公司办理,更放心,更安全!我们的承诺:可来公司面谈,可签订合同,会陪同客户一起到教育部认证窗口递交认证材料,客户在教育部官方认证查询网站查询到认证通过结果后付款,不成功不收费!
办理阿肯色大学毕业证(UCSF毕业证书)【微信:6496090 】外观非常简单,由纸质材料制成,上面印有校徽、校名、毕业生姓名、专业等信息。
办理阿肯色大学毕业证(UCSF毕业证书)【微信:6496090 】格式相对统一,各专业都有相应的模板。通常包括以下部分:
校徽:象征着学校的荣誉和传承。
校名:学校英文全称
授予学位:本部分将注明获得的具体学位名称。
毕业生姓名:这是最重要的信息之一,标志着该证书是由特定人员获得的。
颁发日期:这是毕业正式生效的时间,也代表着毕业生学业的结束。
其他信息:根据不同的专业和学位,可能会有一些特定的信息或章节。
办理阿肯色大学毕业证(UCSF毕业证书)【微信:6496090 】价值很高,需要妥善保管。一般来说,应放置在安全、干燥、防潮的地方,避免长时间暴露在阳光下。如需使用,最好使用复印件而不是原件,以免丢失。
综上所述,办理阿肯色大学毕业证(UCSF毕业证书)【微信:6496090 】是证明身份和学历的高价值文件。外观简单庄重,格式统一,包括重要的个人信息和发布日期。对持有人来说,妥善保管是非常重要的。
一比一原版美国哥伦比亚大学毕业证Columbia成绩单一模一样
原件一模一样【微信:6496090】【美国哥伦比亚大学毕业证Columbia学位证成绩单】【微信:6496090】(留信学历认证永久存档查询)采用学校原版纸张、特殊工艺完全按照原版一比一制作(包括:隐形水印,阴影底纹,钢印LOGO烫金烫银,LOGO烫金烫银复合重叠,文字图案浮雕,激光镭射,紫外荧光,温感,复印防伪)行业标杆!精益求精,诚心合作,真诚制作!多年品质 ,按需精细制作,24小时接单,全套进口原装设备,十五年致力于帮助留学生解决难题,业务范围有加拿大、英国、澳洲、韩国、美国、新加坡,新西兰等学历材料,包您满意。
【业务选择办理准则】
一、工作未确定,回国需先给父母、亲戚朋友看下文凭的情况,办理一份就读学校的毕业证【微信:6496090】文凭即可
二、回国进私企、外企、自己做生意的情况,这些单位是不查询毕业证真伪的,而且国内没有渠道去查询国外文凭的真假,也不需要提供真实教育部认证。鉴于此,办理一份毕业证【微信:6496090】即可
三、进国企,银行,事业单位,考公务员等等,这些单位是必需要提供真实教育部认证的,办理教育部认证所需资料众多且烦琐,所有材料您都必须提供原件,我们凭借丰富的经验,快捷的绿色通道帮您快速整合材料,让您少走弯路。
留信网认证的作用:
1:该专业认证可证明留学生真实身份【微信:6496090】
2:同时对留学生所学专业登记给予评定
3:国家专业人才认证中心颁发入库证书
4:这个认证书并且可以归档倒地方
5:凡事获得留信网入网的信息将会逐步更新到个人身份内,将在公安局网内查询个人身份证信息后,同步读取人才网入库信息
6:个人职称评审加20分
7:个人信誉贷款加10分
8:在国家人才网主办的国家网络招聘大会中纳入资料,供国家高端企业选择人才
→ 【关于价格问题(保证一手价格)
我们所定的价格是非常合理的,而且我们现在做得单子大多数都是代理和回头客户介绍的所以一般现在有新的单子 我给客户的都是第一手的代理价格,因为我想坦诚对待大家 不想跟大家在价格方面浪费时间
对于老客户或者被老客户介绍过来的朋友,我们都会适当给一些优惠。
选择实体注册公司办理,更放心,更安全!我们的承诺:可来公司面谈,可签订合同,会陪同客户一起到教育部认证窗口递交认证材料,客户在教育部官方认证查询网站查询到认证通过结果后付款,不成功不收费!
办理美国哥伦比亚大学毕业证Columbia学位证【微信:6496090 】外观非常精致,由特殊纸质材料制成,上面印有校徽、校名、毕业生姓名、专业等信息。
办理美国哥伦比亚大学毕业证Columbia学位证【微信:6496090 】格式相对统一,各专业都有相应的模板。通常包括以下部分:
校徽:象征着学校的荣誉和传承。
校名:学校英文全称
授予学位:本部分将注明获得的具体学位名称。
毕业生姓名:这是最重要的信息之一,标志着该证书是由特定人员获得的。
颁发日期:这是毕业正式生效的时间,也代表着毕业生学业的结束。
其他信息:根据不同的专业和学位,可能会有一些特定的信息或章节。
办理美国哥伦比亚大学毕业证Columbia学位证【微信:6496090 】价值很高,需要妥善保管。一般来说,应放置在安全、干燥、防潮的地方,避免长时间暴露在阳光下。如需使用,最好使用复印件而不是原件,以免丢失。
综上所述,办理美国哥伦比亚大学毕业证Columbia学位证【微信:6496090 】是证明身份和学历的高价值文件。外观简单庄重,格式统一,包括重要的个人信息和发布日期。对持有人来说,妥善保管是非常重要的。
Impact of Fonts: in Web and Apps Design
Fonts play a crucial role in both User Interface (UI) and User Experience (UX) design. They affect readability, accessibility, aesthetics, and overall user perception.
ARENA - Young adults in the workplace (Knight Moves).pdf
Presentations of Bavo Raeymaekers (Project lead youth unemployment at the City of Antwerp), Suzan Martens (Service designer at Knight Moves) and Adriaan De Keersmaeker (Community manager at Talk to C)
during the 'Arena • Young adults in the workplace' conference hosted by Knight Moves.
SECURING BUILDING PERMIT CITY OF CALOOCAN.pdf
How to apply for building permit in the city of Caloocan?
What is a building permit?
Who applies for building permit?
International Upcycling Research Network advisory board meeting 4
Slides used for the International Upcycling Research Network advisory board 4 (last one). The project is based at De Montfort University in Leicester, UK, and funded by the Arts and Humanities Research Council.
More Related Content
Similar to Engl 396 infographics presentation
MELJUN CORTES research seminar_1_presentation_techniques
This document provides guidance on effective techniques for presenting data through graphics such as charts, graphs, and tables. It discusses principles of graphic excellence, such as communicating complex ideas clearly and efficiently. Rules for creating high-quality tables and charts are presented, including proper formatting, sourcing, and design elements. A variety of chart types like bar graphs, pie charts, and line graphs are described along with guidelines for choosing the appropriate format to illustrate different types of relationships in the data. The document cautions that while powerful, graphics can potentially mislead if not designed and presented truthfully.
Non – projected
Non-projected visuals such as still pictures, drawings, charts, and posters can translate abstract ideas into more concrete representations. They allow instruction to move from verbal symbols to a more visual level. These visuals are easy to use without equipment and can stimulate creative expression. Common types include still pictures, drawings, organizational charts, timelines, tables, flowcharts, bar graphs, pictorial graphs, circle graphs, line graphs, and posters. Cartoons also appeal to viewers through humor and satire.
Non – projected
Non-projected visuals such as still pictures, drawings, charts, and posters can translate abstract ideas into more concrete representations. They allow instruction to move from verbal symbols to a more visual level. These visuals are inexpensive and easy to use without additional equipment across different subjects and levels of instruction. They can be used to stimulate creative expression or for testing and evaluation. Common types include still pictures, drawings, organizational charts, timelines, tables, flowcharts, graphs like bar graphs and line graphs, as well as posters and cartoons.
Non – projected
Non-projected visuals such as still pictures, drawings, charts, and posters can translate abstract ideas into more concrete representations. They allow instruction to move from verbal symbols to a more visual level. These visuals are inexpensive and easy to use without equipment in many instructional contexts and disciplines. They can stimulate creative expression and be used for testing and evaluation. Common types include still pictures, drawings, organizational charts, timelines, tables, flowcharts, graphs like bar graphs and line graphs, and posters.
Friday Session #64: Key Recipes For Killer Infographics
A slidedeck presented at the 64th Cleverwood Friday Session. Feel free to visit our website for various other courses in digital media http://www.cleverwood.be/learning-hub
Diagramatic and graphical representation of data Notes on Statistics.ppt
Diagrams and graphical representations are essential tools for presenting statistical data in a simple and easy to understand way. There are different types of diagrams that can be used depending on the dataset, including line diagrams, bar diagrams, and pie charts. Graphical representations make data easier to comprehend, allow for comparisons, and are universally accepted. They improve the overall representation of data.
Visual Information writeup
This document discusses visual information and its importance in academic writing. It notes that visuals can help researchers organize and communicate ideas more effectively. Research shows people remember information presented visually much better than through words alone. Visual information includes photographs, videos, graphs, and other visual media. Tables and figures are commonly used types of visual information in academic writing to display statistical data, compare information, and illustrate concepts. Captions should be included to help readers interpret visuals. The document emphasizes that visuals have educational benefits like developing ideas, analyzing complex topics simply, and aiding communication and decision making.
Visual Presentations and Graphical Data
This document provides information on various visual presentation methods such as tabulated data, line graphs, bar graphs, Gantt charts, pictograms, maps, flow charts, pie charts, cartograms, visual planning boards, and computer graphics. It defines each method and provides examples. Key points covered include how tabulated data organizes large amounts of data for easy access and analysis, line graphs show changes over time, bar graphs allow for comparisons, and Gantt charts illustrate project schedules. The document also discusses best practices for visual presentations such as using a single clear font, ensuring images are legible, and that images serve a specific purpose rather than just being decorative.
Similar to Engl 396 infographics presentation (8)
MELJUN CORTES research seminar_1_presentation_techniques
MELJUN CORTES research seminar_1_presentation_techniques
Friday Session #64: Key Recipes For Killer Infographics
Friday Session #64: Key Recipes For Killer Infographics
Diagramatic and graphical representation of data Notes on Statistics.ppt
Diagramatic and graphical representation of data Notes on Statistics.ppt
Recently uploaded
定制美国西雅图城市大学毕业证学历证书原版一模一样
原版一模一样【微信:741003700 】【美国西雅图城市大学毕业证学历证书】【微信:741003700 】学位证,留信认证(真实可查,永久存档)offer、雅思、外壳等材料/诚信可靠,可直接看成品样本,帮您解决无法毕业带来的各种难题!外壳,原版制作,诚信可靠,可直接看成品样本。行业标杆!精益求精,诚心合作,真诚制作!多年品质 ,按需精细制作,24小时接单,全套进口原装设备。十五年致力于帮助留学生解决难题,包您满意。
本公司拥有海外各大学样板无数,能完美还原海外各大学 Bachelor Diploma degree, Master Degree Diploma
1:1完美还原海外各大学毕业材料上的工艺:水印,阴影底纹,钢印LOGO烫金烫银,LOGO烫金烫银复合重叠。文字图案浮雕、激光镭射、紫外荧光、温感、复印防伪等防伪工艺。材料咨询办理、认证咨询办理请加学历顾问Q/微741003700
留信网认证的作用:
1:该专业认证可证明留学生真实身份
2:同时对留学生所学专业登记给予评定
3:国家专业人才认证中心颁发入库证书
4:这个认证书并且可以归档倒地方
5:凡事获得留信网入网的信息将会逐步更新到个人身份内,将在公安局网内查询个人身份证信息后,同步读取人才网入库信息
6:个人职称评审加20分
7:个人信誉贷款加10分
8:在国家人才网主办的国家网络招聘大会中纳入资料,供国家高端企业选择人才
Manual ISH (International Society of Hypertension)
Manual ISH (International Society of Hypertension)
Practical eLearning Makeovers for Everyone
Welcome to Practical eLearning Makeovers for Everyone. In this presentation, we’ll take a look at a bunch of easy-to-use visual design tips and tricks. And we’ll do this by using them to spruce up some eLearning screens that are in dire need of a new look.
Discovering the Best Indian Architects A Spotlight on Design Forum Internatio...
Discovering the Best Indian Architects A Spotlight on Design Forum Internatio...Designforuminternational
India’s architectural landscape is a vibrant tapestry that weaves together the country's rich cultural heritage and its modern aspirations. From majestic historical structures to cutting-edge contemporary designs, the work of Indian architects is celebrated worldwide. Among the many firms shaping this dynamic field, Design Forum International stands out as a leader in innovative and sustainable architecture. This blog explores some of the best Indian architects, highlighting their contributions and showcasing the most famous architects in India.一比一原版阿肯色大学毕业证(UCSF毕业证书)如何办理
学校原件一模一样【微信:6496090】【阿肯色大学毕业证(UCSF毕业证书)成绩单学位证】【微信:6496090】(留信学历认证永久存档查询)采用学校原版纸张、特殊工艺完全按照原版一比一制作(包括:隐形水印,阴影底纹,钢印LOGO烫金烫银,LOGO烫金烫银复合重叠,文字图案浮雕,激光镭射,紫外荧光,温感,复印防伪)行业标杆!精益求精,诚心合作,真诚制作!多年品质 ,按需精细制作,24小时接单,全套进口原装设备,十五年致力于帮助留学生解决难题,业务范围有加拿大、英国、澳洲、韩国、美国、新加坡,新西兰等学历材料,包您满意。
【业务选择办理准则】
一、工作未确定,回国需先给父母、亲戚朋友看下文凭的情况,办理一份就读学校的毕业证【微信:6496090】文凭即可
二、回国进私企、外企、自己做生意的情况,这些单位是不查询毕业证真伪的,而且国内没有渠道去查询国外文凭的真假,也不需要提供真实教育部认证。鉴于此,办理一份毕业证【微信:6496090】即可
三、进国企,银行,事业单位,考公务员等等,这些单位是必需要提供真实教育部认证的,办理教育部认证所需资料众多且烦琐,所有材料您都必须提供原件,我们凭借丰富的经验,快捷的绿色通道帮您快速整合材料,让您少走弯路。
留信网认证的作用:
1:该专业认证可证明留学生真实身份【微信:6496090】
2:同时对留学生所学专业登记给予评定
3:国家专业人才认证中心颁发入库证书
4:这个认证书并且可以归档倒地方
5:凡事获得留信网入网的信息将会逐步更新到个人身份内,将在公安局网内查询个人身份证信息后,同步读取人才网入库信息
6:个人职称评审加20分
7:个人信誉贷款加10分
8:在国家人才网主办的国家网络招聘大会中纳入资料,供国家高端企业选择人才
→ 【关于价格问题(保证一手价格)
我们所定的价格是非常合理的,而且我们现在做得单子大多数都是代理和回头客户介绍的所以一般现在有新的单子 我给客户的都是第一手的代理价格,因为我想坦诚对待大家 不想跟大家在价格方面浪费时间
对于老客户或者被老客户介绍过来的朋友,我们都会适当给一些优惠。
选择实体注册公司办理,更放心,更安全!我们的承诺:可来公司面谈,可签订合同,会陪同客户一起到教育部认证窗口递交认证材料,客户在教育部官方认证查询网站查询到认证通过结果后付款,不成功不收费!
办理阿肯色大学毕业证(UCSF毕业证书)【微信:6496090 】外观非常简单,由纸质材料制成,上面印有校徽、校名、毕业生姓名、专业等信息。
办理阿肯色大学毕业证(UCSF毕业证书)【微信:6496090 】格式相对统一,各专业都有相应的模板。通常包括以下部分:
校徽:象征着学校的荣誉和传承。
校名:学校英文全称
授予学位:本部分将注明获得的具体学位名称。
毕业生姓名:这是最重要的信息之一,标志着该证书是由特定人员获得的。
颁发日期:这是毕业正式生效的时间,也代表着毕业生学业的结束。
其他信息:根据不同的专业和学位,可能会有一些特定的信息或章节。
办理阿肯色大学毕业证(UCSF毕业证书)【微信:6496090 】价值很高,需要妥善保管。一般来说,应放置在安全、干燥、防潮的地方,避免长时间暴露在阳光下。如需使用,最好使用复印件而不是原件,以免丢失。
综上所述,办理阿肯色大学毕业证(UCSF毕业证书)【微信:6496090 】是证明身份和学历的高价值文件。外观简单庄重,格式统一,包括重要的个人信息和发布日期。对持有人来说,妥善保管是非常重要的。
一比一原版美国哥伦比亚大学毕业证Columbia成绩单一模一样
原件一模一样【微信:6496090】【美国哥伦比亚大学毕业证Columbia学位证成绩单】【微信:6496090】(留信学历认证永久存档查询)采用学校原版纸张、特殊工艺完全按照原版一比一制作(包括:隐形水印,阴影底纹,钢印LOGO烫金烫银,LOGO烫金烫银复合重叠,文字图案浮雕,激光镭射,紫外荧光,温感,复印防伪)行业标杆!精益求精,诚心合作,真诚制作!多年品质 ,按需精细制作,24小时接单,全套进口原装设备,十五年致力于帮助留学生解决难题,业务范围有加拿大、英国、澳洲、韩国、美国、新加坡,新西兰等学历材料,包您满意。
【业务选择办理准则】
一、工作未确定,回国需先给父母、亲戚朋友看下文凭的情况,办理一份就读学校的毕业证【微信:6496090】文凭即可
二、回国进私企、外企、自己做生意的情况,这些单位是不查询毕业证真伪的,而且国内没有渠道去查询国外文凭的真假,也不需要提供真实教育部认证。鉴于此,办理一份毕业证【微信:6496090】即可
三、进国企,银行,事业单位,考公务员等等,这些单位是必需要提供真实教育部认证的,办理教育部认证所需资料众多且烦琐,所有材料您都必须提供原件,我们凭借丰富的经验,快捷的绿色通道帮您快速整合材料,让您少走弯路。
留信网认证的作用:
1:该专业认证可证明留学生真实身份【微信:6496090】
2:同时对留学生所学专业登记给予评定
3:国家专业人才认证中心颁发入库证书
4:这个认证书并且可以归档倒地方
5:凡事获得留信网入网的信息将会逐步更新到个人身份内,将在公安局网内查询个人身份证信息后,同步读取人才网入库信息
6:个人职称评审加20分
7:个人信誉贷款加10分
8:在国家人才网主办的国家网络招聘大会中纳入资料,供国家高端企业选择人才
→ 【关于价格问题(保证一手价格)
我们所定的价格是非常合理的,而且我们现在做得单子大多数都是代理和回头客户介绍的所以一般现在有新的单子 我给客户的都是第一手的代理价格,因为我想坦诚对待大家 不想跟大家在价格方面浪费时间
对于老客户或者被老客户介绍过来的朋友,我们都会适当给一些优惠。
选择实体注册公司办理,更放心,更安全!我们的承诺:可来公司面谈,可签订合同,会陪同客户一起到教育部认证窗口递交认证材料,客户在教育部官方认证查询网站查询到认证通过结果后付款,不成功不收费!
办理美国哥伦比亚大学毕业证Columbia学位证【微信:6496090 】外观非常精致,由特殊纸质材料制成,上面印有校徽、校名、毕业生姓名、专业等信息。
办理美国哥伦比亚大学毕业证Columbia学位证【微信:6496090 】格式相对统一,各专业都有相应的模板。通常包括以下部分:
校徽:象征着学校的荣誉和传承。
校名:学校英文全称
授予学位:本部分将注明获得的具体学位名称。
毕业生姓名:这是最重要的信息之一,标志着该证书是由特定人员获得的。
颁发日期:这是毕业正式生效的时间,也代表着毕业生学业的结束。
其他信息:根据不同的专业和学位,可能会有一些特定的信息或章节。
办理美国哥伦比亚大学毕业证Columbia学位证【微信:6496090 】价值很高,需要妥善保管。一般来说,应放置在安全、干燥、防潮的地方,避免长时间暴露在阳光下。如需使用,最好使用复印件而不是原件,以免丢失。
综上所述,办理美国哥伦比亚大学毕业证Columbia学位证【微信:6496090 】是证明身份和学历的高价值文件。外观简单庄重,格式统一,包括重要的个人信息和发布日期。对持有人来说,妥善保管是非常重要的。
Impact of Fonts: in Web and Apps Design
Fonts play a crucial role in both User Interface (UI) and User Experience (UX) design. They affect readability, accessibility, aesthetics, and overall user perception.
ARENA - Young adults in the workplace (Knight Moves).pdf
Presentations of Bavo Raeymaekers (Project lead youth unemployment at the City of Antwerp), Suzan Martens (Service designer at Knight Moves) and Adriaan De Keersmaeker (Community manager at Talk to C)
during the 'Arena • Young adults in the workplace' conference hosted by Knight Moves.
SECURING BUILDING PERMIT CITY OF CALOOCAN.pdf
How to apply for building permit in the city of Caloocan?
What is a building permit?
Who applies for building permit?
International Upcycling Research Network advisory board meeting 4
Slides used for the International Upcycling Research Network advisory board 4 (last one). The project is based at De Montfort University in Leicester, UK, and funded by the Arts and Humanities Research Council.
AHMED TALAAT ARCHITECTURE PORTFOLIO .pdf
Architectural and constructions management experience since 2003 including 18 years located in UAE.
Coordinate and oversee all technical activities relating to architectural and construction projects,
including directing the design team, reviewing drafts and computer models, and approving design
changes.
Organize and typically develop, and review building plans, ensuring that a project meets all safety and
environmental standards.
Prepare feasibility studies, construction contracts, and tender documents with specifications and
tender analyses.
Consulting with clients, work on formulating equipment and labor cost estimates, ensuring a project
meets environmental, safety, structural, zoning, and aesthetic standards.
Monitoring the progress of a project to assess whether or not it is in compliance with building plans
and project deadlines.
Attention to detail, exceptional time management, and strong problem-solving and communication
skills are required for this role.
一比一原版肯特大学毕业证UKC成绩单一模一样
原件一模一样【微信:6496090】【肯特大学毕业证UKC学位证成绩单】【微信:6496090】(留信学历认证永久存档查询)采用学校原版纸张、特殊工艺完全按照原版一比一制作(包括:隐形水印,阴影底纹,钢印LOGO烫金烫银,LOGO烫金烫银复合重叠,文字图案浮雕,激光镭射,紫外荧光,温感,复印防伪)行业标杆!精益求精,诚心合作,真诚制作!多年品质 ,按需精细制作,24小时接单,全套进口原装设备,十五年致力于帮助留学生解决难题,业务范围有加拿大、英国、澳洲、韩国、美国、新加坡,新西兰等学历材料,包您满意。
【业务选择办理准则】
一、工作未确定,回国需先给父母、亲戚朋友看下文凭的情况,办理一份就读学校的毕业证【微信:6496090】文凭即可
二、回国进私企、外企、自己做生意的情况,这些单位是不查询毕业证真伪的,而且国内没有渠道去查询国外文凭的真假,也不需要提供真实教育部认证。鉴于此,办理一份毕业证【微信:6496090】即可
三、进国企,银行,事业单位,考公务员等等,这些单位是必需要提供真实教育部认证的,办理教育部认证所需资料众多且烦琐,所有材料您都必须提供原件,我们凭借丰富的经验,快捷的绿色通道帮您快速整合材料,让您少走弯路。
留信网认证的作用:
1:该专业认证可证明留学生真实身份【微信:6496090】
2:同时对留学生所学专业登记给予评定
3:国家专业人才认证中心颁发入库证书
4:这个认证书并且可以归档倒地方
5:凡事获得留信网入网的信息将会逐步更新到个人身份内,将在公安局网内查询个人身份证信息后,同步读取人才网入库信息
6:个人职称评审加20分
7:个人信誉贷款加10分
8:在国家人才网主办的国家网络招聘大会中纳入资料,供国家高端企业选择人才
→ 【关于价格问题(保证一手价格)
我们所定的价格是非常合理的,而且我们现在做得单子大多数都是代理和回头客户介绍的所以一般现在有新的单子 我给客户的都是第一手的代理价格,因为我想坦诚对待大家 不想跟大家在价格方面浪费时间
对于老客户或者被老客户介绍过来的朋友,我们都会适当给一些优惠。
选择实体注册公司办理,更放心,更安全!我们的承诺:可来公司面谈,可签订合同,会陪同客户一起到教育部认证窗口递交认证材料,客户在教育部官方认证查询网站查询到认证通过结果后付款,不成功不收费!
办理肯特大学毕业证UKC学位证【微信:6496090 】外观非常精致,由特殊纸质材料制成,上面印有校徽、校名、毕业生姓名、专业等信息。
办理肯特大学毕业证UKC学位证【微信:6496090 】格式相对统一,各专业都有相应的模板。通常包括以下部分:
校徽:象征着学校的荣誉和传承。
校名:学校英文全称
授予学位:本部分将注明获得的具体学位名称。
毕业生姓名:这是最重要的信息之一,标志着该证书是由特定人员获得的。
颁发日期:这是毕业正式生效的时间,也代表着毕业生学业的结束。
其他信息:根据不同的专业和学位,可能会有一些特定的信息或章节。
办理肯特大学毕业证UKC学位证【微信:6496090 】价值很高,需要妥善保管。一般来说,应放置在安全、干燥、防潮的地方,避免长时间暴露在阳光下。如需使用,最好使用复印件而不是原件,以免丢失。
综上所述,办理肯特大学毕业证UKC学位证【微信:6496090 】是证明身份和学历的高价值文件。外观简单庄重,格式统一,包括重要的个人信息和发布日期。对持有人来说,妥善保管是非常重要的。
一比一原版(LSBU毕业证书)伦敦南岸大学毕业证如何办理
学校原件一模一样【微信:6496090 】【(LSBU毕业证书)伦敦南岸大学毕业证成绩单】【微信:6496090 】学位证,留信认证(真实可查,永久存档)原件一模一样纸张工艺/offer、雅思、外壳等材料/诚信可靠,可直接看成品样本,帮您解决无法毕业带来的各种难题!外壳,原版制作,诚信可靠,可直接看成品样本。行业标杆!精益求精,诚心合作,真诚制作!多年品质 ,按需精细制作,24小时接单,全套进口原装设备。十五年致力于帮助留学生解决难题,包您满意。
本公司拥有海外各大学样板无数,能完美还原。
1:1完美还原海外各大学毕业材料上的工艺:水印,阴影底纹,钢印LOGO烫金烫银,LOGO烫金烫银复合重叠。文字图案浮雕、激光镭射、紫外荧光、温感、复印防伪等防伪工艺。材料咨询办理、认证咨询办理请加学历顾问Q/微6496090
【主营项目】
一.毕业证【q微6496090】成绩单、使馆认证、教育部认证、雅思托福成绩单、学生卡等!
二.真实使馆公证(即留学回国人员证明,不成功不收费)
三.真实教育部学历学位认证(教育部存档!教育部留服网站永久可查)
四.办理各国各大学文凭(一对一专业服务,可全程监控跟踪进度)
如果您处于以下几种情况:
◇在校期间,因各种原因未能顺利毕业……拿不到官方毕业证【q/微6496090】
◇面对父母的压力,希望尽快拿到;
◇不清楚认证流程以及材料该如何准备;
◇回国时间很长,忘记办理;
◇回国马上就要找工作,办给用人单位看;
◇企事业单位必须要求办理的
◇需要报考公务员、购买免税车、落转户口
◇申请留学生创业基金
留信网认证的作用:
1:该专业认证可证明留学生真实身份
2:同时对留学生所学专业登记给予评定
3:国家专业人才认证中心颁发入库证书
4:这个认证书并且可以归档倒地方
5:凡事获得留信网入网的信息将会逐步更新到个人身份内,将在公安局网内查询个人身份证信息后,同步读取人才网入库信息
6:个人职称评审加20分
7:个人信誉贷款加10分
8:在国家人才网主办的国家网络招聘大会中纳入资料,供国家高端企业选择人才
办理(LSBU毕业证书)伦敦南岸大学毕业证【微信:6496090 】外观非常简单,由纸质材料制成,上面印有校徽、校名、毕业生姓名、专业等信息。
办理(LSBU毕业证书)伦敦南岸大学毕业证【微信:6496090 】格式相对统一,各专业都有相应的模板。通常包括以下部分:
校徽:象征着学校的荣誉和传承。
校名:学校英文全称
授予学位:本部分将注明获得的具体学位名称。
毕业生姓名:这是最重要的信息之一,标志着该证书是由特定人员获得的。
颁发日期:这是毕业正式生效的时间,也代表着毕业生学业的结束。
其他信息:根据不同的专业和学位,可能会有一些特定的信息或章节。
办理(LSBU毕业证书)伦敦南岸大学毕业证【微信:6496090 】价值很高,需要妥善保管。一般来说,应放置在安全、干燥、防潮的地方,避免长时间暴露在阳光下。如需使用,最好使用复印件而不是原件,以免丢失。
综上所述,办理(LSBU毕业证书)伦敦南岸大学毕业证【微信:6496090 】是证明身份和学历的高价值文件。外观简单庄重,格式统一,包括重要的个人信息和发布日期。对持有人来说,妥善保管是非常重要的。
Divertidamente SLIDE.pptxufururururuhrurid8dj
Hsuehebvdhdueuw8wiiwieih3udud8e8wisbdydvw7wbidj38ehehdheuwjhdiwjwieheheueurhryrurhrgryd7eueue
Timeless Principles of Good Design
Timeless Principles of Good Design from my 2015 Presentation at TYPO SF
Graphic Design Tools and Software .pptx
Explore the essential graphic design tools and software that can elevate your creative projects. Discover industry favorites and innovative solutions for stunning design results.
Recently uploaded (20)
Manual ISH (International Society of Hypertension)
Manual ISH (International Society of Hypertension)
Discovering the Best Indian Architects A Spotlight on Design Forum Internatio...
Discovering the Best Indian Architects A Spotlight on Design Forum Internatio...
Virtual Tour Application Powerpoint for museum of edinburgh
Virtual Tour Application Powerpoint for museum of edinburgh
Introduction to User experience design for beginner
Introduction to User experience design for beginner
ARENA - Young adults in the workplace (Knight Moves).pdf
ARENA - Young adults in the workplace (Knight Moves).pdf
International Upcycling Research Network advisory board meeting 4
International Upcycling Research Network advisory board meeting 4
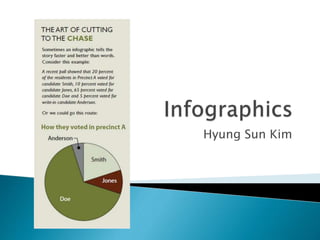
Engl 396 infographics presentation
- 2. Information graphics Visual representation of information and data Maximum information in minimum space Complex information simplified via visual aid
- 4. Communicating information quickly and efficiently Text is too complicated or tedious to absorb Audience is unable to read or hear information “A picture is worth a thousand words”
- 5. Text Images and colour graphics Audio and sound effects Animation and 3D effects Interactivity
- 7. Tweet an infographic and briefly explain what makes it efficient and/or appealing.
- 8. Text boxes (e.g. profile, comparison) Charts and graphs (e.g. pie chart, bar graph, scatter plot, line graph) Tables (e.g. statistical, numerical) Diagrams (e.g. figures, cutaway illustration) Maps (e.g. geological, statistical) Sequences (e.g. flowchart, timelines, how-tos)
- 10. Factual information from credible sources All sources must be cited Always consider bias of the source in data Present data clearly and objectively
- 11. Make sure it is a stand-alone presentation Do thorough research on the topic Keep in mind elements of a good layout • Structure and cohesion • Colour and white space • Alignment and unity etc.
- 12. http://sdrscreative.com/michaelseiders/wp- content/uploads/Conan-infographic-2-01.jpg https://infographiclist.files.wordpress.com/2011 /09/infographic.png http://33.media.tumblr.com/702f2bc0f31d91ba 9c5b67b7293bd8d8/tumblr_nj3v6zGsxy1rasnq9 o1_540.gif http://www.mun.ca/biology/scarr/timelineHGP_i mage2.jpg http://www- tc.pbs.org/wnet/nature/files/2013/04/How-to- Compost-Poster-New.png