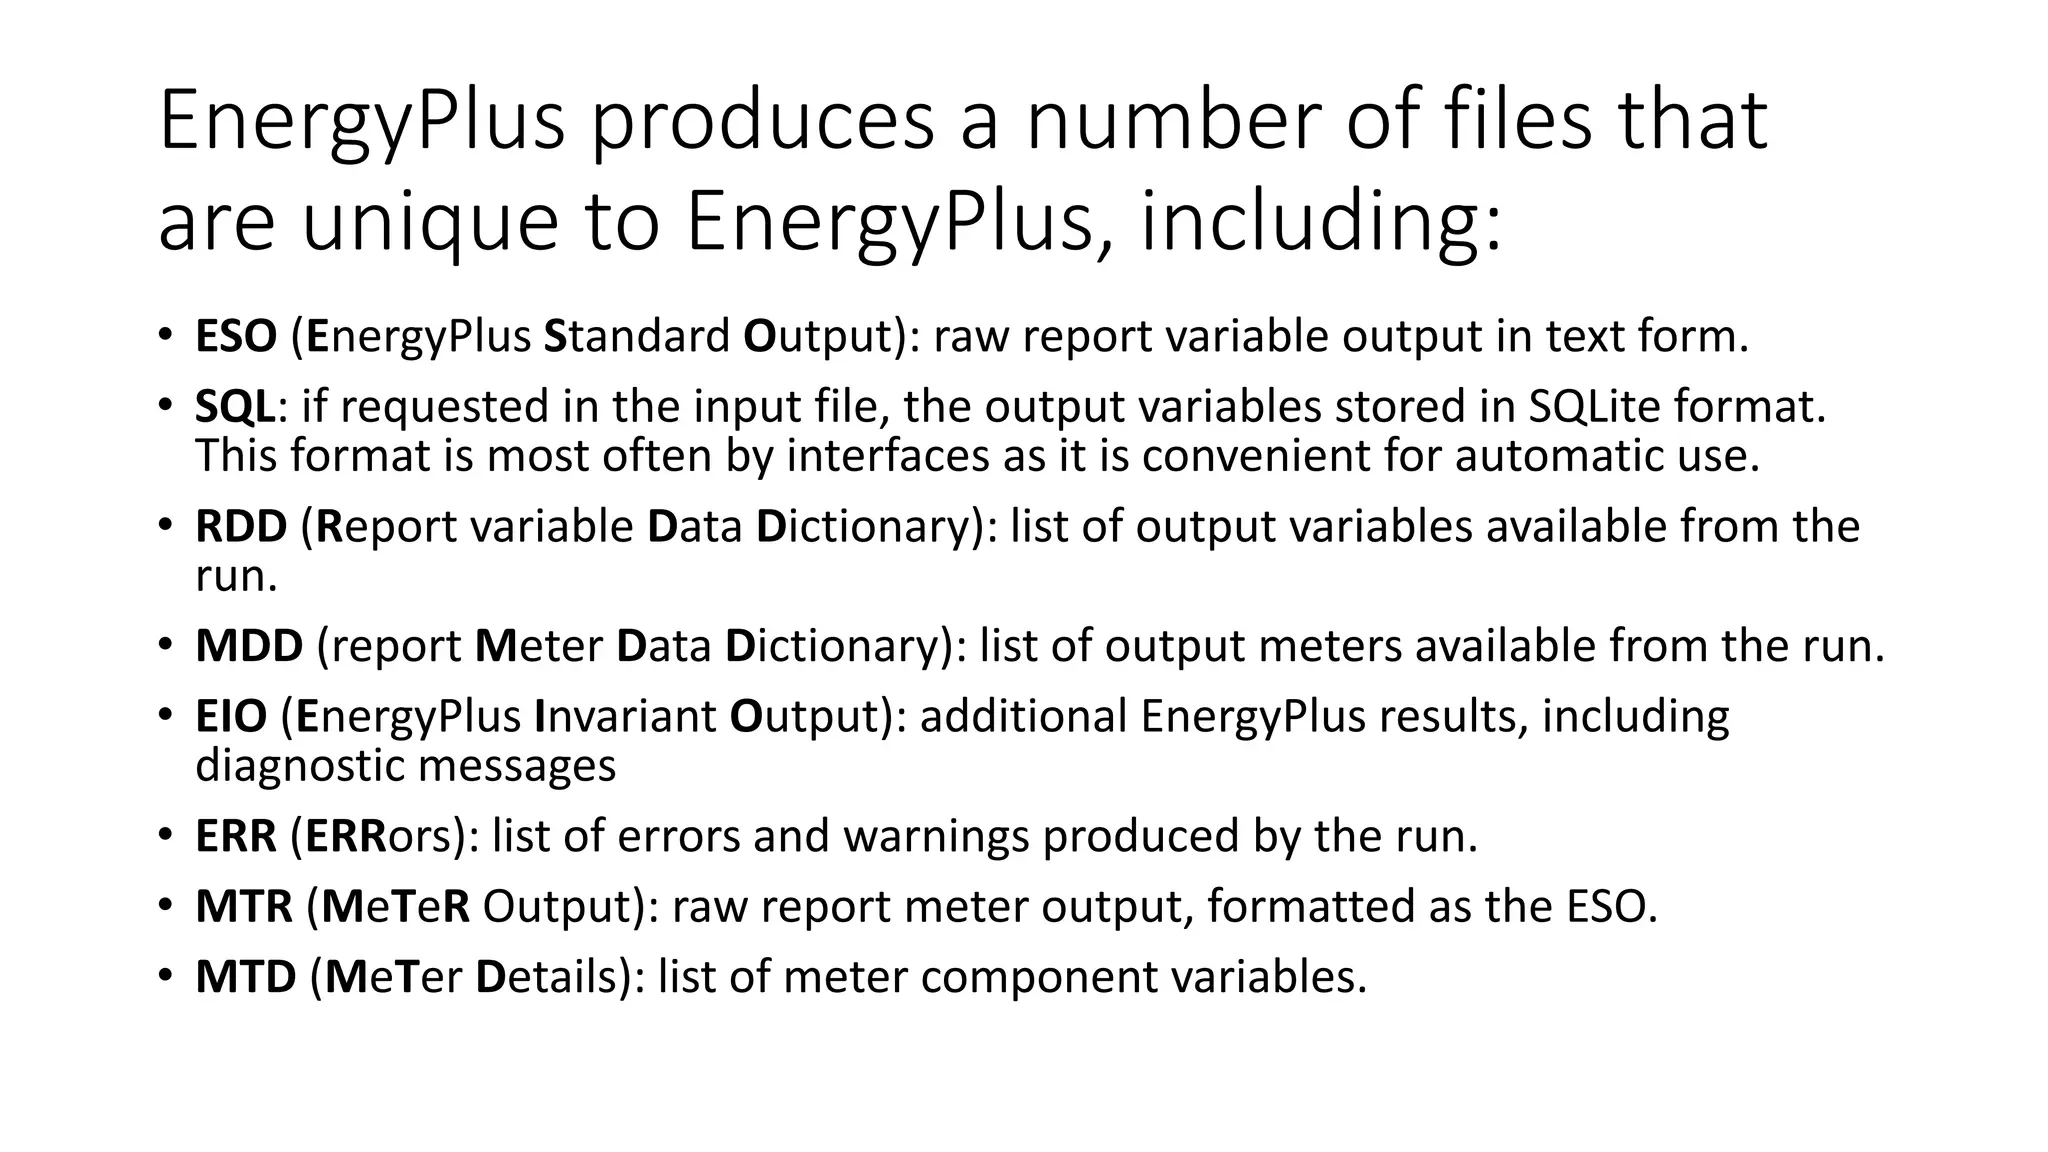
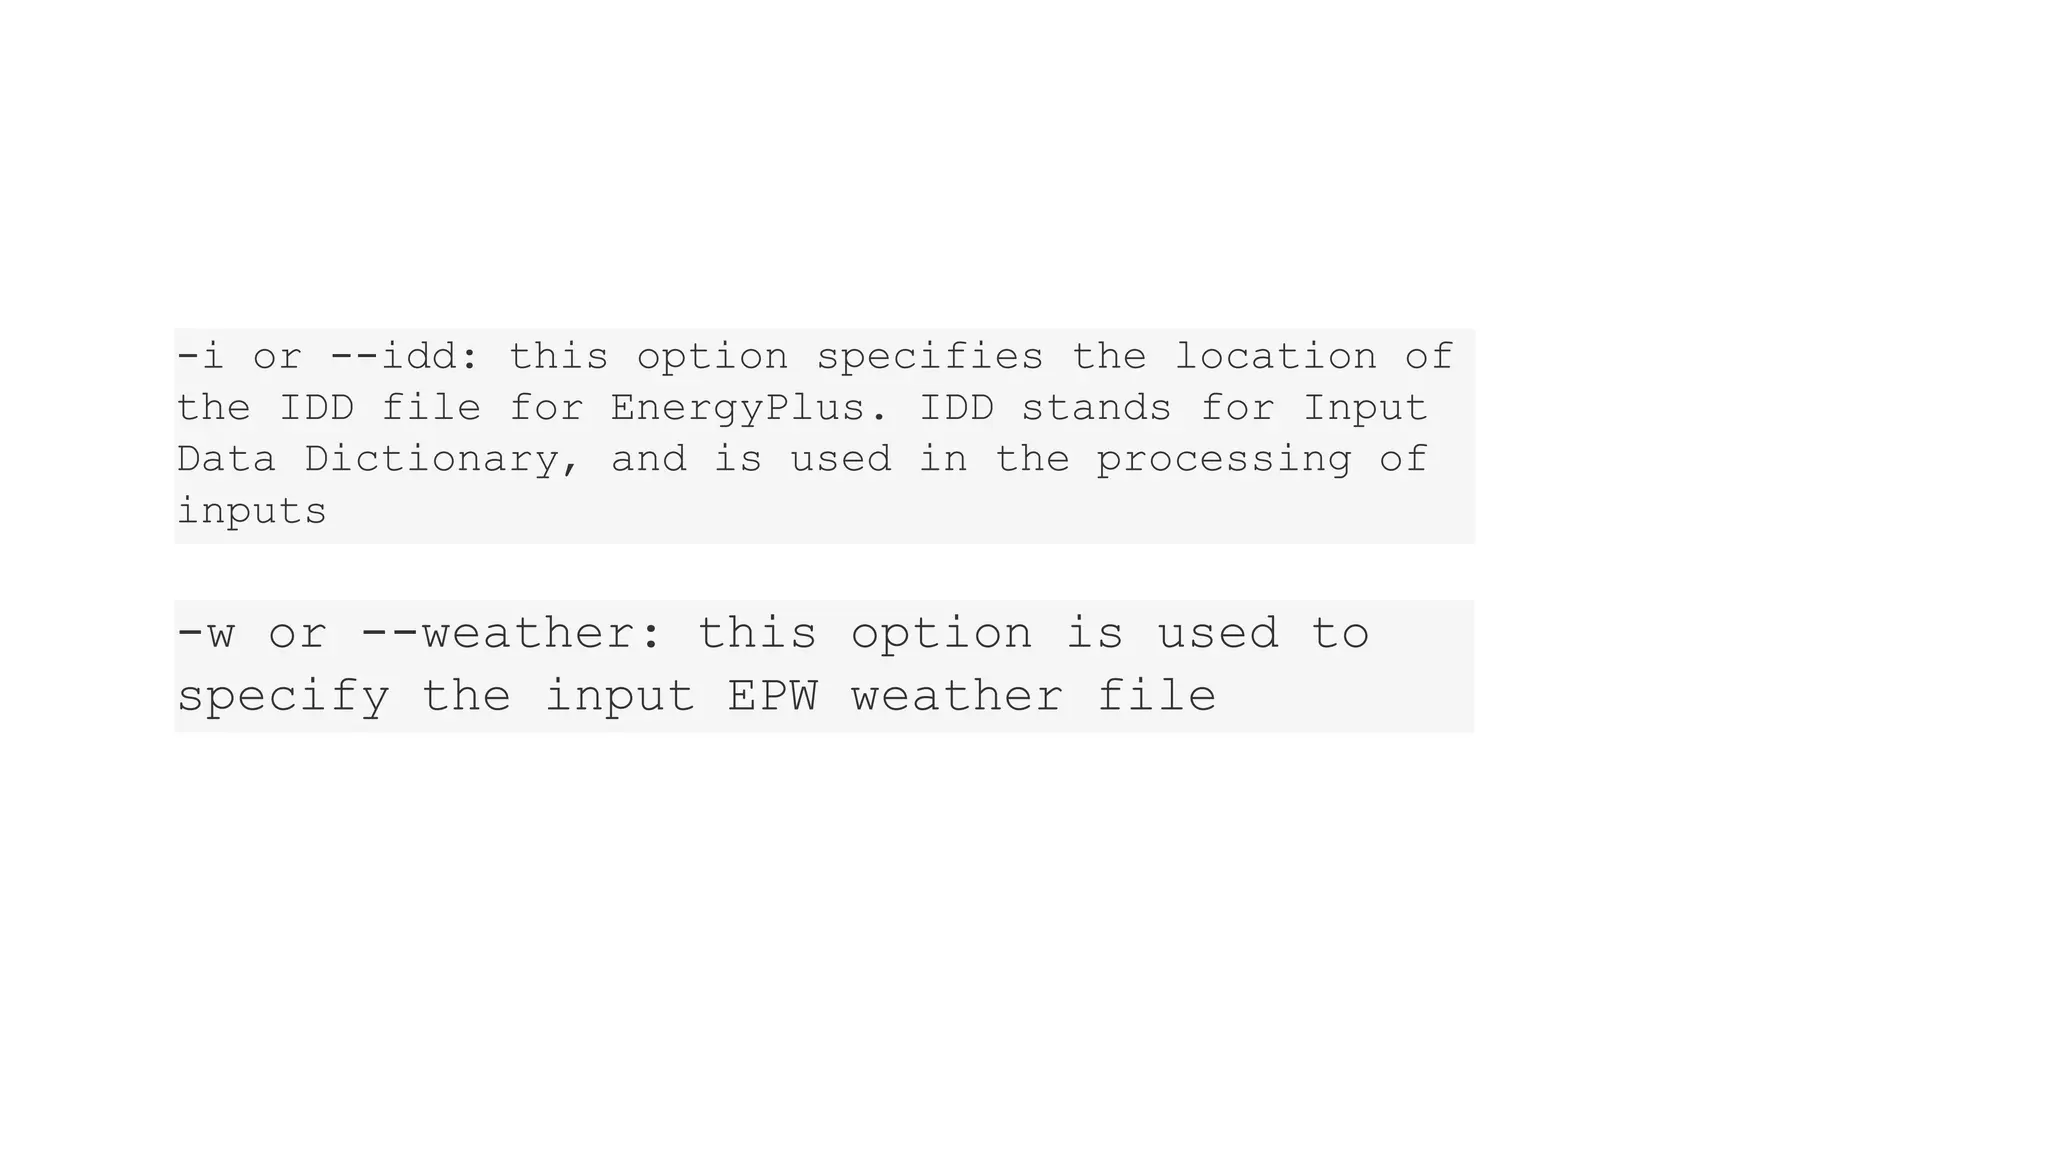
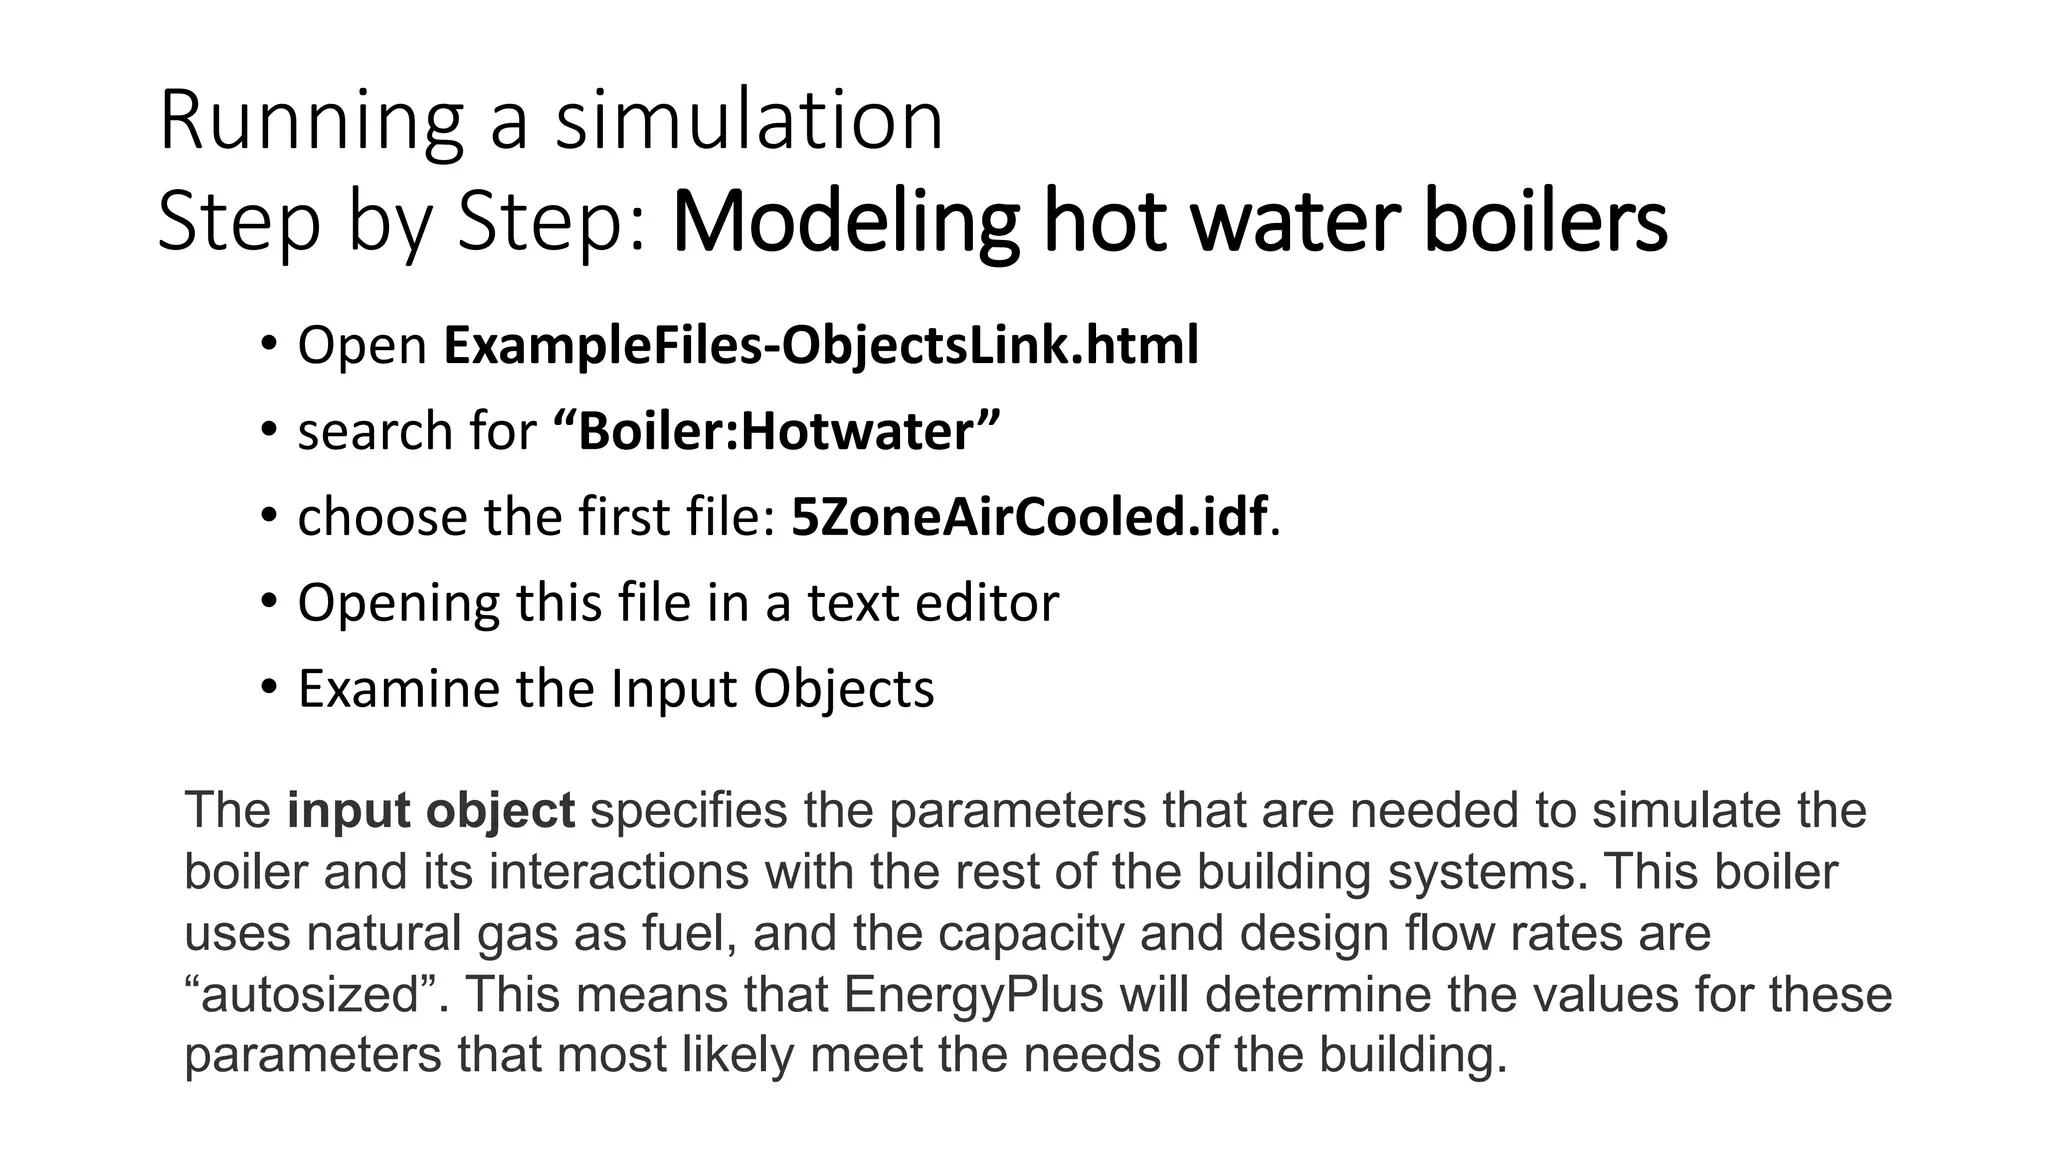
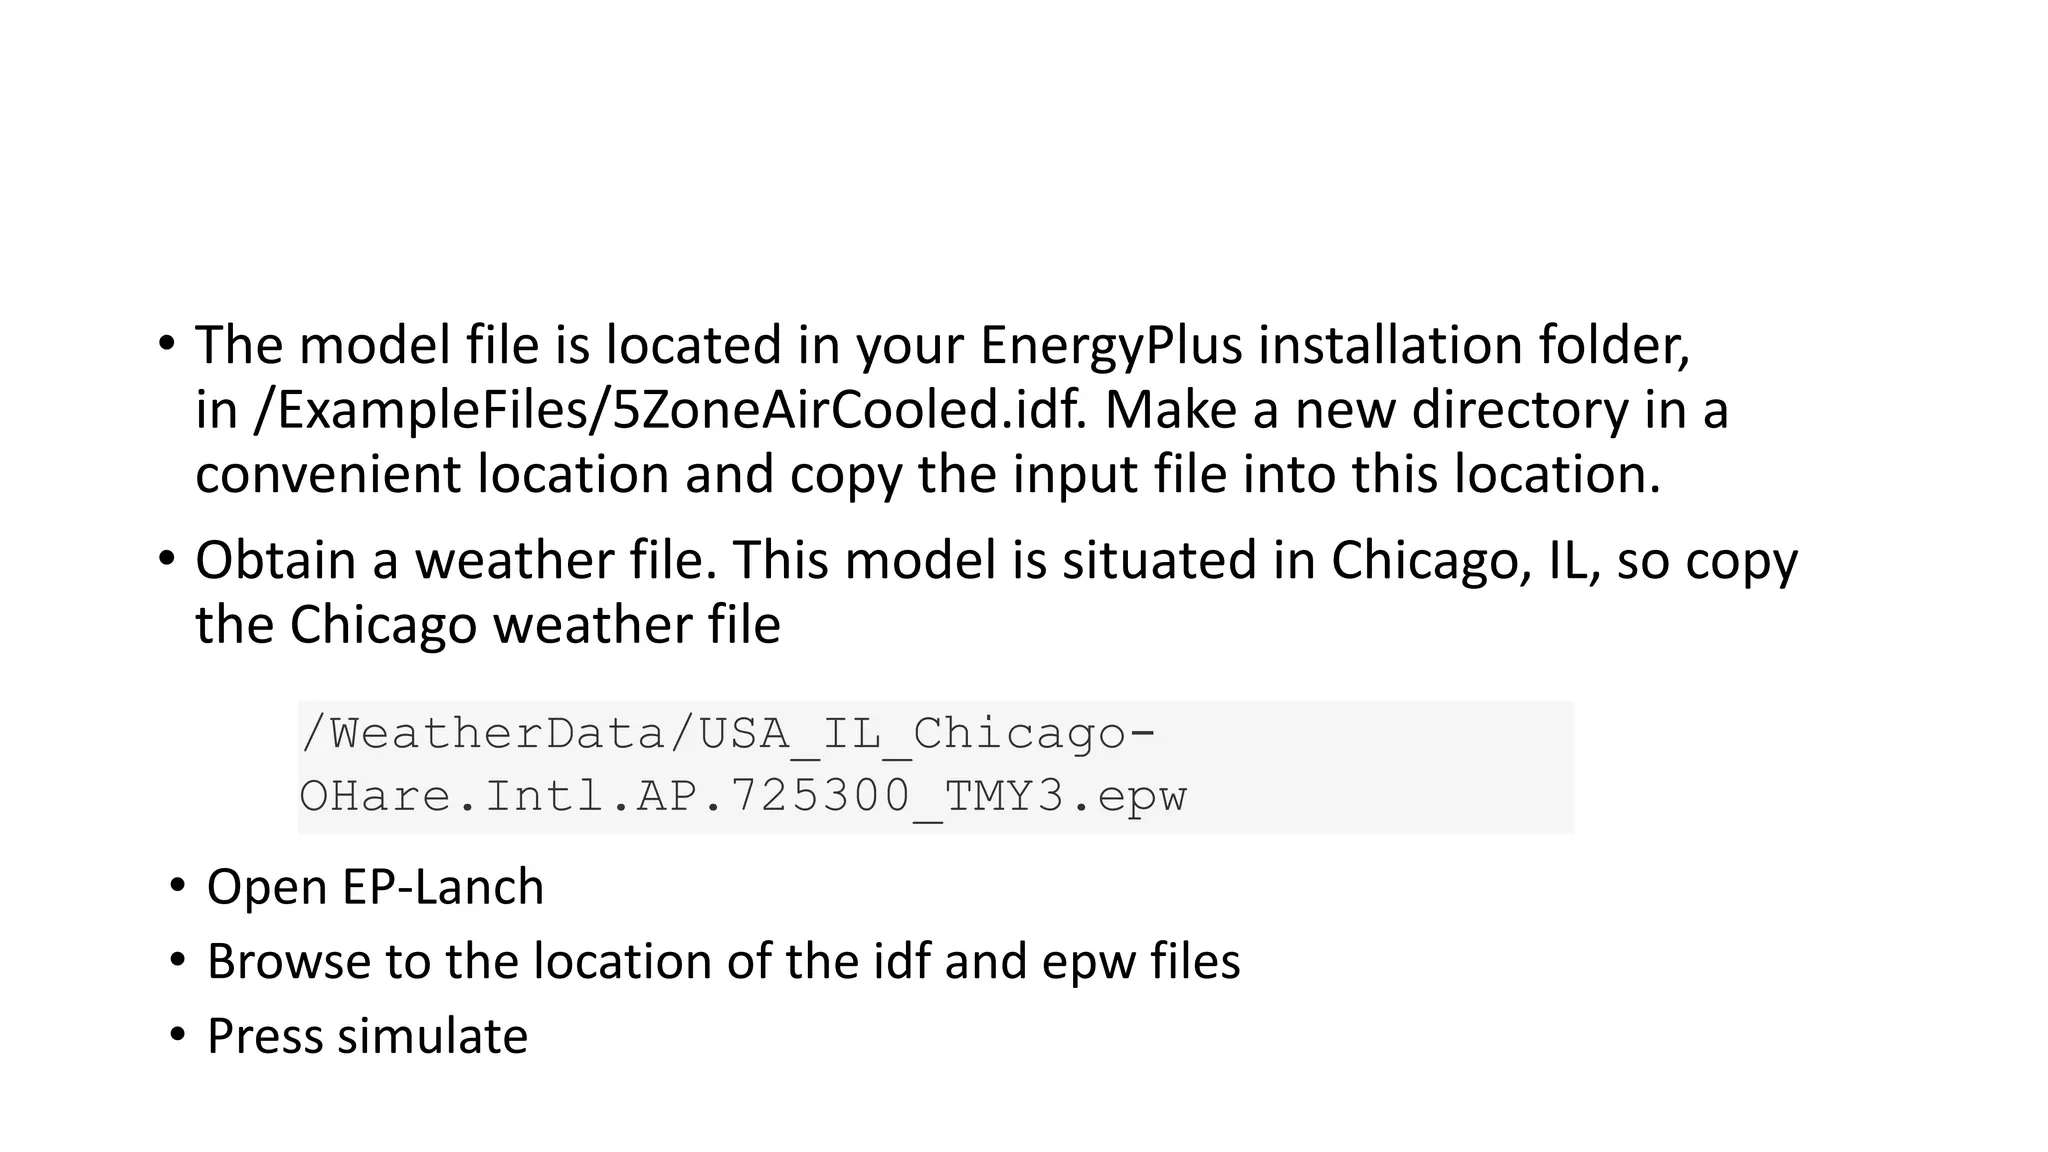
Boiler Modeling in
EnergyPlus
EnergyPLus
• EnergyPlus is a command line tool that takes input files and produces
output files. The general model for running EnergyPlus is:
• Collect -Collect information on the building to be modeled (building
size and shape, mechanical system details, etc.)
• Author-Author the input files
• Run -Run EnergyPlus (simple models may take only minutes; complex
models may take many hours)
• Analyze -Analyze the outputs
2 input files will need to be supplied as
inputs:
• IDF building model description file: The primary way model inputs
are communicated to EnergyPlus are through the Input Data File
(IDF). This file is a plain text file that contains a set of objects that
represent the building and associated systems. See the “Input Output
Reference” in the EnergyPlus documentation for many more details.
• EPW weather file: Weather plays an extremely important role in the
energy use of buildings, and most EnergyPlus simulations use
weather inputs from an EnergyPlus Weather (EPW) file. This file is
also a plain text file that contains weather information. The file
format is documented in the “Auxiliary Program Guide”
documentation. EnergyPlus ships with Typical Meteorological Year
(TMY) weather files for a number of locations in the United States and
additional weather files are available from other sources, including
the EnergyPlus website (energyplus.net).
• Running EnergyPlus with these two files will produce a set of output
files which are used in the final step, analysis of results. Which files
are produced depends on exactly how the program is run and what is
in the input file. If EnergyPlus is run via an interface, the interface may
intercept some of the output files and reformat them.
EnergyPlus produces a number of files that
are unique to EnergyPlus, including:
• ESO (EnergyPlus Standard Output): raw report variable output in text form.
• SQL: if requested in the input file, the output variables stored in SQLite format.
This format is most often by interfaces as it is convenient for automatic use.
• RDD (Report variable Data Dictionary): list of output variables available from the
run.
• MDD (report Meter Data Dictionary): list of output meters available from the run.
• EIO (EnergyPlus Invariant Output): additional EnergyPlus results, including
diagnostic messages
• ERR (ERRors): list of errors and warnings produced by the run.
• MTR (MeTeR Output): raw report meter output, formatted as the ESO.
• MTD (MeTer Details): list of meter component variables.
Command Line Interface
• EnergyPlus is a console-based tool, so it can be executed from a
console or terminal. Assuming that is your EnergyPlus installation
path and $ is the prompt, executing
$/energyplus --help
will cause EnergyPlus to list all of the command line
options available
-i or --idd: this option specifies the location of
the IDD file for EnergyPlus. IDD stands for Input
Data Dictionary, and is used in the processing of
inputs
-w or --weather: this option is used to
specify the input EPW weather file
• Assuming you have an input file named “mymodel.idf” and an EPW
file named “myweather.epw” in your working directory, running the
model is accomplished with:
$/energyplus --idd /EnergyPlus.idd --weather
myweather.epw mymodel.idf
This will result in outputs stored in the working directory.
Running a simulation
Step by Step: Modeling hot water boilers
• Open ExampleFiles-ObjectsLink.html
• search for “Boiler:Hotwater”
• choose the first file: 5ZoneAirCooled.idf.
• Opening this file in a text editor
• Examine the Input Objects
The input object specifies the parameters that are needed to simulate the
boiler and its interactions with the rest of the building systems. This boiler
uses natural gas as fuel, and the capacity and design flow rates are
“autosized”. This means that EnergyPlus will determine the values for these
parameters that most likely meet the needs of the building.
• The model file is located in your EnergyPlus installation folder,
in /ExampleFiles/5ZoneAirCooled.idf. Make a new directory in a
convenient location and copy the input file into this location.
• Obtain a weather file. This model is situated in Chicago, IL, so copy
the Chicago weather file
/WeatherData/USA_IL_Chicago-
OHare.Intl.AP.725300_TMY3.epw
• Open EP-Lanch
• Browse to the location of the idf and epw files
• Press simulate
Analysis
• This run was an annual simulation and the performance of the
building and its systems was simulated from January 1 to December
1. Before proceeding to look at the output, take a moment to review
a couple of the output files:
• Check that the error file (eplusout.err) does not contain any error messages.
The file is plain text and can be opened in any text editor.
• Look at the EIO file (eplusout.eio) to see what the invariant output looks like.
This file is also a plain text file.
• Open the tabular output report (eplusout.htm) in a web browser. This file
contains a number of summary-type tables
• EnergyPlus produces a number of different output files that contain
different kinds of output. The summary table in eplusout.htm is
useful and scanning through it will provide some information about
the behavior of the boiler.
• Open 5ZoneAirCooledTable.html to view the output
• To see what outputs are available, open the report variable data
dictionary (eplusout.rdd) and search for “Boiler”.
Adding an output variable
• Copy the model file into a new file named 5ZAC_DailyGas.idf and
open the file in a text editor.
• Add the following object to the end of the file:
• Output:Variable,*,Boiler Gas Energy,daily;
• This adds an output variable to the reports that EnergyPlus produces for the
boiler gas energy. The “*” means that the reporting will occur for all boilers,
but since there’s only one boiler in this model there will be only one dataset
produced.
• Run EnergyPlus, with an additional command line option “-r”:
• $/energyplus -i /Energy+.idd -w USA_IL_Chicago-
OHare.Intl.AP.725300_TMY3.epw -r 5ZAC_DailyGas.idf
• The “-r” option (synonymous with “--readvars”) will execute the
ReadVarsESO program after EnergyPlus runs to generates a CSV file
from the ESO.
• The CSV file that was written is named eplusout.csv. Load the file into
your favorite spreadsheet program and you will find that it has quite a
lot of data in it. The variables are arranged in columns, and the
variable of interest is in the column named “CENTRAL BOILER:Boiler
Gas Energy [J](Daily)”. Find that column and note that it only has one
entry per day. Even though the variable values are in the rows of the
last hour of each day, each result applies to the whole day (and not
just the last hour). Plotting the variable results in the graph
energyplus boiler simulation for energy system analysis

energyplus boiler simulation for energy system analysis

  • 1.
  • 2.
    EnergyPLus • EnergyPlus isa command line tool that takes input files and produces output files. The general model for running EnergyPlus is: • Collect -Collect information on the building to be modeled (building size and shape, mechanical system details, etc.) • Author-Author the input files • Run -Run EnergyPlus (simple models may take only minutes; complex models may take many hours) • Analyze -Analyze the outputs
  • 3.
    2 input fileswill need to be supplied as inputs: • IDF building model description file: The primary way model inputs are communicated to EnergyPlus are through the Input Data File (IDF). This file is a plain text file that contains a set of objects that represent the building and associated systems. See the “Input Output Reference” in the EnergyPlus documentation for many more details.
  • 4.
    • EPW weatherfile: Weather plays an extremely important role in the energy use of buildings, and most EnergyPlus simulations use weather inputs from an EnergyPlus Weather (EPW) file. This file is also a plain text file that contains weather information. The file format is documented in the “Auxiliary Program Guide” documentation. EnergyPlus ships with Typical Meteorological Year (TMY) weather files for a number of locations in the United States and additional weather files are available from other sources, including the EnergyPlus website (energyplus.net).
  • 5.
    • Running EnergyPluswith these two files will produce a set of output files which are used in the final step, analysis of results. Which files are produced depends on exactly how the program is run and what is in the input file. If EnergyPlus is run via an interface, the interface may intercept some of the output files and reformat them.
  • 6.
    EnergyPlus produces anumber of files that are unique to EnergyPlus, including: • ESO (EnergyPlus Standard Output): raw report variable output in text form. • SQL: if requested in the input file, the output variables stored in SQLite format. This format is most often by interfaces as it is convenient for automatic use. • RDD (Report variable Data Dictionary): list of output variables available from the run. • MDD (report Meter Data Dictionary): list of output meters available from the run. • EIO (EnergyPlus Invariant Output): additional EnergyPlus results, including diagnostic messages • ERR (ERRors): list of errors and warnings produced by the run. • MTR (MeTeR Output): raw report meter output, formatted as the ESO. • MTD (MeTer Details): list of meter component variables.
  • 7.
    Command Line Interface •EnergyPlus is a console-based tool, so it can be executed from a console or terminal. Assuming that is your EnergyPlus installation path and $ is the prompt, executing $/energyplus --help will cause EnergyPlus to list all of the command line options available
  • 8.
    -i or --idd:this option specifies the location of the IDD file for EnergyPlus. IDD stands for Input Data Dictionary, and is used in the processing of inputs -w or --weather: this option is used to specify the input EPW weather file
  • 9.
    • Assuming youhave an input file named “mymodel.idf” and an EPW file named “myweather.epw” in your working directory, running the model is accomplished with: $/energyplus --idd /EnergyPlus.idd --weather myweather.epw mymodel.idf This will result in outputs stored in the working directory.
  • 10.
    Running a simulation Stepby Step: Modeling hot water boilers • Open ExampleFiles-ObjectsLink.html • search for “Boiler:Hotwater” • choose the first file: 5ZoneAirCooled.idf. • Opening this file in a text editor • Examine the Input Objects The input object specifies the parameters that are needed to simulate the boiler and its interactions with the rest of the building systems. This boiler uses natural gas as fuel, and the capacity and design flow rates are “autosized”. This means that EnergyPlus will determine the values for these parameters that most likely meet the needs of the building.
  • 11.
    • The modelfile is located in your EnergyPlus installation folder, in /ExampleFiles/5ZoneAirCooled.idf. Make a new directory in a convenient location and copy the input file into this location. • Obtain a weather file. This model is situated in Chicago, IL, so copy the Chicago weather file /WeatherData/USA_IL_Chicago- OHare.Intl.AP.725300_TMY3.epw • Open EP-Lanch • Browse to the location of the idf and epw files • Press simulate
  • 13.
    Analysis • This runwas an annual simulation and the performance of the building and its systems was simulated from January 1 to December 1. Before proceeding to look at the output, take a moment to review a couple of the output files: • Check that the error file (eplusout.err) does not contain any error messages. The file is plain text and can be opened in any text editor. • Look at the EIO file (eplusout.eio) to see what the invariant output looks like. This file is also a plain text file. • Open the tabular output report (eplusout.htm) in a web browser. This file contains a number of summary-type tables
  • 14.
    • EnergyPlus producesa number of different output files that contain different kinds of output. The summary table in eplusout.htm is useful and scanning through it will provide some information about the behavior of the boiler. • Open 5ZoneAirCooledTable.html to view the output • To see what outputs are available, open the report variable data dictionary (eplusout.rdd) and search for “Boiler”.
  • 15.
    Adding an outputvariable • Copy the model file into a new file named 5ZAC_DailyGas.idf and open the file in a text editor. • Add the following object to the end of the file: • Output:Variable,*,Boiler Gas Energy,daily; • This adds an output variable to the reports that EnergyPlus produces for the boiler gas energy. The “*” means that the reporting will occur for all boilers, but since there’s only one boiler in this model there will be only one dataset produced. • Run EnergyPlus, with an additional command line option “-r”:
  • 16.
    • $/energyplus -i/Energy+.idd -w USA_IL_Chicago- OHare.Intl.AP.725300_TMY3.epw -r 5ZAC_DailyGas.idf • The “-r” option (synonymous with “--readvars”) will execute the ReadVarsESO program after EnergyPlus runs to generates a CSV file from the ESO.
  • 17.
    • The CSVfile that was written is named eplusout.csv. Load the file into your favorite spreadsheet program and you will find that it has quite a lot of data in it. The variables are arranged in columns, and the variable of interest is in the column named “CENTRAL BOILER:Boiler Gas Energy [J](Daily)”. Find that column and note that it only has one entry per day. Even though the variable values are in the rows of the last hour of each day, each result applies to the whole day (and not just the last hour). Plotting the variable results in the graph

Editor's Notes

  • #2 https://energyplus.net/quickstart#examplefiles