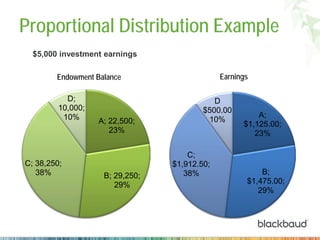
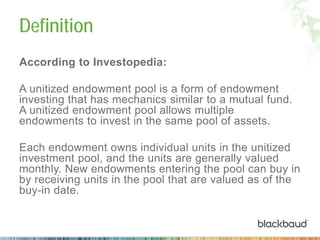
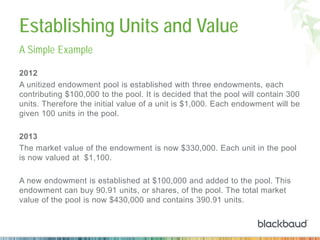
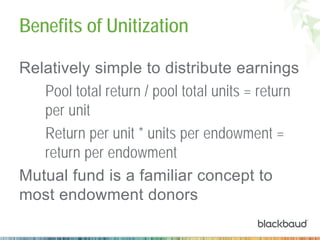
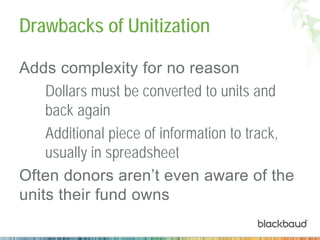
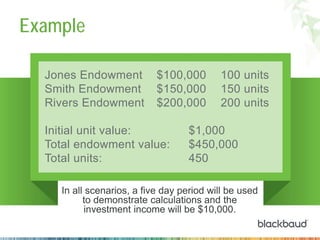
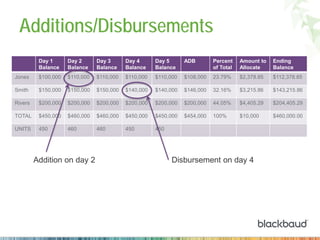
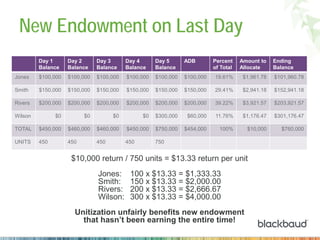
Endowment Management
Unitization
Jeff Sobers
Senior Product Marketing Manager
Review of Distribution Basics
Blackbaud Confidential 3
The Endowment Process
Endowed
Fund
Create
Fund
Invest
Earn
Distribute
Spend
Income Distribution Methods
Proportional
Unitized
Proportional Distribution Example
$5,000 investment earnings
A; 22,500;
23%
B; 29,250;
29%
C; 38,250;
38%
D;
10,000;
10%
Endowment Balance
A;
$1,125.00;
23%
B;
$1,475.00;
29%
C;
$1,912.50;
38%
D
$500.00
10%
Earnings
Unitization
Blackbaud Confidential 7
Definition
According to Investopedia:
A unitized endowment pool is a form of endowment
investing that has mechanics similar to a mutual fund.
A unitized endowment pool allows multiple
endowments to invest in the same pool of assets.
Each endowment owns individual units in the unitized
investment pool, and the units are generally valued
monthly. New endowments entering the pool can buy in
by receiving units in the pool that are valued as of the
buy-in date.
Example
A UEP with a market value of
$100 million has 100,000 units
that are worth $1,000 each. A
new endowment with $20,000
can buy 20 units, which are
then added to the pool.
2012
A unitized endowment pool is established with three endowments, each
contributing $100,000 to the pool. It is decided that the pool will contain 300
units. Therefore the initial value of a unit is $1,000. Each endowment will be
given 100 units in the pool.
2013
The market value of the endowment is now $330,000. Each unit in the pool
is now valued at $1,100.
A new endowment is established at $100,000 and added to the pool. This
endowment can buy 90.91 units, or shares, of the pool. The total market
value of the pool is now $430,000 and contains 390.91 units.
Establishing Units and Value
A Simple Example
In 2012, the pool returned $30,000. There were 300 units in the pool, so the
return per unit is $100. As each endowment has 100 units, each
endowment receives $10,000.
At the end of 2013, the pool returns another $30,000, but now has 390.91
units. The return is therefore $76.74 per unit. This income is distributed as
follows:
Endowment A: 100 units * $76.74 $7,674.40
Endowment B: 100 units * $76,74 $7,674.40
Endowment C: 100 units * $76.74 $7,674.40
Endowment D: 90.91 units * $76.74 $6,976.80
TOTAL 390.91 units *390.91 $30,000.00
Income Distribution
Continuing Our Example
Benefits of Unitization
Relatively simple to distribute earnings
Pool total return / pool total units = return
per unit
Return per unit * units per endowment =
return per endowment
Mutual fund is a familiar concept to
most endowment donors
Drawbacks of Unitization
Adds complexity for no reason
Dollars must be converted to units and
back again
Additional piece of information to track,
usually in spreadsheet
Often donors aren’t even aware of the
units their fund owns
To Unitize or Not to Unitize?
Example
Jones Endowment $100,000 100 units
Smith Endowment $150,000 150 units
Rivers Endowment $200,000 200 units
Initial unit value: $1,000
Total endowment value: $450,000
Total units: 450
In all scenarios, a five day period will be used
to demonstrate calculations and the
investment income will be $10,000.
No Contributions/Disbursements
Day 1
Balance
Day 2
Balance
Day 3
Balance
Day 4
Balance
Day 5
Balance
ADB Percent
of Total
Amount to
Allocate
Ending
Balance
Jones $100,000 $100,000 $100,000 $100,000 $100,000 $100,000 22.22% $2,222.22 $102,222.22
Smith $150,000 $150,000 $150,000 $150,000 $150,000 $150,000 33.33% $3,333.33 $153,333.33
Rivers $200,000 $200,000 $200,000 $200,000 $200,000 $200,000 44.44% $4,444.44 $204,444.44
TOTAL $450,000 $450,000 $450,000 $450,000 $450,000 $450,000 100% $10,000 $460,000.00
UNITS 450 450 450 450 450 450
$10,000 return / 450 units = $22.22 return per unit
Jones: 100 x $22.22 = $2,222.22
Smith: 150 x $22.22 = $3,333.33
Rivers: 200 x $22.22 = $4,444.44
With no additions or disbursements, unitization
is exactly the same as proportional using average daily balance.
Additions/Disbursements
Day 1
Balance
Day 2
Balance
Day 3
Balance
Day 4
Balance
Day 5
Balance
ADB Percent
of Total
Amount to
Allocate
Ending
Balance
Jones $100,000 $110,000 $110,000 $110,000 $110,000 $108,000 23.79% $2,378.85 $112,378.85
Smith $150,000 $150,000 $150,000 $140,000 $140,000 $146,000 32.16% $3,215.86 $143,215.86
Rivers $200,000 $200,000 $200,000 $200,000 $200,000 $200,000 44.05% $4,405.29 $204,405.29
TOTAL $450,000 $460,000 $460,000 $450,000 $450,000 $454,000 100% $10,000 $460,000.00
UNITS 450 460 460 450 450
Addition on day 2 Disbursement on day 4
Additions/Disbursements
Day 1
Balance
Day 2
Balance
Day 3
Balance
Day 4
Balance
Day 5
Balance
ADB Percent
of Total
Amount to
Allocate
Ending
Balance
Jones $100,000 $110,000 $110,000 $110,000 $110,000 $108,000 23.79% $2,378.85 $112,378.85
Smith $150,000 $150,000 $150,000 $140,000 $140,000 $146,000 32.16% $3,215.86 $143,215.86
Rivers $200,000 $200,000 $200,000 $200,000 $200,000 $200,000 44.05% $4,405.29 $204,405.29
TOTAL $450,000 $460,000 $460,000 $450,000 $450,000 $454,000 100% $10,000 $460,000.00
UNITS 450 460 460 450 450
Additions cause
units to increase
Disbursements
Decrease units
With hundreds of endowments this quickly becomes
an overwhelming process to manage.
Additions/Disbursements
Day 1
Balance
Day 2
Balance
Day 3
Balance
Day 4
Balance
Day 5
Balance
ADB Percent
of Total
Amount to
Allocate
Ending
Balance
Jones $100,000 $110,000 $110,000 $110,000 $110,000 $108,000 23.79% $2,378.85 $112,378.85
Smith $150,000 $150,000 $150,000 $140,000 $140,000 $146,000 32.16% $3,215.86 $143,215.86
Rivers $200,000 $200,000 $200,000 $200,000 $200,000 $200,000 44.05% $4,405.29 $204,405.29
TOTAL $450,000 $460,000 $460,000 $450,000 $450,000 $454,000 100% $10,000 $460,000.00
UNITS 450 460 460 450 450
$10,000 return / 450 units = $22.22 return per unit
Jones: 110 x $22.22 = $2,444.44
Smith: 140 x $22.22 = $3,111.12
Rivers: 200 x $21.74 = $4,444.44
Unitization penalizes endowments with disbursements
and rewards those with additions
New Endowment on Last Day
Day 1
Balance
Day 2
Balance
Day 3
Balance
Day 4
Balance
Day 5
Balance
ADB Percent
of Total
Amount to
Allocate
Ending
Balance
Jones $100,000 $100,000 $100,000 $100,000 $100,000 $100,000 19.61% $1,961.78 $101,960.78
Smith $150,000 $150,000 $150,000 $150,000 $150,000 $150,000 29.41% $2,941.18 $152,941.18
Rivers $200,000 $200,000 $200,000 $200,000 $200,000 $200,000 39.22% $3,921.57 $203,921.57
Wilson $0 $0 $0 $0 $300,000 $60,000 11.76% $1,176.47 $301,176.47
TOTAL $450,000 $460,000 $460,000 $450,000 $750,000 $454,000 100% $10,000 $760,000
UNITS 450 450 450 450 750
Wilson establishes a $300,000
endowment on day five, the
last day of the investment period
New Endowment on Last Day
Day 1
Balance
Day 2
Balance
Day 3
Balance
Day 4
Balance
Day 5
Balance
ADB Percent
of Total
Amount to
Allocate
Ending
Balance
Jones $100,000 $100,000 $100,000 $100,000 $100,000 $100,000 19.61% $1,961.78 $101,960.78
Smith $150,000 $150,000 $150,000 $150,000 $150,000 $150,000 29.41% $2,941.18 $152,941.18
Rivers $200,000 $200,000 $200,000 $200,000 $200,000 $200,000 39.22% $3,921.57 $203,921.57
Wilson $0 $0 $0 $0 $300,000 $60,000 11.76% $1,176.47 $301,176.47
TOTAL $450,000 $460,000 $460,000 $450,000 $750,000 $454,000 100% $10,000 $760,000
UNITS 450 450 450 450 750
$300,000 buys 300 units, so the
pool increases to 750 total units
New Endowment on Last Day
Day 1
Balance
Day 2
Balance
Day 3
Balance
Day 4
Balance
Day 5
Balance
ADB Percent
of Total
Amount to
Allocate
Ending
Balance
Jones $100,000 $100,000 $100,000 $100,000 $100,000 $100,000 19.61% $1,961.78 $101,960.78
Smith $150,000 $150,000 $150,000 $150,000 $150,000 $150,000 29.41% $2,941.18 $152,941.18
Rivers $200,000 $200,000 $200,000 $200,000 $200,000 $200,000 39.22% $3,921.57 $203,921.57
Wilson $0 $0 $0 $0 $300,000 $60,000 11.76% $1,176.47 $301,176.47
TOTAL $450,000 $460,000 $460,000 $450,000 $750,000 $454,000 100% $10,000 $760,000
UNITS 450 450 450 450 750
$10,000 return / 750 units = $13.33 return per unit
Jones: 100 x $13.33 = $1,333.33
Smith: 150 x $13.33 = $2,000.00
Rivers: 200 x $13.33 = $2,666.67
Wilson: 300 x $13.33 = $4,000.00
Unitization unfairly benefits new endowment
that hasn’t been earning the entire time!
Conclusion
Blackbaud Confidential 26
In Conclusion
Unitization is a simple way to calculate
earnings distributions, but it can be
time-consuming to manage unit
calculation and upkeep for
distributions and additions.
In Conclusion
Because the earnings per unit is
calculated on the last day of the
earning period, unitization unfairly
rewards late additions that weren’t
earning income the entire period.
About the Presenter
Jeffrey.Sobers@Blackbaud
Twitter: @jeffsobers
Slideshare: jsobers1
For more information, resources,
and conversations, visit:
blackbaud.com/research
npEngage.com
Slideshare.net/jsobers1
Blackbaud Confidential 29
Save the Date!
October 6 – 8, 2014, Gaylord Nashville, TN
About Blackbaud, Inc.
Serving the nonprofit and education sectors for 30 years, Blackbaud (NASDAQ:
BLKB) combines technology and expertise to help organizations achieve their
missions. Blackbaud works with more than 28,000 customers in over 60
countries that support higher education, healthcare, human services, arts and
culture, faith, the environment, independent K-12 education, animal welfare,
and other charitable causes. The company offers a full spectrum of cloud-
based and on-premise software solutions and related services for organizations
of all sizes including: fundraising, eMarketing, social media, advocacy,
constituent relationship management (CRM), analytics, financial management,
and vertical-specific solutions. Using Blackbaud technology, these
organizations raise more than $100 billion each year. Recognized as a top
company by Forbes, InformationWeek, and Software Magazine and honored by
Best Places to Work, Blackbaud is headquartered in Charleston, South
Carolina, and has operations in the United States, Australia, Canada, Mexico,
the Netherlands, and the United Kingdom.
Blackbaud Confidential 31

Endowment Management: Unitization

  • 1.
  • 3.
    Review of DistributionBasics Blackbaud Confidential 3
  • 4.
  • 5.
  • 6.
    Proportional Distribution Example $5,000investment earnings A; 22,500; 23% B; 29,250; 29% C; 38,250; 38% D; 10,000; 10% Endowment Balance A; $1,125.00; 23% B; $1,475.00; 29% C; $1,912.50; 38% D $500.00 10% Earnings
  • 7.
  • 8.
    Definition According to Investopedia: Aunitized endowment pool is a form of endowment investing that has mechanics similar to a mutual fund. A unitized endowment pool allows multiple endowments to invest in the same pool of assets. Each endowment owns individual units in the unitized investment pool, and the units are generally valued monthly. New endowments entering the pool can buy in by receiving units in the pool that are valued as of the buy-in date.
  • 9.
    Example A UEP witha market value of $100 million has 100,000 units that are worth $1,000 each. A new endowment with $20,000 can buy 20 units, which are then added to the pool.
  • 10.
    2012 A unitized endowmentpool is established with three endowments, each contributing $100,000 to the pool. It is decided that the pool will contain 300 units. Therefore the initial value of a unit is $1,000. Each endowment will be given 100 units in the pool. 2013 The market value of the endowment is now $330,000. Each unit in the pool is now valued at $1,100. A new endowment is established at $100,000 and added to the pool. This endowment can buy 90.91 units, or shares, of the pool. The total market value of the pool is now $430,000 and contains 390.91 units. Establishing Units and Value A Simple Example
  • 11.
    In 2012, thepool returned $30,000. There were 300 units in the pool, so the return per unit is $100. As each endowment has 100 units, each endowment receives $10,000. At the end of 2013, the pool returns another $30,000, but now has 390.91 units. The return is therefore $76.74 per unit. This income is distributed as follows: Endowment A: 100 units * $76.74 $7,674.40 Endowment B: 100 units * $76,74 $7,674.40 Endowment C: 100 units * $76.74 $7,674.40 Endowment D: 90.91 units * $76.74 $6,976.80 TOTAL 390.91 units *390.91 $30,000.00 Income Distribution Continuing Our Example
  • 12.
    Benefits of Unitization Relativelysimple to distribute earnings Pool total return / pool total units = return per unit Return per unit * units per endowment = return per endowment Mutual fund is a familiar concept to most endowment donors
  • 13.
    Drawbacks of Unitization Addscomplexity for no reason Dollars must be converted to units and back again Additional piece of information to track, usually in spreadsheet Often donors aren’t even aware of the units their fund owns
  • 14.
    To Unitize orNot to Unitize?
  • 15.
    Example Jones Endowment $100,000100 units Smith Endowment $150,000 150 units Rivers Endowment $200,000 200 units Initial unit value: $1,000 Total endowment value: $450,000 Total units: 450 In all scenarios, a five day period will be used to demonstrate calculations and the investment income will be $10,000.
  • 16.
    No Contributions/Disbursements Day 1 Balance Day2 Balance Day 3 Balance Day 4 Balance Day 5 Balance ADB Percent of Total Amount to Allocate Ending Balance Jones $100,000 $100,000 $100,000 $100,000 $100,000 $100,000 22.22% $2,222.22 $102,222.22 Smith $150,000 $150,000 $150,000 $150,000 $150,000 $150,000 33.33% $3,333.33 $153,333.33 Rivers $200,000 $200,000 $200,000 $200,000 $200,000 $200,000 44.44% $4,444.44 $204,444.44 TOTAL $450,000 $450,000 $450,000 $450,000 $450,000 $450,000 100% $10,000 $460,000.00 UNITS 450 450 450 450 450 450
  • 17.
    No Contributions/Disbursements Day 1 Balance Day2 Balance Day 3 Balance Day 4 Balance Day 5 Balance ADB Percent of Total Amount to Allocate Ending Balance Jones $100,000 $100,000 $100,000 $100,000 $100,000 $100,000 22.22% $2,222.22 $102,222.22 Smith $150,000 $150,000 $150,000 $150,000 $150,000 $150,000 33.33% $3,333.33 $153,333.33 Rivers $200,000 $200,000 $200,000 $200,000 $200,000 $200,000 44.44% $4,444.44 $204,444.44 TOTAL $450,000 $450,000 $450,000 $450,000 $450,000 $450,000 100% $10,000 $460,000.00 UNITS 450 450 450 450 450 450 $10,000 return / 450 units = $22.22 return per unit Jones: 100 x $22.22 = $2,222.22 Smith: 150 x $22.22 = $3,333.33 Rivers: 200 x $22.22 = $4,444.44 With no additions or disbursements, unitization is exactly the same as proportional using average daily balance.
  • 18.
    Additions/Disbursements Day 1 Balance Day 2 Balance Day3 Balance Day 4 Balance Day 5 Balance ADB Percent of Total Amount to Allocate Ending Balance Jones $100,000 $110,000 $110,000 $110,000 $110,000 $108,000 23.79% $2,378.85 $112,378.85 Smith $150,000 $150,000 $150,000 $140,000 $140,000 $146,000 32.16% $3,215.86 $143,215.86 Rivers $200,000 $200,000 $200,000 $200,000 $200,000 $200,000 44.05% $4,405.29 $204,405.29 TOTAL $450,000 $460,000 $460,000 $450,000 $450,000 $454,000 100% $10,000 $460,000.00 UNITS 450 460 460 450 450
  • 19.
    Additions/Disbursements Day 1 Balance Day 2 Balance Day3 Balance Day 4 Balance Day 5 Balance ADB Percent of Total Amount to Allocate Ending Balance Jones $100,000 $110,000 $110,000 $110,000 $110,000 $108,000 23.79% $2,378.85 $112,378.85 Smith $150,000 $150,000 $150,000 $140,000 $140,000 $146,000 32.16% $3,215.86 $143,215.86 Rivers $200,000 $200,000 $200,000 $200,000 $200,000 $200,000 44.05% $4,405.29 $204,405.29 TOTAL $450,000 $460,000 $460,000 $450,000 $450,000 $454,000 100% $10,000 $460,000.00 UNITS 450 460 460 450 450 Addition on day 2 Disbursement on day 4
  • 20.
    Additions/Disbursements Day 1 Balance Day 2 Balance Day3 Balance Day 4 Balance Day 5 Balance ADB Percent of Total Amount to Allocate Ending Balance Jones $100,000 $110,000 $110,000 $110,000 $110,000 $108,000 23.79% $2,378.85 $112,378.85 Smith $150,000 $150,000 $150,000 $140,000 $140,000 $146,000 32.16% $3,215.86 $143,215.86 Rivers $200,000 $200,000 $200,000 $200,000 $200,000 $200,000 44.05% $4,405.29 $204,405.29 TOTAL $450,000 $460,000 $460,000 $450,000 $450,000 $454,000 100% $10,000 $460,000.00 UNITS 450 460 460 450 450 Additions cause units to increase Disbursements Decrease units
  • 21.
    Additions/Disbursements Day 1 Balance Day 2 Balance Day3 Balance Day 4 Balance Day 5 Balance ADB Percent of Total Amount to Allocate Ending Balance Jones $100,000 $110,000 $110,000 $110,000 $110,000 $108,000 23.79% $2,378.85 $112,378.85 Smith $150,000 $150,000 $150,000 $140,000 $140,000 $146,000 32.16% $3,215.86 $143,215.86 Rivers $200,000 $200,000 $200,000 $200,000 $200,000 $200,000 44.05% $4,405.29 $204,405.29 TOTAL $450,000 $460,000 $460,000 $450,000 $450,000 $454,000 100% $10,000 $460,000.00 UNITS 450 460 460 450 450 Additions cause units to increase Disbursements Decrease units With hundreds of endowments this quickly becomes an overwhelming process to manage.
  • 22.
    Additions/Disbursements Day 1 Balance Day 2 Balance Day3 Balance Day 4 Balance Day 5 Balance ADB Percent of Total Amount to Allocate Ending Balance Jones $100,000 $110,000 $110,000 $110,000 $110,000 $108,000 23.79% $2,378.85 $112,378.85 Smith $150,000 $150,000 $150,000 $140,000 $140,000 $146,000 32.16% $3,215.86 $143,215.86 Rivers $200,000 $200,000 $200,000 $200,000 $200,000 $200,000 44.05% $4,405.29 $204,405.29 TOTAL $450,000 $460,000 $460,000 $450,000 $450,000 $454,000 100% $10,000 $460,000.00 UNITS 450 460 460 450 450 $10,000 return / 450 units = $22.22 return per unit Jones: 110 x $22.22 = $2,444.44 Smith: 140 x $22.22 = $3,111.12 Rivers: 200 x $21.74 = $4,444.44 Unitization penalizes endowments with disbursements and rewards those with additions
  • 23.
    New Endowment onLast Day Day 1 Balance Day 2 Balance Day 3 Balance Day 4 Balance Day 5 Balance ADB Percent of Total Amount to Allocate Ending Balance Jones $100,000 $100,000 $100,000 $100,000 $100,000 $100,000 19.61% $1,961.78 $101,960.78 Smith $150,000 $150,000 $150,000 $150,000 $150,000 $150,000 29.41% $2,941.18 $152,941.18 Rivers $200,000 $200,000 $200,000 $200,000 $200,000 $200,000 39.22% $3,921.57 $203,921.57 Wilson $0 $0 $0 $0 $300,000 $60,000 11.76% $1,176.47 $301,176.47 TOTAL $450,000 $460,000 $460,000 $450,000 $750,000 $454,000 100% $10,000 $760,000 UNITS 450 450 450 450 750 Wilson establishes a $300,000 endowment on day five, the last day of the investment period
  • 24.
    New Endowment onLast Day Day 1 Balance Day 2 Balance Day 3 Balance Day 4 Balance Day 5 Balance ADB Percent of Total Amount to Allocate Ending Balance Jones $100,000 $100,000 $100,000 $100,000 $100,000 $100,000 19.61% $1,961.78 $101,960.78 Smith $150,000 $150,000 $150,000 $150,000 $150,000 $150,000 29.41% $2,941.18 $152,941.18 Rivers $200,000 $200,000 $200,000 $200,000 $200,000 $200,000 39.22% $3,921.57 $203,921.57 Wilson $0 $0 $0 $0 $300,000 $60,000 11.76% $1,176.47 $301,176.47 TOTAL $450,000 $460,000 $460,000 $450,000 $750,000 $454,000 100% $10,000 $760,000 UNITS 450 450 450 450 750 $300,000 buys 300 units, so the pool increases to 750 total units
  • 25.
    New Endowment onLast Day Day 1 Balance Day 2 Balance Day 3 Balance Day 4 Balance Day 5 Balance ADB Percent of Total Amount to Allocate Ending Balance Jones $100,000 $100,000 $100,000 $100,000 $100,000 $100,000 19.61% $1,961.78 $101,960.78 Smith $150,000 $150,000 $150,000 $150,000 $150,000 $150,000 29.41% $2,941.18 $152,941.18 Rivers $200,000 $200,000 $200,000 $200,000 $200,000 $200,000 39.22% $3,921.57 $203,921.57 Wilson $0 $0 $0 $0 $300,000 $60,000 11.76% $1,176.47 $301,176.47 TOTAL $450,000 $460,000 $460,000 $450,000 $750,000 $454,000 100% $10,000 $760,000 UNITS 450 450 450 450 750 $10,000 return / 750 units = $13.33 return per unit Jones: 100 x $13.33 = $1,333.33 Smith: 150 x $13.33 = $2,000.00 Rivers: 200 x $13.33 = $2,666.67 Wilson: 300 x $13.33 = $4,000.00 Unitization unfairly benefits new endowment that hasn’t been earning the entire time!
  • 26.
  • 27.
    In Conclusion Unitization isa simple way to calculate earnings distributions, but it can be time-consuming to manage unit calculation and upkeep for distributions and additions.
  • 28.
    In Conclusion Because theearnings per unit is calculated on the last day of the earning period, unitization unfairly rewards late additions that weren’t earning income the entire period.
  • 29.
    About the Presenter Jeffrey.Sobers@Blackbaud Twitter:@jeffsobers Slideshare: jsobers1 For more information, resources, and conversations, visit: blackbaud.com/research npEngage.com Slideshare.net/jsobers1 Blackbaud Confidential 29
  • 30.
    Save the Date! October6 – 8, 2014, Gaylord Nashville, TN
  • 31.
    About Blackbaud, Inc. Servingthe nonprofit and education sectors for 30 years, Blackbaud (NASDAQ: BLKB) combines technology and expertise to help organizations achieve their missions. Blackbaud works with more than 28,000 customers in over 60 countries that support higher education, healthcare, human services, arts and culture, faith, the environment, independent K-12 education, animal welfare, and other charitable causes. The company offers a full spectrum of cloud- based and on-premise software solutions and related services for organizations of all sizes including: fundraising, eMarketing, social media, advocacy, constituent relationship management (CRM), analytics, financial management, and vertical-specific solutions. Using Blackbaud technology, these organizations raise more than $100 billion each year. Recognized as a top company by Forbes, InformationWeek, and Software Magazine and honored by Best Places to Work, Blackbaud is headquartered in Charleston, South Carolina, and has operations in the United States, Australia, Canada, Mexico, the Netherlands, and the United Kingdom. Blackbaud Confidential 31