The document details a computer science project on an 'Employee Management System' created by a student of Gandhi Public School. It includes sections on acknowledgments, software and hardware requirements, modules, and source code, highlighting its user-friendly features and ability to visualize employee data through charts and graphs. The project is developed in Python, focusing on managing employee records efficiently.


![SOURCE CODE
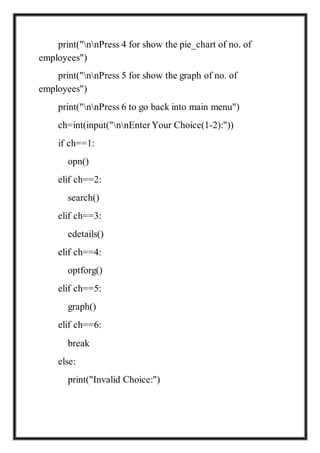
company1():
def search():
a='y'
while a=='y':
n=input("Enter the id of employee:")
f=open('C:/Users/student/Desktop/employment
management system/new folder/emp1.txt','r').readlines()
for lines in f:
if n==lines[0]:
print(lines)
a=input("Press y for search again or press any key
to go back:" )
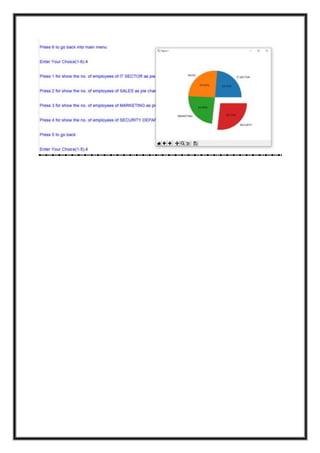
def optforg():
print("nnPress 1 for show the no. of employees of IT
SECTOR as pie chart")
print("nnPress 2 for show the no. of employees of
SALES as pie chart")](https://image.slidesharecdn.com/1585408063499emp-200328155123/85/class-12th-computer-science-project-Employee-Management-System-In-Python-8-320.jpg)

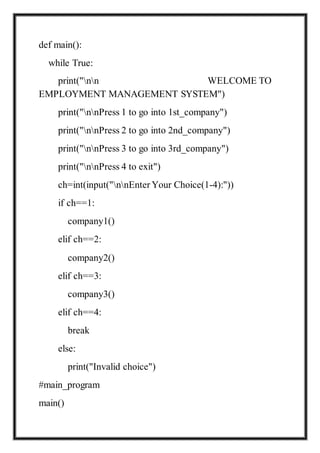
![import matplotlib.pyplot as plt
DEPARTMENT=['IT
SECTOR','SALES','MARKETING','SECURITY']
NO_OF_EMPLOYEES=[24.8,26.8,25,28]
plt.xlabel('DEPARTMENT')
plt.ylabel('NO_OF_EMPLOYEES')
plt.bar(DEPARTMENT,NO_OF_EMPLOYEES,color=['blue',
'orange','green','red'])
plt.show()
def opn():
f=open('C:/Users/student/Desktop/employment
management system/new folder/emp1.txt',"r+")
s=f.read()
print(s)
f.close()
def edt():](https://image.slidesharecdn.com/1585408063499emp-200328155123/85/class-12th-computer-science-project-Employee-Management-System-In-Python-10-320.jpg)
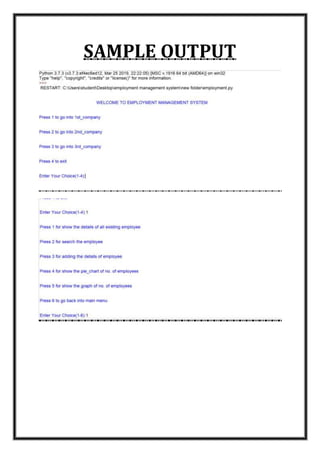
![f=open('C:/Users/student/Desktop/employment
management system/new folder/emp1.txt','r')
s=f.read()
print(s)
f.close()
def graph_invest():
import matplotlib.pyplot as plt
con=[24.8,26.8,25,28]
zones=['IT
SECTOR','SALES','MARKETING','SECURITY']
plt.axis("equal")
plt.pie(con,labels=zones,explode=[0.3,0,0,0],autopct="%1.2f
%%")
plt.show()
def graph_profit():
import matplotlib.pyplot as plt
con=[24.8,26.8,25,28]
zones=['IT
SECTOR','SALES','MARKETING','SECURITY']](https://image.slidesharecdn.com/1585408063499emp-200328155123/85/class-12th-computer-science-project-Employee-Management-System-In-Python-11-320.jpg)
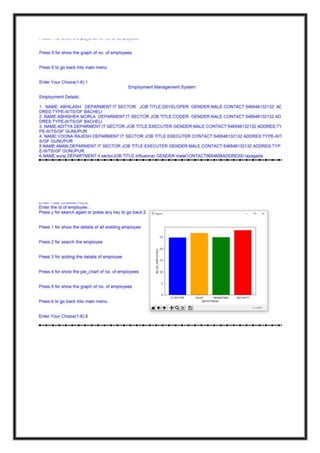
![plt.axis("equal")
plt.pie(con,labels=zones,explode=[0,0.3,0,0],autopct="%1.2f
%%")
plt.show()
def graph_loss():
import matplotlib.pyplot as plt
con=[24.8,26.8,25,28]
zones=['IT
SECTOR','SALES','MARKETING','SECURITY']
plt.axis("equal")
plt.pie(con,labels=zones,explode=[0,0,0.3,0],autopct="%1.2f
%%")
plt.show()
def graph_mark():
import matplotlib.pyplot as plt
con=[24.8,26.8,25,28]
zones=['IT
SECTOR','SALES','MARKETING','SECURITY']](https://image.slidesharecdn.com/1585408063499emp-200328155123/85/class-12th-computer-science-project-Employee-Management-System-In-Python-12-320.jpg)
![plt.axis("equal")
plt.pie(con,labels=zones,explode=[0,0,0,0.3],autopct="%1.2f
%%")
plt.show()
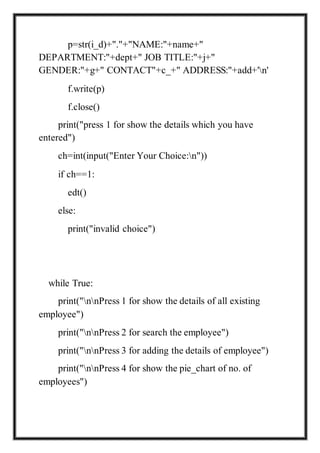
def edetails():
f=open("emp1.txt","a")
n=int(input("nnHow many employees name you want
to enter?"))
for i in range(n):
name=input("Enter The Name of employees:")
i_d=int(input("Enter the id of the employees:"))
dept=input("Enter the department of the employees:")
j=input("Enter the job title of employees:")
g=input("Enter the gender of employees:")
c_=input("Enter the contact details of employees:")
add=input("Enter the address of employees:")](https://image.slidesharecdn.com/1585408063499emp-200328155123/85/class-12th-computer-science-project-Employee-Management-System-In-Python-13-320.jpg)
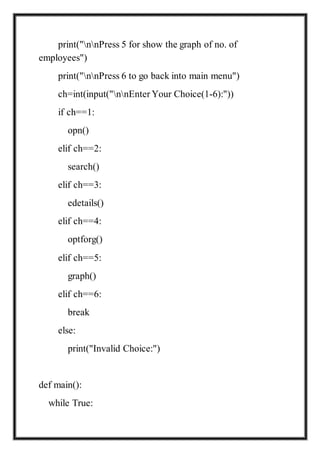
![f=open('C:/Users/student/Desktop/employment
management system/new folder/emp2.txt','r').readlines()
for lines in f:
if n==lines[0]:
print(lines)
a=input("Press y for search again or press any key
to go back:" )
def optforg():
print("nnPress 1 for show the no. of employees of IT
SECTOR as pie chart")
print("nnPress 2 for show the no. of employees of
SALES as pie chart")
print("nnPress 3 for show the no. of employees of
MARKETING as pie chart")
print("nnPress 4 for show the no. of employees of
SECURITY DEPARTMENT as pie chart")
print("nnPress 5 for exitnn")
while True:
ch=int(input("Enter Your Choice(1-5):"))
if ch==1:](https://image.slidesharecdn.com/1585408063499emp-200328155123/85/class-12th-computer-science-project-Employee-Management-System-In-Python-17-320.jpg)
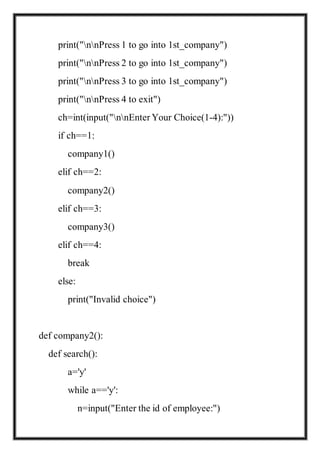
![graph_invest()
elif ch==2:
graph_profit()
elif ch==3:
graph_loss()
elif ch==4:
graph_mark()
elif ch==5:
break
else:
print("invalid choice!")
def graph():
import matplotlib.pyplot as plt
DEPARTMENT=['IT
SECTOR','SALES','MARKETING','SECURITY']
NO_OF_EMPLOYEES=[24.8,26.8,25,28]
plt.xlabel('DEPARTMENT')
plt.ylabel('NO_OF_EMPLOYEES')](https://image.slidesharecdn.com/1585408063499emp-200328155123/85/class-12th-computer-science-project-Employee-Management-System-In-Python-18-320.jpg)
![plt.bar(DEPARTMENT,NO_OF_EMPLOYEES,color=['blue',
'orange','green','red'])
plt.show()
def opn():
f=open('C:/Users/student/Desktop/employment
management system/new folder/emp2.txt',"r+")
s=f.read()
print(s)
f.close()
def edt():
f=open('C:/Users/student/Desktop/employment
management system/new folder/emp2.txt','r')
s=f.read()
print(s)
f.close()
def graph_invest():](https://image.slidesharecdn.com/1585408063499emp-200328155123/85/class-12th-computer-science-project-Employee-Management-System-In-Python-19-320.jpg)
![import matplotlib.pyplot as plt
con=[24.8,26.8,25,28]
zones=['IT
SECTOR','SALES','MARKETING','SECURITY']
plt.axis("equal")
plt.pie(con,labels=zones,explode=[0.3,0,0,0],autopct="%1.2f
%%")
plt.show()
def graph_profit():
import matplotlib.pyplot as plt
con=[24.8,26.8,25,28]
zones=['IT
SECTOR','SALES','MARKETING','SECURITY']
plt.axis("equal")
plt.pie(con,labels=zones,explode=[0,0.3,0,0],autopct="%1.2f
%%")
plt.show()
def graph_loss():](https://image.slidesharecdn.com/1585408063499emp-200328155123/85/class-12th-computer-science-project-Employee-Management-System-In-Python-20-320.jpg)
![import matplotlib.pyplot as plt
con=[24.8,26.8,25,28]
zones=['IT
SECTOR','SALES','MARKETING','SECURITY']
plt.axis("equal")
plt.pie(con,labels=zones,explode=[0,0,0.3,0],autopct="%1.2f
%%")
plt.show()
def graph_mark():
import matplotlib.pyplot as plt
con=[24.8,26.8,25,28]
zones=['IT
SECTOR','SALES','MARKETING','SECURITY']
plt.axis("equal")
plt.pie(con,labels=zones,explode=[0,0,0,0.3],autopct="%1.2f
%%")
plt.show()](https://image.slidesharecdn.com/1585408063499emp-200328155123/85/class-12th-computer-science-project-Employee-Management-System-In-Python-21-320.jpg)
![company2()
elif ch==3:
company3()
elif ch==4:
break
else:
print("Invalid choice")
def company3():
def search():
a='y'
while a=='y':
n=input("Enter the id of employee:")
f=open('C:/Users/student/Desktop/employment
management system/new folder/emp3.txt','r').readlines()
for lines in f:
if n==lines[0]:
print(lines)
a=input("Press y for search again or press any key
to go back:" )](https://image.slidesharecdn.com/1585408063499emp-200328155123/85/class-12th-computer-science-project-Employee-Management-System-In-Python-25-320.jpg)
![break
else:
print("invalid choice!")
def graph():
import matplotlib.pyplot as plt
DEPARTMENT=['IT
SECTOR','SALES','MARKETING','SECURITY']
NO_OF_EMPLOYEES=[24.8,26.8,25,28]
plt.xlabel('DEPARTMENT')
plt.ylabel('NO_OF_EMPLOYEES')
plt.bar(DEPARTMENT,NO_OF_EMPLOYEES,color=['blue',
'orange','green','red'])
plt.show()
def opn():
f=open('C:/Users/student/Desktop/employment
management system/new folder/emp3.txt',"r+")
s=f.read()](https://image.slidesharecdn.com/1585408063499emp-200328155123/85/class-12th-computer-science-project-Employee-Management-System-In-Python-27-320.jpg)
![print(s)
f.close()
def edt():
f=open('C:/Users/student/Desktop/employment
management system/new folder/emp3.txt','r')
s=f.read()
print(s)
f.close()
def graph_invest():
import matplotlib.pyplot as plt
con=[24.8,26.8,25,28]
zones=['IT
SECTOR','SALES','MARKETING','SECURITY']
plt.axis("equal")
plt.pie(con,labels=zones,explode=[0.3,0,0,0],autopct="%1.2f
%%")
plt.show()
def graph_profit():](https://image.slidesharecdn.com/1585408063499emp-200328155123/85/class-12th-computer-science-project-Employee-Management-System-In-Python-28-320.jpg)
![import matplotlib.pyplot as plt
con=[24.8,26.8,25,28]
zones=['IT
SECTOR','SALES','MARKETING','SECURITY']
plt.axis("equal")
plt.pie(con,labels=zones,explode=[0,0.3,0,0],autopct="%1.2f
%%")
plt.show()
def graph_loss():
import matplotlib.pyplot as plt
con=[24.8,26.8,25,28]
zones=['IT
SECTOR','SALES','MARKETING','SECURITY']
plt.axis("equal")
plt.pie(con,labels=zones,explode=[0,0,0.3,0],autopct="%1.2f
%%")
plt.show()
def graph_mark():](https://image.slidesharecdn.com/1585408063499emp-200328155123/85/class-12th-computer-science-project-Employee-Management-System-In-Python-29-320.jpg)
![import matplotlib.pyplot as plt
con=[24.8,26.8,25,28]
zones=['IT
SECTOR','SALES','MARKETING','SECURITY']
plt.axis("equal")
plt.pie(con,labels=zones,explode=[0,0,0,0.3],autopct="%1.2f
%%")
plt.show()
def edetails():
f=open("emp3.txt","a")
n=int(input("nnHow many employees name you want
to enter?"))
for i in range(n):
name=input("Enter The Name of employees:")
i_d=int(input("Enter the id of the employees:"))
dept=input("Enter the department of the employees:")
j=input("Enter the job title of employees:")
g=input("Enter the gender of employees:")](https://image.slidesharecdn.com/1585408063499emp-200328155123/85/class-12th-computer-science-project-Employee-Management-System-In-Python-30-320.jpg)


![Employee_Management_System_Presentation[1].pptx](https://cdn.slidesharecdn.com/ss_thumbnails/employeemanagementsystempresentation1-250428055721-f71116c5-thumbnail.jpg?width=640&height=640&fit=bounds)