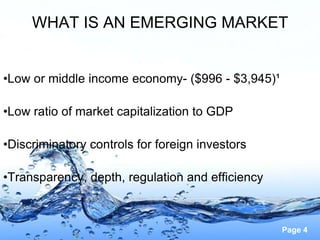
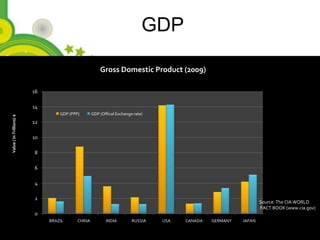
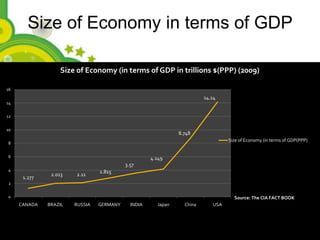
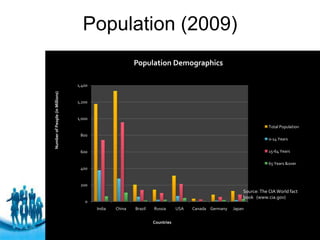
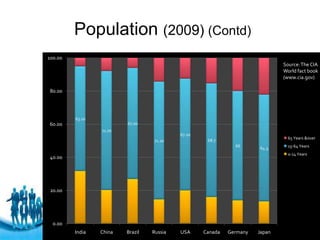
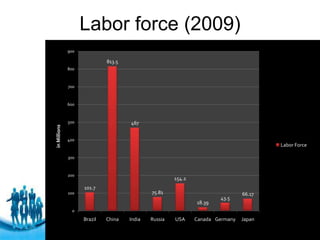
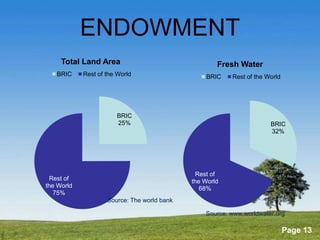
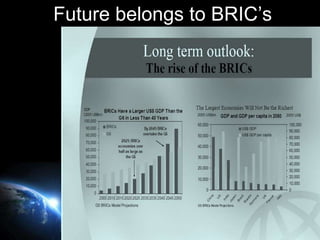
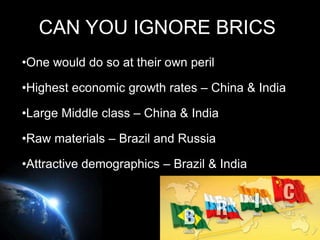
1. Emerging Markets Presentation
Devinder Paul Singh, McGill
University*
*February 21, 2011
Women's Canadian Club of
Montreal
Page 1
2. THE REALITY
THE KNOWN IS FINITE (VERY LITTLE)
THE UNKNOWN INFINITE (ALL ELSE)
T.H. HUXLEY, 1887
Page 2
3. PLAN
•What is an emerging market
• Backgrounder
•Emerging economies
•Human capital
•Natural resources
•Geopolitics
•Infrastructure
•Perceptions and reality
•Going Forward
Page 3
4. WHAT IS AN EMERGING MARKET
•Low or middle income economy- ($996 - $3,945)¹
•Low ratio of market capitalization to GDP
•Discriminatory controls for foreign investors
•Transparency, depth, regulation and efficiency
Page 4
6. GDP
Gross Domestic Product (2009)
16
14
GDP (PPP) GDP (Offical Exchange rate)
Value ( In Trillions) $
12
10
8
6
4
2
Source: The CIA WORLD
FACT BOOK (www.cia.gov)
0
BRAZIL CHINA INDIA RUSSIA USA CANADA GERMANY JAPAN
Powerpoint Templates
Page 6
7. Size of Economy in terms of GDP
Size of Economy (in terms of GDP in trillions $(PPP) (2009)
16
14.14
14
12
10
8.748
Size of Economy (in terms of GDP(PPP)
8
6 4.149
3.57
4 2.815
2.013 2.11
1.277
2
0 Source: The CIA FACT BOOK
CANADA BRAZIL RUSSIA GERMANY INDIA Japan China USA
Powerpoint Templates
Page 7
9. Population (2009)
Population Demographics
1,400
Number of People (in Millions)
1,200
1,000
Total Population
800
0-14 Years
600 15-64 Years
65 Years &over
400
200
Source: The CIA World fact
book (www.cia.gov)
0
India China Brazil Russia USA Canada Germany Japan
Countries
Free Powerpoint Templates
Page 9
10. Population (2009) (Contd)
100.00
Source: The CIA
World fact book
(www.cia.gov)
80.00
63.10
60.00 67.00
71.70
67.20
65 Years &over
71.10 68.7
66 15-64 Years
64.3
0-14 Years
40.00
20.00
0.00 Free Powerpoint Templates
India China Brazil Russia USA Canada Germany Japan Page 10
11. Labor force (2009)
900
813.5
800
700
600
500 467
in Millions
400
Labor Force
300
200
154.2
101.7
100 75.81 66.17
43.5
18.39
0
Brazil China India Russia USA Canada Germany Source: www.cia.gov
Japan
Free Powerpoint Templates
Page 11
13. ENDOWMENT
Total Land Area Fresh Water
BRIC Rest of the World BRIC Rest of the World
BRIC
25% BRIC
32%
Rest of
Rest of the World
the World 68%
75%
Source: The world bank
Source: www.worldwater.org
Powerpoint Templates
Page 13
14. Change in natural gas production by
country/region: 2007-2030
Note: Based on provisional data for 2007, World Energy Outlook 2008.
19. Government Type
INDIA CHINA BRAZIL RUSSIA USA CANADA GERMANY JAPAN
Parliamentary Communist Federal Federation- Federal Parliamentary Federal Parliamentary
democracy State-Command Republic Essentially One Republic democracy/ a Republic government
Federal Economy Party State federation with a
Republic constitutional
monarchy
Source: The CIA World fact book
(www.cia.gov)
Powerpoint Templates
Page 19
20. ECONOMICS AND POWER POLITICS
POST WWII (1945)
• U.S. and USSR AS SUPER POWERS, $
• JAPAN AN ECONOMIC POWER
• US,USSR,UK,FRANCE ON UNSC
POST COLD WAR
• U.S. ONLY SUPER POWER, $
• US,USSR,UK,FRANCE,CHINA ON UNSC
GOING FORWARD (2025)
• U.S. CHINA AS SUPER POWERS, $!
• U.S., CHINA, (INDIA!) ECONOMIC POWERS
Powerpoint Templates
Page 20
22. Electricity
Electricity Production (in billion kWh)
4110
3451
925.9 957.9
723.8 620.7 593.4
438.8
Brazil China India Russia Canada Germany USA Japan
Powerpoint Templates
Page 22
23. Communications
Communications (2009)
800
700
600
Telephones (Main lines)
In Millions
500
400 Telephones (Cellular)
300
Internet Users
200
100
0
Source: The CIA World fact book (www.cia.gov)
Powerpoint Templates
Page 23
24. Transport (2009)
Airports(With Paved Runways) Railways (Km)
250000
6000
5000
200000
4000 Airports(With
Kilometers
Paved 150000
3000 Runways)
2000
100000
1000
50000
0
BRAZIL CHINA INDIA RUSSIA USA
Airports(With
726 442 249 593 5194 0
Paved Runways)
BRAZIL CHINA INDIA RUSSIA USA
Railways (Km) 28857 77834 64015 87157 226427
Powerpoint Templates
Source: The CIA WORLD Page 24
FACT BOOK (www.cia.gov)
25. Social Media
Power of the People Social Media Tracker (www.umww.com)
Powerpoint Templates
Page 25
26. PERCEPTIONS & REALITY
• Risk – not in a portfolio
• Investability - ETFs
• Regulation - Improving
• Governance – better than some European
• Information – Not a Problem
• Returns more than compensate
Powerpoint Templates
Page 26
27. Equity Return
Equity return from 2001- 2010 (%)
1000
800
600
Equity return from 2001- 2010
400
(%)
200
Source : BRICs Monthly Issue May 2010
Goldman Sachs global ECS Research
0
Brazil Russia India China US Europe Japan
Powerpoint Templates
-200
Page 27
29. INDIA-LAND OF CONTRASTS
•Economy booming despite the government
•Swanky Mumbai offices coexist with abject poverty
•More cell phones than toilets
•Tens of thousands of engineering grads- literacy rate
•Infrastructure
Powerpoint Templates
Page 29
30. CHINA-DRAGON ALL AROUND
•Economy booming because of government
•Heavy dependence on raw materials imports
•Coastal/Rural divide-Shanghai, Shenzen, West, Tibet
•Domestic bully-citizens have no rights, Foreigners!
•Geo-political bully- Japan, S. Korea, India, Vietnam
Powerpoint Templates
Page 30
32. Demographic outlook for future (India miles
ahead among BRIC countries))
Source: Deutsche Bank
Research
Page 32
33. Rapid Growth of Indian Economy
Source : Economic Research from the
GS Financial Workbench at
https://www.gs.com Global Economics
paper no 99
Page 33
37. CAN YOU IGNORE BRICS!
•One would do so at their own peril
•Highest economic growth rates – China & India
•Large Middle class – China & India
•Raw materials – Brazil and Russia
•Attractive demographics – Brazil & India
Page 37