Download as PDF, PPTX


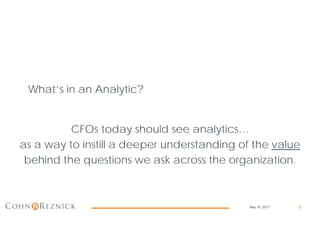
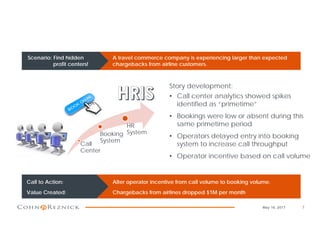
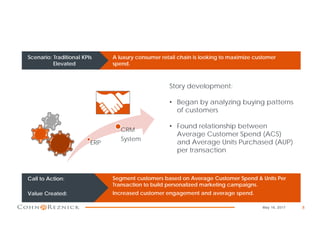
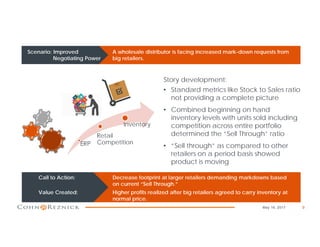
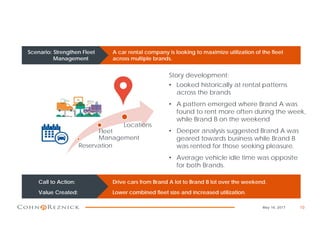
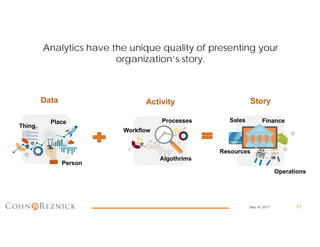
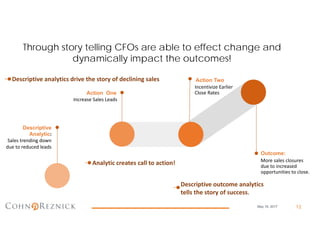
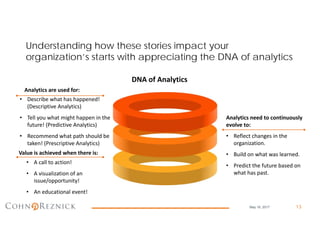
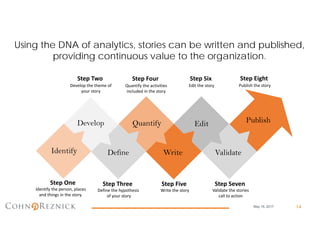
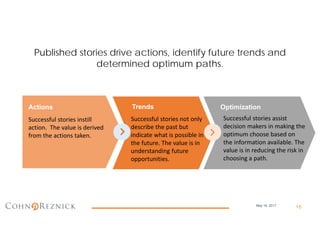


The document, presented by Matt Giroux of CohnReznick LLP, focuses on the role of analytics in enhancing financial decision-making for CFOs. It emphasizes the importance of leveraging analytics to derive actionable insights, drive strategic changes, and improve organizational performance through storytelling. Various case studies illustrate how companies can uncover hidden opportunities and optimize operations by refining their analytical approaches.