SlideShare a Scribd company logo
1 of 70
Elections: Who DecidesElections: Who Decides
Voter Demographics,Voter Demographics,
Registration and TurnoutRegistration and Turnout
Government Sources:Government Sources:
Decennial CensusDecennial Census
Current Population Survey,Current Population Survey,
November SupplementNovember Supplement
Report of RegistrationReport of Registration (Secretary of(Secretary of
State, County Registrar)State, County Registrar)
Statement of VoteStatement of Vote (Secretary of(Secretary of
State, County Registrar)State, County Registrar)

Non-governmental SourcesNon-governmental Sources
News SourcesNews Sources (LexisNexis, NYT,(LexisNexis, NYT,
LA Times, etc.)LA Times, etc.)
Opinion PollsOpinion Polls (Roper Center iPoll)(Roper Center iPoll)
SurveysSurveys (other than CPS, ICPSR)(other than CPS, ICPSR)
The research question:The research question:
How many Latinos in Los Angeles areHow many Latinos in Los Angeles are
eligible to vote?eligible to vote?
 GeographyGeography 
 Time periodTime period

 Population and Units ofPopulation and Units of
AnalysisAnalysis 
 Los Angeles cityLos Angeles city
 Current 2000-2008Current 2000-2008
 Individuals 18 andIndividuals 18 and
older, race/ethnicity =older, race/ethnicity =
hispanichispanic
Creating a Voter ProfileCreating a Voter Profile
 Who are the electorate?Who are the electorate?
 What do they look like demographically?What do they look like demographically?
 Who is the "typical" Democrat/Republican.Who is the "typical" Democrat/Republican.
 Who seems to be the "typical" voter?Who seems to be the "typical" voter?
Defining the Research QuestionDefining the Research Question
 GeographyGeography:: Physical areas, GovernmentPhysical areas, Government
units, Political boundaries, Other – schoolunits, Political boundaries, Other – school
districts, etc.districts, etc.
 Time periodTime period:: “Current”, Historical, Over time“Current”, Historical, Over time
 Population & Units of analysisPopulation & Units of analysis:: Gender,Gender,
age, etc.Race, ethnicity, ancestry,etc.age, etc.Race, ethnicity, ancestry,etc.
Persons, Households, Other – schools,Persons, Households, Other – schools,
hospitals, etc.hospitals, etc.
Defining the Research QuestionDefining the Research Question
 Questionnaire:Questionnaire: What was asked? WhatWhat was asked? What
information was collected?information was collected?
 Variables in the dataset:Variables in the dataset: How are theHow are the
responses organized? What are theresponses organized? What are the
response categories?response categories?
 Context:Context: What is your hypothesis? What willWhat is your hypothesis? What will
the data tell you?the data tell you?
Research Discovery ContinuumResearch Discovery Continuum
(Mapping the Questions to Sources)(Mapping the Questions to Sources)
 Statistical Sources-Statistical Sources- compilations or publishedcompilations or published
statistics by an agency - summary statistics; maystatistics by an agency - summary statistics; may
not have all the geographies but will help younot have all the geographies but will help you
determine the source of the data; often going todetermine the source of the data; often going to
the agency responsible for collecting the data,the agency responsible for collecting the data,
you can get statistics, aggregate data, and inyou can get statistics, aggregate data, and in
many cases microdata.many cases microdata.
 News ArticlesNews Articles - newspapers will report- newspapers will report
statistics, sometimes at a local level; good forstatistics, sometimes at a local level; good for
finding out votes cast, turnout immediately andfinding out votes cast, turnout immediately and
the source of the data.the source of the data.
Research Discovery ContinuumResearch Discovery Continuum
(Mapping the Questions to Sources)(Mapping the Questions to Sources)
 Scholarly ArticlesScholarly Articles - studies that examine a particular- studies that examine a particular
question and utilized standard data sources or createquestion and utilized standard data sources or create
their own; a good way to find out source survey andtheir own; a good way to find out source survey and
microdatamicrodata
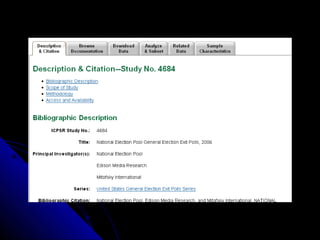
 Data SourcesData Sources - using a source that indexes surveys and- using a source that indexes surveys and
microdata, likemicrodata, like ICPSRICPSR can help you locate studycan help you locate study
detailes, questionnaires, codebooks and variables thatdetailes, questionnaires, codebooks and variables that
cover what you study, especially if the publishedcover what you study, especially if the published
statistics from a government agency does not collect thestatistics from a government agency does not collect the
information. Reading the codebooks, questionnaires,information. Reading the codebooks, questionnaires,
and other documentation will help you determine whichand other documentation will help you determine which
datasets you can use, if the information collected willdatasets you can use, if the information collected will
cover the variables you want.cover the variables you want.
Who is Eligible to Vote?Who is Eligible to Vote?
 U.S. CitizenU.S. Citizen
 18 years or older18 years or older
 Specific State LawsSpecific State Laws
Criminal HistoryCriminal History
ResidencyResidency
Mental competencyMental competency
Loyalty OathLoyalty Oath
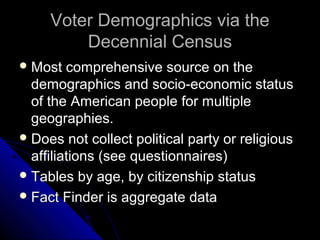
Voter Demographics via theVoter Demographics via the
Decennial CensusDecennial Census
 Most comprehensive source on theMost comprehensive source on the
demographics and socio-economic statusdemographics and socio-economic status
of the American people for multipleof the American people for multiple
geographies.geographies.
 Does not collect political party or religiousDoes not collect political party or religious
affiliations (see questionnaires)affiliations (see questionnaires)
 Tables by age, by citizenship statusTables by age, by citizenship status
 Fact Finder is aggregate dataFact Finder is aggregate data
Source – 2000 Decennial CensusSource – 2000 Decennial Census
via American Fact Findervia American Fact Finder
Fact Sheets in
Fact Finder
Total number
of people 18
and older
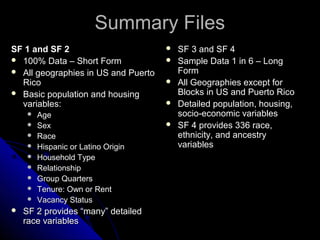
Summary FilesSummary Files
SF 1 and SF 2SF 1 and SF 2
 100% Data – Short Form100% Data – Short Form
 All geographies in US and PuertoAll geographies in US and Puerto
RicoRico
 Basic population and housingBasic population and housing
variables:variables:
 AgeAge
 SexSex
 RaceRace
 Hispanic or Latino OriginHispanic or Latino Origin
 Household TypeHousehold Type
 RelationshipRelationship
 Group QuartersGroup Quarters
 Tenure: Own or RentTenure: Own or Rent
 Vacancy StatusVacancy Status
 SF 2 provides “many” detailedSF 2 provides “many” detailed
race variablesrace variables
 SF 3 and SF 4SF 3 and SF 4
 Sample Data 1 in 6 – LongSample Data 1 in 6 – Long
FormForm
 All Geographies except forAll Geographies except for
Blocks in US and Puerto RicoBlocks in US and Puerto Rico
 Detailed population, housing,Detailed population, housing,
socio-economic variablessocio-economic variables
 SF 4 provides 336 race,SF 4 provides 336 race,
ethnicity, and ancestryethnicity, and ancestry
variablesvariables
Ability to speak English
Ancestry
Citizenship status
Class of worker
Disability
Farm Residence
Educational attainment
Employment status
Grandparents as caregivers
Income in 1999
Industry
Journey to work (commuting)
Language spoken at home
Marital status
Migration
Occupation
Place of birth
Place of work
Poverty status in 1999
School enrollment
Veteran status
Work status in 1999
Year of entry
SF 3 Population
Variables
Making TablesMaking Tables
Quick TablesQuick Tables
 Data TablesData Tables
 Custom TablesCustom Tables
 Geographic Comparison TablesGeographic Comparison Tables
SF 1 Tables by AgeSF 1 Tables by Age
 P5 Race for the population 18 years and overP5 Race for the population 18 years and over
 P6 Hispanic or Latino, and not Hispanic or Latino by raceP6 Hispanic or Latino, and not Hispanic or Latino by race
for the population 18 years and overfor the population 18 years and over
 P12, P12A- I Sex by age (race variable) groupingsP12, P12A- I Sex by age (race variable) groupings
 PCT 12, 12A-O Sex by Age (race variable) single yearPCT 12, 12A-O Sex by Age (race variable) single year
 PCT 13, 13A-I Sex by age (People in Households, racePCT 13, 13A-I Sex by age (People in Households, race
variable)variable)
 P20 Households by age of householder by householdP20 Households by age of householder by household
type by presence of own children*type by presence of own children*
 P38 Group quarters population by sex by age by groupP38 Group quarters population by sex by age by group
quarters type (institutionalized and non)quarters type (institutionalized and non)
 PCT 17, 17A-17I Group quarters population by sex byPCT 17, 17A-17I Group quarters population by sex by
age by group quarters type (institutionalized and non,age by group quarters type (institutionalized and non,
race variablerace variable
SF2 Tables By AgeSF2 Tables By Age
Fewer tables, more race and ethnicityFewer tables, more race and ethnicity
variablesvariables
 PCT 3 Sex by age (individual year)PCT 3 Sex by age (individual year)
 PCT 5 Sex by age (groupings)PCT 5 Sex by age (groupings)
 PCT 11 Households by age ofPCT 11 Households by age of
householder by household type byhouseholder by household type by
presence of own childrenpresence of own children
(selected) SF 3 Tables by Age(selected) SF 3 Tables by Age
 P8 Sex by Age (individual years up to 21; groupings 22-P8 Sex by Age (individual years up to 21; groupings 22-
24 and over)24 and over)
 P19 Age by language spoken at home by ability toP19 Age by language spoken at home by ability to
speak English for the population 5 years and overspeak English for the population 5 years and over
 P39 Sex by age by armed forces status by veteranP39 Sex by age by armed forces status by veteran
status for the population 18 years and overstatus for the population 18 years and over
 P87 Poverty status in 1999 by ageP87 Poverty status in 1999 by age
 PCT23 Sex by school enrollment by age for thePCT23 Sex by school enrollment by age for the
population 3 years and overpopulation 3 years and over
 PCT24 Sex by college or graduate school enrollment byPCT24 Sex by college or graduate school enrollment by
age for the population 15 years and overage for the population 15 years and over
 PCT25 Sex by age by educational attainment for thePCT25 Sex by age by educational attainment for the
population 18 years and overpopulation 18 years and over
 Other tablesOther tables
(selected) SF4 Tables by Age(selected) SF4 Tables by Age
 PCT3 Sex by age (individual year)PCT3 Sex by age (individual year)
 PCT5 Sex by age for the population inPCT5 Sex by age for the population in
householdshouseholds
 PCT35 Sex by marital status by age for thePCT35 Sex by marital status by age for the
population 15 years and overpopulation 15 years and over
 PCT38 Age by language spoken at home byPCT38 Age by language spoken at home by
ability to speak English for the population 5ability to speak English for the population 5
years and overyears and over
 PCT44 Sex by age by citizenship statusPCT44 Sex by age by citizenship status
 PCT62 Sex by school enrollment by age for thePCT62 Sex by school enrollment by age for the
population 3 years and overpopulation 3 years and over
Heating Fuel
Bedrooms
Kitchen facilities
Mortgage status
Plumbing
Real estate taxes
Rooms
Selected monthly owner costs (utilities, insurance,
fuel costs)
Telephone service
Units in structure
Value of home or monthly rent paid
Vehicles available
Year moved into residence
Year structure built
SF3 Housing Variables
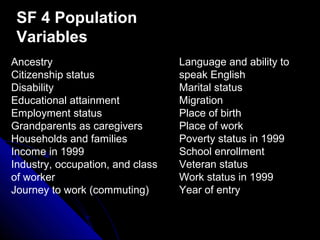
Ancestry
Citizenship status
Disability
Educational attainment
Employment status
Grandparents as caregivers
Households and families
Income in 1999
Industry, occupation, and class
of worker
Journey to work (commuting)
Language and ability to
speak English
Marital status
Migration
Place of birth
Place of work
Poverty status in 1999
School enrollment
Veteran status
Work status in 1999
Year of entry
SF 4 Population
Variables
Bedrooms
Heating Fuel
Kitchen facilities
Mortgage status
Plumbing facilities
Real estate taxes
Rooms
Selected monthly owner costs (utilities, insurance,
fuel costs)
Telephone service
Units in structure
Value of home or monthly rent paid
Vehicles available
Year moved into structure
Year structure built
SF3 Housing Variables
Other FilesOther Files
 Congressional District Summary FilesCongressional District Summary Files
 State Legislative District Summary FileState Legislative District Summary File
 P.L. 94-171 Redistricting Summary FileP.L. 94-171 Redistricting Summary File
CPS – November SupplementCPS – November Supplement
 Aggregate data and microdata from aAggregate data and microdata from a
surveysurvey
 CPS collected every March, VoterCPS collected every March, Voter
Supplement in November since 1960Supplement in November since 1960
 Reports gives geography down to state;Reports gives geography down to state;
microdata down to county and principalmicrodata down to county and principal
cities.cities.
CPS Report VariablesCPS Report Variables
 Registered populationRegistered population
 VotedVoted
 NonVotersNonVoters
 CitizenshipCitizenship
(consistently since(consistently since
1994)1994)
 Reasons for notReasons for not
registeringregistering
Geographies:Geographies:
 U.S.U.S.
 StateState
 RegionRegion
CPS Report VariablesCPS Report Variables
 TenureTenure
 Duration at ResidenceDuration at Residence
 Veteran StatusVeteran Status
 SexSex
 AgeAge
 RaceRace
 Hispanic or LatinoHispanic or Latino
 Nativity StatusNativity Status
 Marital StatusMarital Status
 Educational AttainmentEducational Attainment
 Family IncomeFamily Income
 Employment StatusEmployment Status
CPS Microdata FileCPS Microdata File
 See questionnaire for questions askedSee questionnaire for questions asked
and codebook for variablesand codebook for variables
 Richer study of the data – can cross-Richer study of the data – can cross-
tabulate variablestabulate variables
 Geography down to the city levelGeography down to the city level
 No party affiliationNo party affiliation
Voter Registration Search
Information available for a voter registered in Los Angeles County is
the person's name, political party,
birth date/place, mailing address if provided, and whether the
registration is active or canceled. Pursuant to State law the voter's
residence address is confidential. The general public is welcome to
call or come into the office noted below and access this information
free of charge. Telephone inquiries are limited to three names.
Persons coming in the office are required to sign a User's Log. If you
are unable to come into the office, you may mail in a written request
for voter record information. There is a $5 non-refundable voter file
record search fee charge per name and year checked. A certified
copy of a voter record can be obtained for $6.50, which includes the
search fee. A written request for a record must include the person's
name and birth date.
Elections:Who Decides

More Related Content

Similar to Elections:Who Decides

Data Reference Interview
Data Reference InterviewData Reference Interview
Data Reference InterviewLynda Kellam
 
Data Reference Interview
Data Reference InterviewData Reference Interview
Data Reference InterviewLynda Kellam
 
No Data Librarian, No Cry
No Data Librarian, No CryNo Data Librarian, No Cry
No Data Librarian, No CryLynda Kellam
 
DemographyThe scientific study of population.U.S. Ce.docx
DemographyThe scientific study of population.U.S. Ce.docxDemographyThe scientific study of population.U.S. Ce.docx
DemographyThe scientific study of population.U.S. Ce.docxcuddietheresa
 
Census Operations and How to Fill Out the Form
Census Operations and How to Fill Out the FormCensus Operations and How to Fill Out the Form
Census Operations and How to Fill Out the Formebarbad
 
Making It Cout: Using the 2010 US Census in Grant Writing
Making It Cout: Using the 2010 US Census in Grant WritingMaking It Cout: Using the 2010 US Census in Grant Writing
Making It Cout: Using the 2010 US Census in Grant WritingIllinois ResourceNet
 
Sxsw hispanic 3.15.11
Sxsw hispanic 3.15.11Sxsw hispanic 3.15.11
Sxsw hispanic 3.15.11Jerry Rocha
 
DemographyThe scientific study of population.– U.S.docx
DemographyThe scientific study of population.– U.S.docxDemographyThe scientific study of population.– U.S.docx
DemographyThe scientific study of population.– U.S.docxcargillfilberto
 
Rely to these to questions1. I believe that we should con.docx
Rely to these to questions1. I believe that we should con.docxRely to these to questions1. I believe that we should con.docx
Rely to these to questions1. I believe that we should con.docxcarlt4
 
MDC and LDC Populations WorksheetDemography is the statistical s
MDC and LDC Populations WorksheetDemography is the statistical sMDC and LDC Populations WorksheetDemography is the statistical s
MDC and LDC Populations WorksheetDemography is the statistical sAbramMartino96
 
LGBT Latinos in the Social Justice Sexuality Project vs. U.S. Latina/os
LGBT Latinos in the Social Justice Sexuality Project  vs. U.S. Latina/osLGBT Latinos in the Social Justice Sexuality Project  vs. U.S. Latina/os
LGBT Latinos in the Social Justice Sexuality Project vs. U.S. Latina/ossocialjusticesexuality
 
Race in Information Techology
Race in Information TechologyRace in Information Techology
Race in Information TechologyAll Things Open
 
Final Presentation- Tahsina Mame
Final Presentation- Tahsina MameFinal Presentation- Tahsina Mame
Final Presentation- Tahsina MameNadia Ayman
 
Aetna Presentation Latino Demographics
Aetna Presentation Latino DemographicsAetna Presentation Latino Demographics
Aetna Presentation Latino DemographicsDanny Santibanez
 
Genealogical DNA test
Genealogical DNA testGenealogical DNA test
Genealogical DNA testShilpa Verma
 
Immigration Research: Numbers and Findings
Immigration Research: Numbers and FindingsImmigration Research: Numbers and Findings
Immigration Research: Numbers and Findingsborderzine
 

Similar to Elections:Who Decides (20)

Data Reference Interview
Data Reference InterviewData Reference Interview
Data Reference Interview
 
Data Reference Interview
Data Reference InterviewData Reference Interview
Data Reference Interview
 
No Data Librarian, No Cry
No Data Librarian, No CryNo Data Librarian, No Cry
No Data Librarian, No Cry
 
DemographyThe scientific study of population.U.S. Ce.docx
DemographyThe scientific study of population.U.S. Ce.docxDemographyThe scientific study of population.U.S. Ce.docx
DemographyThe scientific study of population.U.S. Ce.docx
 
Census Operations and How to Fill Out the Form
Census Operations and How to Fill Out the FormCensus Operations and How to Fill Out the Form
Census Operations and How to Fill Out the Form
 
Making It Cout: Using the 2010 US Census in Grant Writing
Making It Cout: Using the 2010 US Census in Grant WritingMaking It Cout: Using the 2010 US Census in Grant Writing
Making It Cout: Using the 2010 US Census in Grant Writing
 
Overview of the Census - Doig
Overview of the Census - DoigOverview of the Census - Doig
Overview of the Census - Doig
 
Sxsw hispanic 3.15.11
Sxsw hispanic 3.15.11Sxsw hispanic 3.15.11
Sxsw hispanic 3.15.11
 
Census 2020: Barriers, Attitudes, and Motivators Study
Census 2020: Barriers, Attitudes, and Motivators StudyCensus 2020: Barriers, Attitudes, and Motivators Study
Census 2020: Barriers, Attitudes, and Motivators Study
 
DemographyThe scientific study of population.– U.S.docx
DemographyThe scientific study of population.– U.S.docxDemographyThe scientific study of population.– U.S.docx
DemographyThe scientific study of population.– U.S.docx
 
3.4 Effectively Collecting, Coordinating, and Using Youth Data
3.4 Effectively Collecting, Coordinating, and Using Youth Data3.4 Effectively Collecting, Coordinating, and Using Youth Data
3.4 Effectively Collecting, Coordinating, and Using Youth Data
 
Rely to these to questions1. I believe that we should con.docx
Rely to these to questions1. I believe that we should con.docxRely to these to questions1. I believe that we should con.docx
Rely to these to questions1. I believe that we should con.docx
 
MDC and LDC Populations WorksheetDemography is the statistical s
MDC and LDC Populations WorksheetDemography is the statistical sMDC and LDC Populations WorksheetDemography is the statistical s
MDC and LDC Populations WorksheetDemography is the statistical s
 
LGBT Latinos in the Social Justice Sexuality Project vs. U.S. Latina/os
LGBT Latinos in the Social Justice Sexuality Project  vs. U.S. Latina/osLGBT Latinos in the Social Justice Sexuality Project  vs. U.S. Latina/os
LGBT Latinos in the Social Justice Sexuality Project vs. U.S. Latina/os
 
Pop geog 1
Pop geog 1Pop geog 1
Pop geog 1
 
Race in Information Techology
Race in Information TechologyRace in Information Techology
Race in Information Techology
 
Final Presentation- Tahsina Mame
Final Presentation- Tahsina MameFinal Presentation- Tahsina Mame
Final Presentation- Tahsina Mame
 
Aetna Presentation Latino Demographics
Aetna Presentation Latino DemographicsAetna Presentation Latino Demographics
Aetna Presentation Latino Demographics
 
Genealogical DNA test
Genealogical DNA testGenealogical DNA test
Genealogical DNA test
 
Immigration Research: Numbers and Findings
Immigration Research: Numbers and FindingsImmigration Research: Numbers and Findings
Immigration Research: Numbers and Findings
 

More from uclagovinfolibrarian

More from uclagovinfolibrarian (13)

IDCC 2011, What Your Tweets Tell Us About You, Appendix A
IDCC 2011, What Your Tweets Tell Us About You, Appendix AIDCC 2011, What Your Tweets Tell Us About You, Appendix A
IDCC 2011, What Your Tweets Tell Us About You, Appendix A
 
IDCC 2011, What Your Tweets Tell Us About You, Appendix B
IDCC 2011, What Your Tweets Tell Us About You, Appendix BIDCC 2011, What Your Tweets Tell Us About You, Appendix B
IDCC 2011, What Your Tweets Tell Us About You, Appendix B
 
Gov infoandyou fridayforum2011
Gov infoandyou fridayforum2011Gov infoandyou fridayforum2011
Gov infoandyou fridayforum2011
 
Map Scanning Project Presentation
Map Scanning Project Presentation Map Scanning Project Presentation
Map Scanning Project Presentation
 
Online election tools
Online election toolsOnline election tools
Online election tools
 
Office hourssign
Office hourssignOffice hourssign
Office hourssign
 
Public policydataworkshopflyer
Public policydataworkshopflyerPublic policydataworkshopflyer
Public policydataworkshopflyer
 
CDL Web at Risk Project, UCLA Local and NGO Collections
CDL Web at Risk Project, UCLA Local and NGO CollectionsCDL Web at Risk Project, UCLA Local and NGO Collections
CDL Web at Risk Project, UCLA Local and NGO Collections
 
American Community Survey
American Community SurveyAmerican Community Survey
American Community Survey
 
GODORT SLDTF 2009 Meeting Outline
GODORT SLDTF 2009 Meeting OutlineGODORT SLDTF 2009 Meeting Outline
GODORT SLDTF 2009 Meeting Outline
 
Public Policy and the Library
Public Policy and the LibraryPublic Policy and the Library
Public Policy and the Library
 
Gov Info and You!
Gov Info and You!Gov Info and You!
Gov Info and You!
 
CLA Digital Collection Development
CLA Digital Collection DevelopmentCLA Digital Collection Development
CLA Digital Collection Development
 

Elections:Who Decides

  • 1. Elections: Who DecidesElections: Who Decides Voter Demographics,Voter Demographics, Registration and TurnoutRegistration and Turnout
  • 2. Government Sources:Government Sources: Decennial CensusDecennial Census Current Population Survey,Current Population Survey, November SupplementNovember Supplement Report of RegistrationReport of Registration (Secretary of(Secretary of State, County Registrar)State, County Registrar) Statement of VoteStatement of Vote (Secretary of(Secretary of State, County Registrar)State, County Registrar) 
  • 3. Non-governmental SourcesNon-governmental Sources News SourcesNews Sources (LexisNexis, NYT,(LexisNexis, NYT, LA Times, etc.)LA Times, etc.) Opinion PollsOpinion Polls (Roper Center iPoll)(Roper Center iPoll) SurveysSurveys (other than CPS, ICPSR)(other than CPS, ICPSR)
  • 4. The research question:The research question: How many Latinos in Los Angeles areHow many Latinos in Los Angeles are eligible to vote?eligible to vote?  GeographyGeography   Time periodTime period   Population and Units ofPopulation and Units of AnalysisAnalysis   Los Angeles cityLos Angeles city  Current 2000-2008Current 2000-2008  Individuals 18 andIndividuals 18 and older, race/ethnicity =older, race/ethnicity = hispanichispanic
  • 5. Creating a Voter ProfileCreating a Voter Profile  Who are the electorate?Who are the electorate?  What do they look like demographically?What do they look like demographically?  Who is the "typical" Democrat/Republican.Who is the "typical" Democrat/Republican.  Who seems to be the "typical" voter?Who seems to be the "typical" voter?
  • 6. Defining the Research QuestionDefining the Research Question  GeographyGeography:: Physical areas, GovernmentPhysical areas, Government units, Political boundaries, Other – schoolunits, Political boundaries, Other – school districts, etc.districts, etc.  Time periodTime period:: “Current”, Historical, Over time“Current”, Historical, Over time  Population & Units of analysisPopulation & Units of analysis:: Gender,Gender, age, etc.Race, ethnicity, ancestry,etc.age, etc.Race, ethnicity, ancestry,etc. Persons, Households, Other – schools,Persons, Households, Other – schools, hospitals, etc.hospitals, etc.
  • 7. Defining the Research QuestionDefining the Research Question  Questionnaire:Questionnaire: What was asked? WhatWhat was asked? What information was collected?information was collected?  Variables in the dataset:Variables in the dataset: How are theHow are the responses organized? What are theresponses organized? What are the response categories?response categories?  Context:Context: What is your hypothesis? What willWhat is your hypothesis? What will the data tell you?the data tell you?
  • 8. Research Discovery ContinuumResearch Discovery Continuum (Mapping the Questions to Sources)(Mapping the Questions to Sources)  Statistical Sources-Statistical Sources- compilations or publishedcompilations or published statistics by an agency - summary statistics; maystatistics by an agency - summary statistics; may not have all the geographies but will help younot have all the geographies but will help you determine the source of the data; often going todetermine the source of the data; often going to the agency responsible for collecting the data,the agency responsible for collecting the data, you can get statistics, aggregate data, and inyou can get statistics, aggregate data, and in many cases microdata.many cases microdata.  News ArticlesNews Articles - newspapers will report- newspapers will report statistics, sometimes at a local level; good forstatistics, sometimes at a local level; good for finding out votes cast, turnout immediately andfinding out votes cast, turnout immediately and the source of the data.the source of the data.
  • 9. Research Discovery ContinuumResearch Discovery Continuum (Mapping the Questions to Sources)(Mapping the Questions to Sources)  Scholarly ArticlesScholarly Articles - studies that examine a particular- studies that examine a particular question and utilized standard data sources or createquestion and utilized standard data sources or create their own; a good way to find out source survey andtheir own; a good way to find out source survey and microdatamicrodata  Data SourcesData Sources - using a source that indexes surveys and- using a source that indexes surveys and microdata, likemicrodata, like ICPSRICPSR can help you locate studycan help you locate study detailes, questionnaires, codebooks and variables thatdetailes, questionnaires, codebooks and variables that cover what you study, especially if the publishedcover what you study, especially if the published statistics from a government agency does not collect thestatistics from a government agency does not collect the information. Reading the codebooks, questionnaires,information. Reading the codebooks, questionnaires, and other documentation will help you determine whichand other documentation will help you determine which datasets you can use, if the information collected willdatasets you can use, if the information collected will cover the variables you want.cover the variables you want.
  • 10. Who is Eligible to Vote?Who is Eligible to Vote?  U.S. CitizenU.S. Citizen  18 years or older18 years or older  Specific State LawsSpecific State Laws Criminal HistoryCriminal History ResidencyResidency Mental competencyMental competency Loyalty OathLoyalty Oath
  • 11. Voter Demographics via theVoter Demographics via the Decennial CensusDecennial Census  Most comprehensive source on theMost comprehensive source on the demographics and socio-economic statusdemographics and socio-economic status of the American people for multipleof the American people for multiple geographies.geographies.  Does not collect political party or religiousDoes not collect political party or religious affiliations (see questionnaires)affiliations (see questionnaires)  Tables by age, by citizenship statusTables by age, by citizenship status  Fact Finder is aggregate dataFact Finder is aggregate data
  • 12. Source – 2000 Decennial CensusSource – 2000 Decennial Census via American Fact Findervia American Fact Finder
  • 13. Fact Sheets in Fact Finder Total number of people 18 and older
  • 14.
  • 15.
  • 16.
  • 17.
  • 18. Summary FilesSummary Files SF 1 and SF 2SF 1 and SF 2  100% Data – Short Form100% Data – Short Form  All geographies in US and PuertoAll geographies in US and Puerto RicoRico  Basic population and housingBasic population and housing variables:variables:  AgeAge  SexSex  RaceRace  Hispanic or Latino OriginHispanic or Latino Origin  Household TypeHousehold Type  RelationshipRelationship  Group QuartersGroup Quarters  Tenure: Own or RentTenure: Own or Rent  Vacancy StatusVacancy Status  SF 2 provides “many” detailedSF 2 provides “many” detailed race variablesrace variables  SF 3 and SF 4SF 3 and SF 4  Sample Data 1 in 6 – LongSample Data 1 in 6 – Long FormForm  All Geographies except forAll Geographies except for Blocks in US and Puerto RicoBlocks in US and Puerto Rico  Detailed population, housing,Detailed population, housing, socio-economic variablessocio-economic variables  SF 4 provides 336 race,SF 4 provides 336 race, ethnicity, and ancestryethnicity, and ancestry variablesvariables
  • 19. Ability to speak English Ancestry Citizenship status Class of worker Disability Farm Residence Educational attainment Employment status Grandparents as caregivers Income in 1999 Industry Journey to work (commuting) Language spoken at home Marital status Migration Occupation Place of birth Place of work Poverty status in 1999 School enrollment Veteran status Work status in 1999 Year of entry SF 3 Population Variables
  • 20. Making TablesMaking Tables Quick TablesQuick Tables  Data TablesData Tables  Custom TablesCustom Tables  Geographic Comparison TablesGeographic Comparison Tables
  • 21. SF 1 Tables by AgeSF 1 Tables by Age  P5 Race for the population 18 years and overP5 Race for the population 18 years and over  P6 Hispanic or Latino, and not Hispanic or Latino by raceP6 Hispanic or Latino, and not Hispanic or Latino by race for the population 18 years and overfor the population 18 years and over  P12, P12A- I Sex by age (race variable) groupingsP12, P12A- I Sex by age (race variable) groupings  PCT 12, 12A-O Sex by Age (race variable) single yearPCT 12, 12A-O Sex by Age (race variable) single year  PCT 13, 13A-I Sex by age (People in Households, racePCT 13, 13A-I Sex by age (People in Households, race variable)variable)  P20 Households by age of householder by householdP20 Households by age of householder by household type by presence of own children*type by presence of own children*  P38 Group quarters population by sex by age by groupP38 Group quarters population by sex by age by group quarters type (institutionalized and non)quarters type (institutionalized and non)  PCT 17, 17A-17I Group quarters population by sex byPCT 17, 17A-17I Group quarters population by sex by age by group quarters type (institutionalized and non,age by group quarters type (institutionalized and non, race variablerace variable
  • 22. SF2 Tables By AgeSF2 Tables By Age Fewer tables, more race and ethnicityFewer tables, more race and ethnicity variablesvariables  PCT 3 Sex by age (individual year)PCT 3 Sex by age (individual year)  PCT 5 Sex by age (groupings)PCT 5 Sex by age (groupings)  PCT 11 Households by age ofPCT 11 Households by age of householder by household type byhouseholder by household type by presence of own childrenpresence of own children
  • 23. (selected) SF 3 Tables by Age(selected) SF 3 Tables by Age  P8 Sex by Age (individual years up to 21; groupings 22-P8 Sex by Age (individual years up to 21; groupings 22- 24 and over)24 and over)  P19 Age by language spoken at home by ability toP19 Age by language spoken at home by ability to speak English for the population 5 years and overspeak English for the population 5 years and over  P39 Sex by age by armed forces status by veteranP39 Sex by age by armed forces status by veteran status for the population 18 years and overstatus for the population 18 years and over  P87 Poverty status in 1999 by ageP87 Poverty status in 1999 by age  PCT23 Sex by school enrollment by age for thePCT23 Sex by school enrollment by age for the population 3 years and overpopulation 3 years and over  PCT24 Sex by college or graduate school enrollment byPCT24 Sex by college or graduate school enrollment by age for the population 15 years and overage for the population 15 years and over  PCT25 Sex by age by educational attainment for thePCT25 Sex by age by educational attainment for the population 18 years and overpopulation 18 years and over  Other tablesOther tables
  • 24. (selected) SF4 Tables by Age(selected) SF4 Tables by Age  PCT3 Sex by age (individual year)PCT3 Sex by age (individual year)  PCT5 Sex by age for the population inPCT5 Sex by age for the population in householdshouseholds  PCT35 Sex by marital status by age for thePCT35 Sex by marital status by age for the population 15 years and overpopulation 15 years and over  PCT38 Age by language spoken at home byPCT38 Age by language spoken at home by ability to speak English for the population 5ability to speak English for the population 5 years and overyears and over  PCT44 Sex by age by citizenship statusPCT44 Sex by age by citizenship status  PCT62 Sex by school enrollment by age for thePCT62 Sex by school enrollment by age for the population 3 years and overpopulation 3 years and over
  • 25.
  • 26.
  • 27.
  • 28.
  • 29.
  • 30.
  • 31.
  • 32. Heating Fuel Bedrooms Kitchen facilities Mortgage status Plumbing Real estate taxes Rooms Selected monthly owner costs (utilities, insurance, fuel costs) Telephone service Units in structure Value of home or monthly rent paid Vehicles available Year moved into residence Year structure built SF3 Housing Variables
  • 33. Ancestry Citizenship status Disability Educational attainment Employment status Grandparents as caregivers Households and families Income in 1999 Industry, occupation, and class of worker Journey to work (commuting) Language and ability to speak English Marital status Migration Place of birth Place of work Poverty status in 1999 School enrollment Veteran status Work status in 1999 Year of entry SF 4 Population Variables
  • 34. Bedrooms Heating Fuel Kitchen facilities Mortgage status Plumbing facilities Real estate taxes Rooms Selected monthly owner costs (utilities, insurance, fuel costs) Telephone service Units in structure Value of home or monthly rent paid Vehicles available Year moved into structure Year structure built SF3 Housing Variables
  • 35. Other FilesOther Files  Congressional District Summary FilesCongressional District Summary Files  State Legislative District Summary FileState Legislative District Summary File  P.L. 94-171 Redistricting Summary FileP.L. 94-171 Redistricting Summary File
  • 36.
  • 37.
  • 38.
  • 39.
  • 40.
  • 41.
  • 42. CPS – November SupplementCPS – November Supplement  Aggregate data and microdata from aAggregate data and microdata from a surveysurvey  CPS collected every March, VoterCPS collected every March, Voter Supplement in November since 1960Supplement in November since 1960  Reports gives geography down to state;Reports gives geography down to state; microdata down to county and principalmicrodata down to county and principal cities.cities.
  • 43.
  • 44.
  • 45. CPS Report VariablesCPS Report Variables  Registered populationRegistered population  VotedVoted  NonVotersNonVoters  CitizenshipCitizenship (consistently since(consistently since 1994)1994)  Reasons for notReasons for not registeringregistering Geographies:Geographies:  U.S.U.S.  StateState  RegionRegion
  • 46. CPS Report VariablesCPS Report Variables  TenureTenure  Duration at ResidenceDuration at Residence  Veteran StatusVeteran Status  SexSex  AgeAge  RaceRace  Hispanic or LatinoHispanic or Latino  Nativity StatusNativity Status  Marital StatusMarital Status  Educational AttainmentEducational Attainment  Family IncomeFamily Income  Employment StatusEmployment Status
  • 47. CPS Microdata FileCPS Microdata File  See questionnaire for questions askedSee questionnaire for questions asked and codebook for variablesand codebook for variables  Richer study of the data – can cross-Richer study of the data – can cross- tabulate variablestabulate variables  Geography down to the city levelGeography down to the city level  No party affiliationNo party affiliation
  • 48.
  • 49.
  • 50.
  • 51.
  • 52.
  • 53.
  • 54.
  • 55.
  • 56.
  • 57.
  • 58.
  • 59.
  • 60.
  • 61.
  • 62.
  • 63.
  • 64.
  • 65.
  • 66.
  • 67.
  • 68. Voter Registration Search Information available for a voter registered in Los Angeles County is the person's name, political party, birth date/place, mailing address if provided, and whether the registration is active or canceled. Pursuant to State law the voter's residence address is confidential. The general public is welcome to call or come into the office noted below and access this information free of charge. Telephone inquiries are limited to three names. Persons coming in the office are required to sign a User's Log. If you are unable to come into the office, you may mail in a written request for voter record information. There is a $5 non-refundable voter file record search fee charge per name and year checked. A certified copy of a voter record can be obtained for $6.50, which includes the search fee. A written request for a record must include the person's name and birth date.

Editor's Notes

  1. Interuniversity Consortium for Political and Social Research – have to be a member to download; anyone can search the holdings
  2. P20 = unit of analysis is households not individuals; but you can see how many households have children over 18. P table = population PCT P12 vs. PCT 12 age grouping vs. year by year
  3. County totals, Congressional, , by city