EKONOMI KITARAN DALAM PENGURUSAN BUANGAN TERJADUAL STRATEGI NASIONAL KE ARAH INDUSTRI MAMPAN.pdf
1.
PEMBENTANGAN 3
EKONOMI KITARANDALAM
PENGURUSAN BUANGAN
TERJADUAL: STRATEGI NASIONAL
KE ARAH INDUSTRI MAMPAN
WAN MUJAHID BIN WAN HAMIDON
AURECON LESTARI SDN BHD
2.
OVERVIEW
OF THE
PRESENTATION
The presentationwill offer insights
on circular economy
implementation in scheduled
waste management.
The Need for
Circular
Economy 02
Circular
Economy: An
Overview
Circular Economy
in Scheduled
Waste
Management
03
01
Challenges
and Way
Forward
04
MALAYSIA’S ECONOMIC TRANSFORMATION
Agriculture&
Commodities
New Economic
Policy (NEP)
1971
Manufacturing
Rubber
Tin
Electric & Electronics
Automobiles
The 1970s marked a pivotal era in
Malaysia’s economic transformation.
Recognising the limitations of an
agriculture-based economy, the
government, under the New
Economic Policy (NEP) launched in
1971, began to shift the economic
focus towards industrialization.
5.
GROSS DOMESTIC PRODUCTVS SCHEDULED WASTE GENERATION
0
200,000
400,000
600,000
800,000
1,000,000
1,200,000
1,400,000
1,600,000
1,800,000
0
1,000
2,000
3,000
4,000
5,000
6,000
7,000
8,000 2005
2006
2007
2008
2009
2010
2011
2012
2013
2014
2015
2016
2017
2018
2019
2020
2021
2022
2023
GDP
(RM
Million)
Scheduled
Waste
Generation
('000
MT)
Scheduled Waste Generation GDP (RM Mil)
The rapid industrialisation that
propelled Malaysia’s economic growth
has introduced an increasingly urgent
consequence: the escalating
generation of scheduled waste.
As manufacturing and processing
activities intensified, the volume of
hazardous by-products followed the
same upward trajectory, revealing a
direct link between economic progress
and environmental pressure.
This trend is clearly illustrated when we
observe an upward trend in both Gross
Domestic Product (GDP) and
scheduled waste generation over
recent years.
6.
SW 205
Waste
gypsum
11.5%
Chemical
Industry
9.8%
Metal
Fabrications
10.5%
MAJOR SCHEDULEDWASTE GENERATORS AND TYPES
Contributed up to 78% of
scheduled waste generation
among industrial sectors over
the nine-year period (2015-
2023).
Power Plant
Electric &
Electronic
Water Treatment
Plant
SW
Prescribed
Premises
Contributed up to 74%
of the overall SW generated
over the nine-year period (2015-
2023).
SW 104
Dust, slag, dross or
ash containing
heavy metal
SW 204
Sludges
containing one
or several heavy
metal
SW 305
Spent
lubricating oil
33.6%
9.2% 7.8%
8.4%
43.6% 15.1% 3.8%
COSTS OF LINEARECONOMY
Depleting Natural
Resources
Degrading
Environment
Burdening the
Landfills
Losing
Resources
Finite resources like fossil fuels,
minerals, and fresh water are
consumed faster than they can
regenerate.
Resource extraction (mining,
logging) harms ecosystems and
biodiversity. High carbon
emissions from production and
waste contribute to global
warming.
Landfills are rapidly filling up with
hazardous waste and more land is
needed for waste disposal, reducing
space for agriculture or urban
development.
Products are designed for disposal
rather than reuse or recycling, leading to
a loss of valuable materials. Valuable
inputs (precious metals) are wasted
instead of being reinvested into the
production cycle
Linear thinking, in essence, ignores the full lifecycle of materials. It focuses on output and growth,
without accounting for where those materials come from or where they end up.
Saving Energy andReducing
Emissions
Manufacturing new products from scratch often
requires more energy and releases more
greenhouse gases than reusing or recycling.
For example, it takes far less energy to recycle
aluminum than to extract it from raw bauxite. By
focusing on reuse and recycling, a circular
economy reduces greenhouse gas emissions,
which helps combat climate change.
Reducing Waste and Pollution
Every year, hundred thousand of tons of
scheduled waste are sent to landfills. Scheduled
waste may be hazardous poses particular
challenges for the environment. Through circular
economy principles, waste can be minimized,
reused, or repurposed rather than disposed of,
helping protect natural resources and reducing
pollution in land, water, and air.
Conserving Resources
Natural resources like water, minerals, and fossil fuels
are finite, meaning they will eventually run out if we
continue to use them irresponsibly. The circular
economy helps conserve these resources by keeping
materials circulating and extending their useful
life. For instance, when electronics are recycled,
valuable metals and components are recovered and
can be reused in new products instead of mining
fresh resources.
Creating Economic Opportunities
The shift to a circular economy creates new business
opportunities in Malaysia and around the world.
Repair services, remanufacturing businesses, and
recycling facilities are just a few examples. As
companies find innovative ways to extend the life of
products and materials, they can lower costs, add
value, and create jobs in emerging “green” industries.
BENEFITS OF CIRCULAR ECONOMY
CIRCULAR ECONOMY PRINCIPLES
CircularEconomy
Economic system that uses a systemic approach to maintain a circular flow of resources, by
recovering, retaining or adding to their value, while contributing to sustainable development
Principles
Environmental
system
Social
system
Economic
system
1. System thinking – Taking a life cycle perspective and apply long-
term approach when considering their impacts on environmental,
social and economic system.
2. Value creation – Recover, retain or add value by providing effective
solutions that contribute to socio-economic and environmental value
and efficient use of resources.
3. Value sharing – collaboration along the value chain or value
network in an inclusive and equitable way, for benefit of society
4. Resource stewardship – Manage resources in a sustainable way
5. Resource traceability – Collect and maintain data to enable
tracking of resources
6. Ecosystem resilience – develop and implement practices and
strategies that protect and contribute to resilience and regeneration
of ecosystems
15.
Support Circular EconomyTransition
Actions
Contributing
to a Circular
Economy
Creation of
Added Value
Value
Retention
Value
Recovery
Planning and design that enables
optimization of product, resource
circulation and prevention of
waste generation
Retaining the value, for both resource
and product by extending the purpose of
usage for as long and many as possible
Actions that will ultimately lead to
the conservation and continuous
renewal of natural resources
Recover the value of waste either
by product, component or material
with the goal to reintroduce them
into new products or processes
Regeneration
of Ecosystems
Creating a system that supports and enables circular economy within and
between industries and organizations
Residuals
Input
16.
Value Retention
Retaining thevalue, for both resource and product by extending the purpose of usage for as long and many
as possible
• Reduce, Reuse, Repurpose
• Maintenance and repair
• Performance based approaches
ACTIONS CONTRIBUTING TO CIRCULAR ECONOMY
• Sharing to intensify use
• Refurbishing
• Remanufacturing
Creation of Added Value
Planning and design that enables optimization of product and resource circulation and prevention of waste
generation
• Design for circularity
• Circular sourcing
• Circular procurement
• Process optimization
• Industrial, regional or urban symbiosis
17.
ACTIONS CONTRIBUTING TOCIRCULAR ECONOMY
Regeneration of Ecosystems
Actions that will ultimately lead to the conservation and continuous renewal of natural resources.
Support Circular Economy Transition
Creating a system that supports and enables circular economy within and between industries and
organizations
• Education and research
• Innovation
• Collaboration and Networks
• Behaviour changes
Value Recovery
Recover the value of waste either by product, component or material with the goal to reintroduce them into
new products or processes
• Cascade resources
• Recycling
• Waste management
• Material recovery
• Energy recovery
• Policy and legal system
• Financial services
• Digitalization
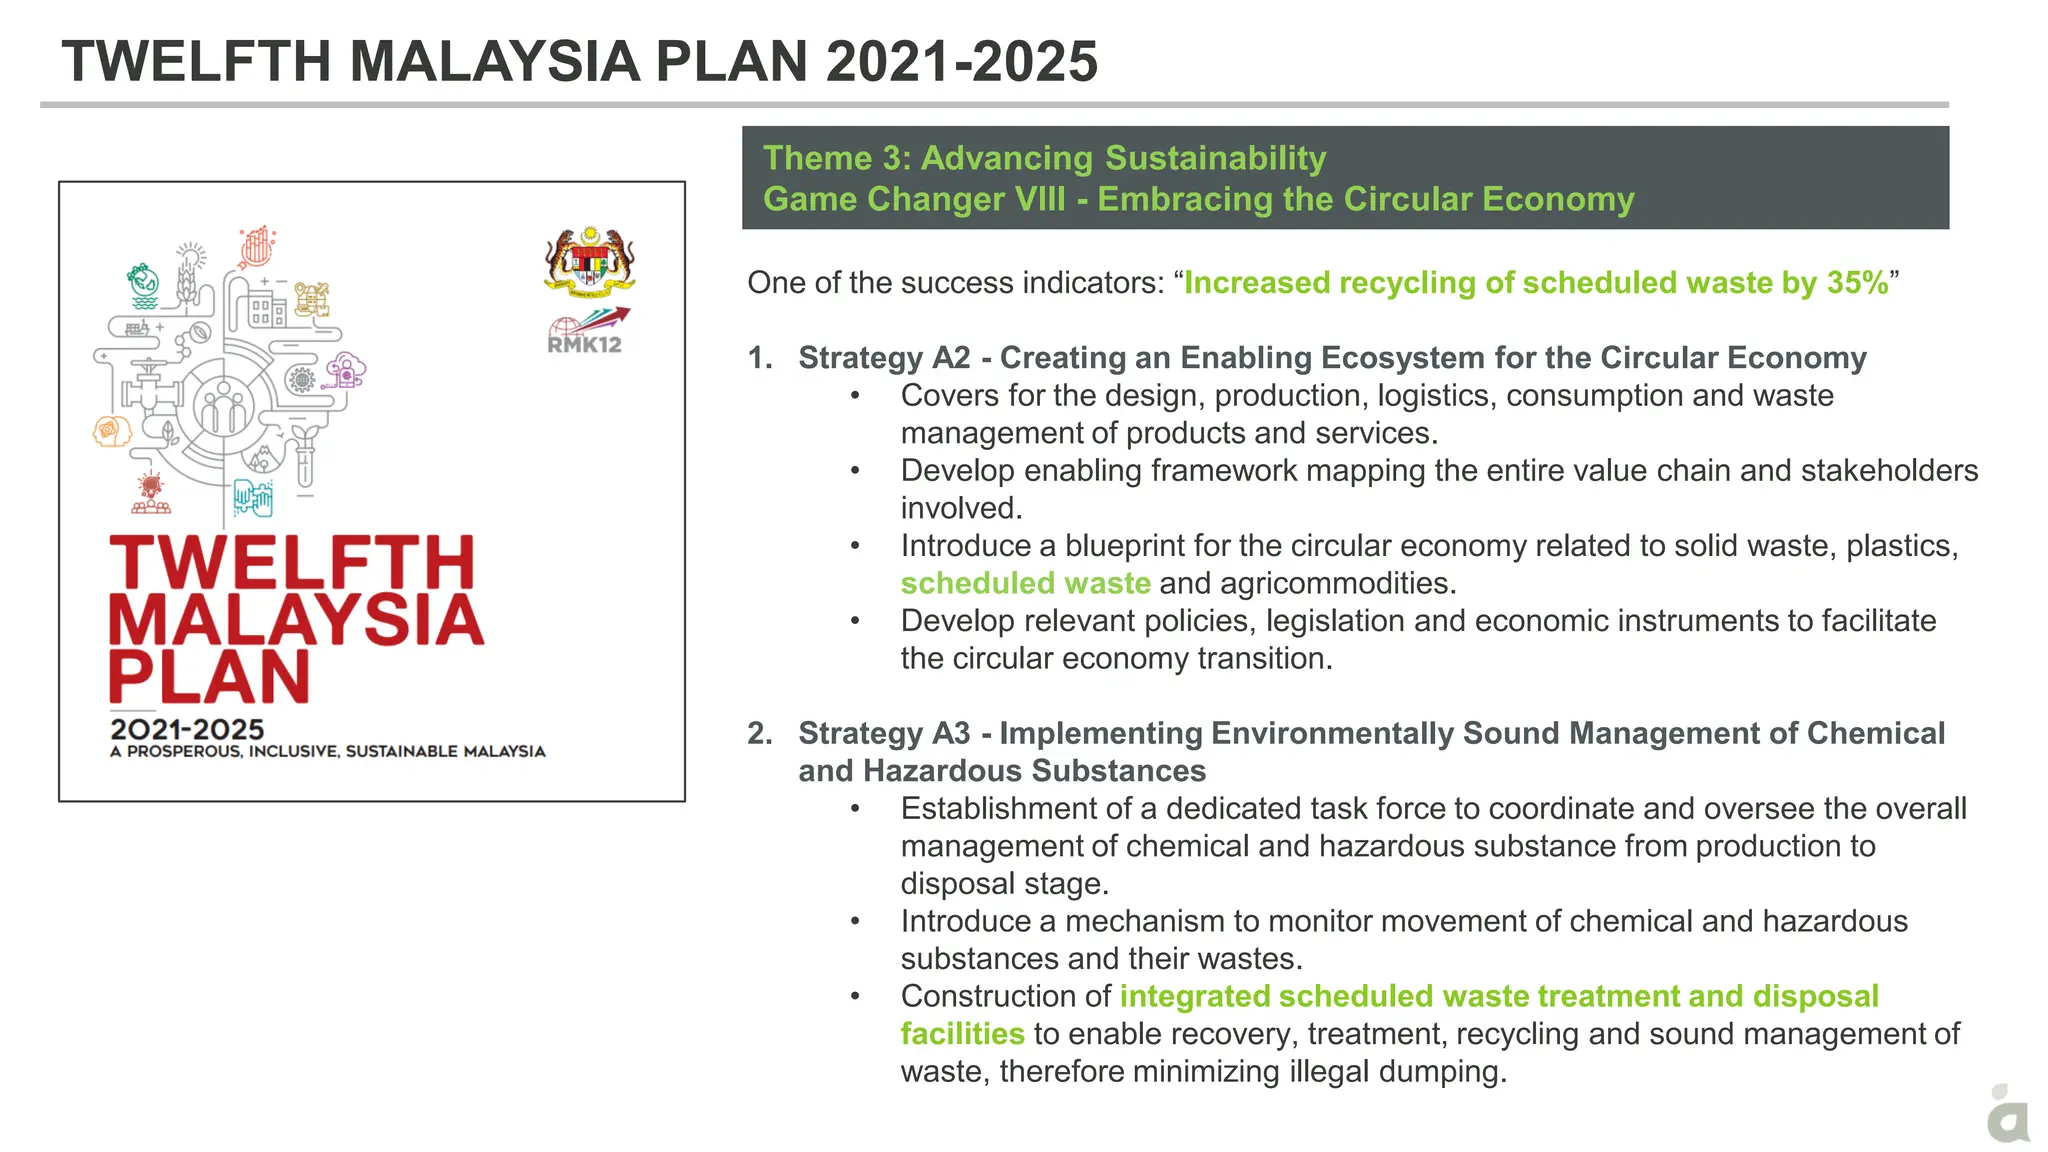
TWELFTH MALAYSIA PLAN2021-2025
One of the success indicators: “Increased recycling of scheduled waste by 35%”
1. Strategy A2 - Creating an Enabling Ecosystem for the Circular Economy
• Covers for the design, production, logistics, consumption and waste
management of products and services.
• Develop enabling framework mapping the entire value chain and stakeholders
involved.
• Introduce a blueprint for the circular economy related to solid waste, plastics,
scheduled waste and agricommodities.
• Develop relevant policies, legislation and economic instruments to facilitate
the circular economy transition.
2. Strategy A3 - Implementing Environmentally Sound Management of Chemical
and Hazardous Substances
• Establishment of a dedicated task force to coordinate and oversee the overall
management of chemical and hazardous substance from production to
disposal stage.
• Introduce a mechanism to monitor movement of chemical and hazardous
substances and their wastes.
• Construction of integrated scheduled waste treatment and disposal
facilities to enable recovery, treatment, recycling and sound management of
waste, therefore minimizing illegal dumping.
Theme 3: Advancing Sustainability
Game Changer VIII - Embracing the Circular Economy
20.
National Circular Economy
Councilof Malaysia
• Chaired by the Prime Minister & led by the
Ministry of Housing and Local Government
(KPKT).
• Technical working group undertake circular
economy agenda for specific resources, and
comprise of several representative ministries,
such as Ministry of Natural Resource and
Environmental Sustainability (NRES), Ministry of
Works (KKR), Ministry of International Trade and
Industry (MITI) and Ministry of Agriculture and
Food Industries (MAFI).
• The lead agency for the implementation of
circular economy agenda for scheduled
waste is DOE.
NATIONAL CIRCULAR ECONOMY COUNCIL IN MALAYSIA
Supreme Committee Chairman:
Prime Minister
Executive Committee Chairman:
Minister of KPKT
Technical Working Group Committee (TWG) Chairman:
Secretary General of KPKT
TWG 1
Plastics
TWG 2
Water
TWG 3
C&D
TWG 4
Organic &
Agricultural
TWG 5
Scheduled Waste
TWG 6
Steel, Paper, Glass,
Fabric & Rubber
NRES
NRES
KKR
MAFI
DOE
MITI
SECRETARIAT: KPKT
21.
OTHER RELATED PLANSAND POLICIES
New Industrial Master
Plan 2030 (NIMP)
Circular Economy Policy
Framework for the
Manufacturing Sector
Green Technology Master Plan
Malaysia 2017-2030
Circular Economy Blueprint for
Solid Waste 2025-2035
Lead Ministry
Ministry of International Trade
and Industry (MITI)
Ministry of International Trade
and Industry (MITI)
Ministry of Natural Resource and
Environmental Science (NRES)
Ministry of Housing and Local
Government (KPKT)
CE
Considerations
Under “Mission 3: Push Net
Zero” where planning in
works to develop a CE
framework for the industry as
a catalyst for new green
growth areas
Framework that emphasizes
on the role of manufacturers in
the CE value chain
Under the goal to achieve
sustainable utilization of natural
resources, waste management was
identified as one of the target key
sectors.
Has the goal to transform solid
waste management from linear
economy to circular economy which
aims to close the loop of material
cycle.
Key
Information
Outline Malaysia’s direction in
industrial development.
Understanding the
responsibilities of key
enablers (manufacturers &
industries) along value chain
for implementation of CE.
Highlights on the plan in the
assessing the feasibility and
market creation for green
technology within the waste
management sector.
Guides Malaysia towards a circular
economy while supporting economic
prosperity and strengthens
ecological resilience, reflecting the
nation’s commitment to a cleaner
and more sustainable future.
22.
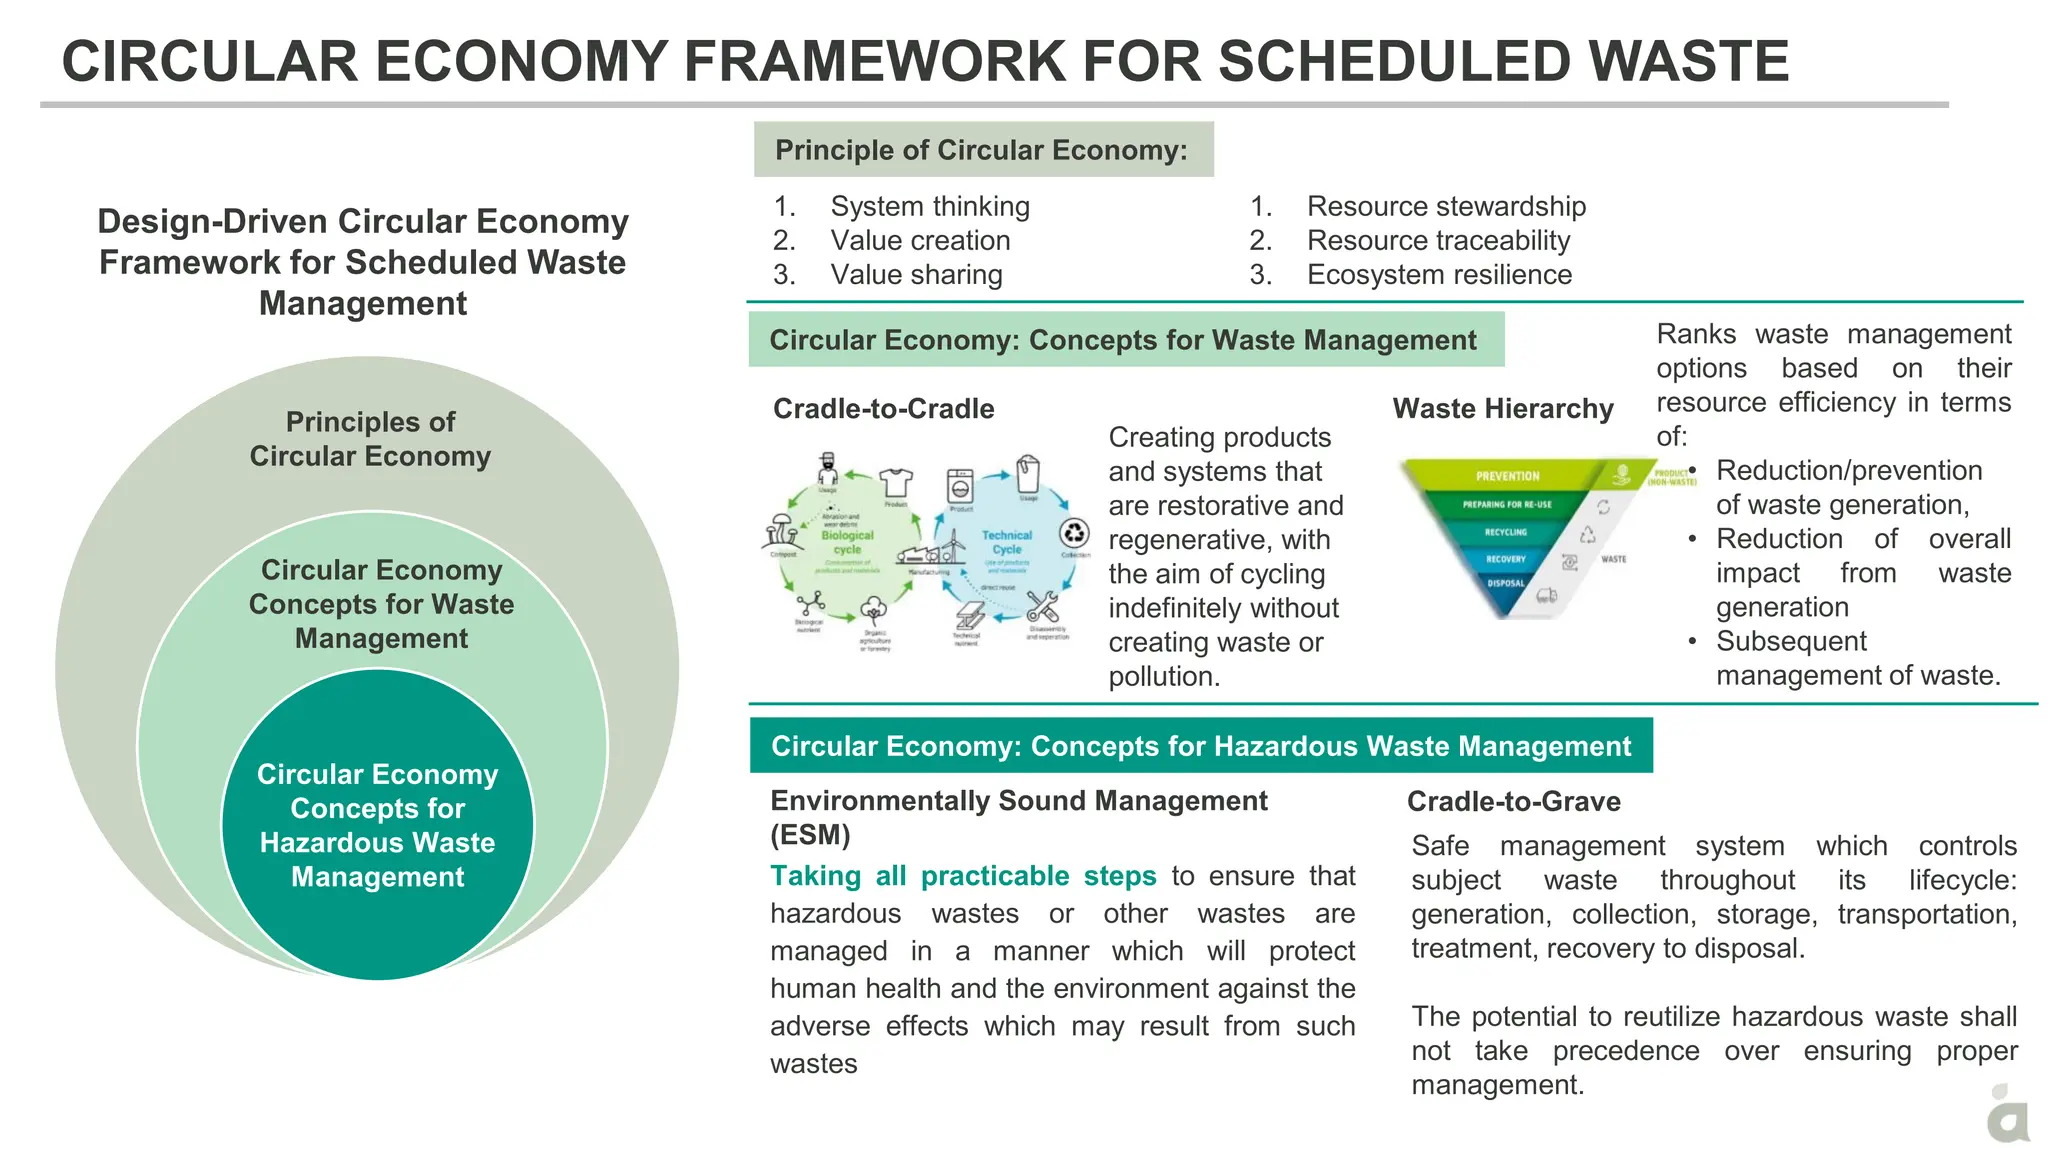
CIRCULAR ECONOMY FRAMEWORKFOR SCHEDULED WASTE
Design-Driven Circular Economy
Framework for Scheduled Waste
Management
1. System thinking
2. Value creation
3. Value sharing
Waste Hierarchy
Cradle-to-Cradle
Creating products
and systems that
are restorative and
regenerative, with
the aim of cycling
indefinitely without
creating waste or
pollution.
Ranks waste management
options based on their
resource efficiency in terms
of:
• Reduction/prevention
of waste generation,
• Reduction of overall
impact from waste
generation
• Subsequent
management of waste.
Environmentally Sound Management
(ESM)
Cradle-to-Grave
Safe management system which controls
subject waste throughout its lifecycle:
generation, collection, storage, transportation,
treatment, recovery to disposal.
The potential to reutilize hazardous waste shall
not take precedence over ensuring proper
management.
Taking all practicable steps to ensure that
hazardous wastes or other wastes are
managed in a manner which will protect
human health and the environment against the
adverse effects which may result from such
wastes
Principle of Circular Economy:
Circular Economy: Concepts for Waste Management
Circular Economy: Concepts for Hazardous Waste Management
Principles of
Circular Economy
Circular Economy
Concepts for Waste
Management
Circular Economy
Concepts for
Hazardous Waste
Management
1. Resource stewardship
2. Resource traceability
3. Ecosystem resilience
23.
AVAILABLE PLANS FORSCHEDULED WASTES MANAGEMENT
Strategic Plan for the Management of Scheduled
Waste (PASCA), 2015
• Aims to provide governance guidance to the
enforcement agency and all other SW
management stakeholders
• Promote waste management that improves
environmental sustainability and economic
competitiveness, based on the principle of
“cradle-to-cradle” and through strengthening of
the 4R principle.
1 2
DOE Strategic Plan 2021-2030
• Aims to improve DOE services align
with the national development agenda
through effective strategies
• Initiative to 50% increase in recycling
rate for scheduled waste by 2030,
compared to 17% recycling rate in 2020
24.
CURRENT LEGISLATION FORSCHEDULED WASTE MANAGEMENT
Legal Provisions
Environmental Quality Act 1974
• Governed by Section 34B (Prohibition against placing, depositing, etc of
scheduled wastes)
• No person is allowed to engage in the following activities without prior written
approval from the Director General of the Department of Environment (DOE)
Subsidiary Legislation under EQA 1974
• Environmental Quality (Scheduled Wastes) Regulations 2005;
• Environmental Quality (Prescribed Conveyance) (Scheduled Wastes) Order
2005;
• Environmental Quality (Prescribed Premises) (Scheduled Wastes Treatment
and Disposal Facilities ) Order 1989; and
• Environmental Quality (Prescribed Premises) (Scheduled Wastes Treatment
and Disposal Facilities ) Regulations 1989.
Department of Environment (DOE)
Hazardous Substance Division is responsible for overseeing and enforcing the EQA
(Scheduled Wastes) Regulations 2005
TERMS AND DEFINITIONS
Sources:
1ISO 59004:2024
2 EU WFD (2018)
3 Basel Convention Glossary of Terms (2017)
4 MCMC Technical Code (2019)
5 Basel’s Technical Guidelines on the Environmentally Sound Co-Processing of Hazardous Waste in Cement Kilns (2011)
6 Environmental Quality (PP) (Scheduled Wastes Treatment and Disposal Facilities) Order 1989
Reduce 1
Measures to be taken before a substance, material or
product has become waste, that reduce the amount
of waste through increasing the efficiency in
product manufacturer or by consuming fewer virgin
materials (input).
Reuse 1&2
Using again of discarded product or substance for
the same or alternative purposes for which it was
conceived that promotes resource efficiency
without the necessity of pre-processing. This
includes bringing waste back into use.
Example 1:
Using coal with lower ash content in coal fired power
plant can reduce the generation of SW 104 – Bottom
Ash.
Example 2:
Plant is designed for complete combustion which
reduces generation of SW 104 – Ash.
Example:
Reuse is typically through special management
such as:
1. Use as soil conditioner.
2. Use as neutralization agent.
3. Use for backfilling.
4. Reuse of contaminated container.
27.
Sources:
1 ISO 59004:2024
2EU WFD (2018)
3 Basel Convention Glossary of Terms (2017)
4 MCMC Technical Code (2019)
5 Basel’s Technical Guidelines on the Environmentally Sound Co-Processing of Hazardous Waste in Cement Kilns (2011)
6 Environmental Quality (PP) (Scheduled Wastes Treatment and Disposal Facilities) Order 1989
Recovery 1,2&5
Recapturing and reutilizing recoverable resources
specifically which will be use for reuse,
remanufacturing, recycling or other methods that can
add or retain value of a resource. This includes
material recovery/reclamation, material
reprocessing to be used as fuel and energy
recovery; where energy recovery is only an end-
of-life operation.
Final Disposal 2&4
Operations that result in final disposition,
placement or destruction of waste, which is not
recovery even where the operation has a
secondary consequence the reclamation of
substances or energy.
Treatment 2&4
Processing operations that change the
biological or physico-chemical properties of
waste, including interim operations which
prepare waste prior to reuse, recovery or final
disposal operations.
Material Recovery:
Recovery of Platinum Group Metals (PGMs) from
waste catalysts.
Energy Recovery: High-calorific-value scheduled
waste such as oily sludge (SW306) is increasingly
used as alternative fuel (AF) in co-processing .
TERMS AND DEFINITIONS
28.
TERMS AND DEFINITIONS
AspectDisposal Recovery
Main purpose
To get rid of waste permanently (final placement,
destruction).
To extract value: reuse, recycle, or recover
energy/materials.
Examples
- Landfilling - Recycling of materials
- Deep injection - Composting/anaerobic digestion
- Surface impoundment - Solvent regeneration
- Release to water bodies - Energy recovery via incineration
- Incineration without energy recovery - Use as fuel in cement kilns
- Permanent storage - Reuse/refurbishment of products
Energy aspect
If heat or energy is produced, it’s only incidental
and not used productively.
Energy recovery is intentional and efficient: e.g.,
electricity, steam, hot water, or district heating.
Incineration
Incineration without energy recovery → classified
as disposal.
Incineration with energy recovery (meeting
efficiency standards) → classified as recovery.
Outcome
No further use; waste is destroyed or permanently
stored.
Waste substitutes for raw materials or fuels;
outputs are fed back into the economy.
Physical Chemical BiologicalThermal
Relies on physical
characteristics of the waste
materials in order to separate
the hazardous waste
constituents
Using chemical reagents to
change the chemical structure
of the constituents
Microorganisms degrade or
detoxify the hazardous waste
components present
Reduction of volume and
toxicity of the wastes using
high temperature
Examples
Absorption, Evaporation,
Filtration, Gravity Separation,
Magnetic Separation,
Sedimentation, Microwave
Radiation, Thickening,
Ultrasonic Separation
SW Code*
All SW except for SW203,
SW403, SW431 and SW501
Examples
Chemical Dehalogenation,
Fenton Process, Hydrolysis,
Immobilization, Forced
Leaching, Neutralization,
Redox, Ozone-based
Technology, Solvent
Extraction
SW Code*
All SW
Examples
Aerobic Treatment Units,
Biological Reactors,
Anaerobic Digestion
Systems, Bioleaching, Bio-
Reclamation, Land Farming,
Vermicomposting
SW Code*
SW101, SW102, SW103,
SW104, SW105, SW106,
SW107, SW108, SW110,
SW202, SW204, SW205,
SW309, SW318, SW319,
sW320, SW326, SW401,
SW405, SW412, SW416,
SW420, SW425, SW426,
SW427, SW429, SW430
Examples
Autoclaving, Calcination,
Gasification, Molten Salt
Destruction, Pyrolysis,
Incineration, Wet Air
Oxidation
SW Code*
All SW except for SW431
TECHNOLOGIES CONTRIBUTING TO CIRCULAR ECONOMY
PROGRESS TOWARDS CIRCULARECONOMY
• The proportion of scheduled waste subjected to recovery processes including off-site recovery facilities, special
management (excluding scheduled wastes sent to sanitary landfills or disposed of by slow burning) and export to
foreign facilities has remained relatively stable at around 1.42 million MT from 2015 to 2023.
• Although 32% of the scheduled waste is already directed toward recovery in 2023, true progress in circularity will be
achieved when on-site storage is reduced and these materials are reintroduced into the market for further reuse or
recovery.
• This current recovery or recycling rate must be increased by another 13% to achieve the target 50% recycling rate of
scheduled waste in 2030.
-
1,000,000
2,000,000
3,000,000
4,000,000
5,000,000
6,000,000
7,000,000
8,000,000
2015 2016 2017 2018 2019 2020 2021 2022 2023
Scheduled
Waste
Generation
(MT)
Total Waste Generated Recovery
32%
23%
18%
25%
32%
49%
54%
60%
40%
2030
50%
33.
Inconsistent domestic
supply
Marketability ofthe
recovered
materials/products
Lack of platform to
exchange knowledge,
technology, etc.
High investment cost
Competition with
illegal market
Lack of incentives Lack of standard and
guidelines
Lack of awareness
CHALLENGES
34.
SUMMARY OF CHALLENGES
Regulatoryand Policy Challenges
Malaysia’s scheduled waste regulations are in urgent need of
revision to align with circular economy (CE) objectives.
Overclassification of non-hazardous materials as scheduled
waste restricts resource recovery and industrial reuse, while
blanket bans on the importation of certain waste streams hinder
industrial growth even when environmental compliance is
assured.
Existing policies also lack specific provisions for CE
implementation, leading to inconsistent interpretation among
stakeholders, regulatory overlaps, and enforcement gaps.
Additionally, the absence of Extended Producer Responsibility
(EPR) for selected waste streams limits accountability and
impedes the shift toward more sustainable product design and
waste collection systems.
As new industries such as EVs, solar farms, and data centers
emerge, the regulatory framework must evolve to address the
increasing complexity and volume of scheduled waste they
generate.
Operational and Market Challenges
Current waste management operations face major
inefficiencies due to limited visibility of waste availability, poor
coordination between waste generators and potential
receivers, and uncertainty regarding recovery facilities. These
gaps prevent effective waste valorization and inter-industry
collaboration.
Moreover, the lack of standardized technical criteria and
approval procedures for products derived from scheduled
waste creates significant barriers to market entry, regulatory
compliance, and consumer trust. Similarly, the absence of
widely recognized green labelling and certification
mechanisms hampers market acceptance and limits access to
sustainability-driven procurement opportunities.
Public awareness of and confidence in using waste-derived
products remains low, and a lack of coordinated governance
further fragments national CE efforts.
35.
SUMMARY OF CHALLENGES
Financialand Institutional Gaps
The transition to a CE model is also constrained by limited
dedicated funding for research, recovery innovation, and
technological advancement. While a cess mechanism has been
proposed to incentivize progress, current financial support
remains inadequate.
Green procurement initiatives often fail to prioritize products
derived from scheduled waste, missing a powerful lever for
driving market transformation. Additionally, fiscal incentives
meant to support CE adoption are underutilized due to weak
advocacy, limited outreach, and poor stakeholder engagement.
Capacity, Collaboration, and
Innovation Barriers
Capacity-building efforts tailored to CE in scheduled waste
management are notably lacking, reducing the ability of
regulators and industries to implement effective solutions.
Furthermore, collaboration between industries and research
institutions remains fragmented and often narrowly focused on
regulatory compliance rather than innovation and scale-up.
This is compounded by insufficient intellectual property (IP)
protection mechanisms, which deter data sharing, limit cross-
sector innovation, and reduce the commercialization potential
of promising technologies.