The need for transportation services increases due to the heavy traffic in Jakarta. Efficient transport services to congestion in
Jakarta, motorcycle taxi services online such as GO-JEK. This triggers every transportation company to increase customer value
and good service quality to get customer satisfaction in the field of transportation services.
This study aims to describe customer value and service quality to customer satisfaction with descriptive statistic analysis. The
study was conducted to 110 GO-JEK consumers in Jakarta. The sampling technique used was accidental sampling with analysis
tools SPPS 22.
The results show that customer value and service quality give impact to GO-JEK customer satisfaction in Jakarta.
FACTORS AFFECTING THE SERVICES QUALITY AND REPURCHASE INTENTIONIAEME Publication
This study aim is to examine the factors effecting the consumer satisfaction and
repurchase intention. The population is consumer from all 22 branches of One Mart
mini market in Bengkulu Province. Samples are 200 respondents. Data were collected
using a five-point Likert scale. The data analysis tool used is Structural Equation
Model (SEM) using AMOS 22 software. The research shows the following results.
First, service quality does not affect on customer satisfaction. Second, good service
quality affects on customer value. Third, good customer value affect on customer
satisfaction. Fourth, customer satisfaction does not affect on repurchase intention.
Fifth, good customer satisfaction affects on brand choices. Sixth, a good brand choice
affect on consumer repurchase.
International Journal of Humanities and Social Science Invention (IJHSSI)inventionjournals
is an international journal intended for professionals and researchers in all fields of Humanities and Social Science. IJHSSI publishes research articles and reviews within the whole field Humanities and Social Science, new teaching methods, assessment, validation and the impact of new technologies and it will continue to provide information on the latest trends and developments in this ever-expanding subject. The publications of papers are selected through double peer reviewed to ensure originality, relevance, and readability. The articles published in our journal can be accessed online.
6. hapzi ali, et al., 2016, mercu buana univversity,iosr jbbHapzi Ali
Prof. Dr. Hapzi Ali, CMA
Universitas Mercu Buana (Mercu Buana University), Jakarta Indonesia
Bidang Ilmu: Marketing & Business Management, Research Method, MIS, Good Corporate Governance
www.mercubuana.ac.id.
email: hapzi.ali@gmail.com, hapzi.ali@mercubuana.ac.id
Effect Of Quality Services On Customer Satisfaction And Loyalty (Theoritical...inventionjournals
International Journal of Business and Management Invention (IJBMI) is an international journal intended for professionals and researchers in all fields of Business and Management. IJBMI publishes research articles and reviews within the whole field Business and Management, new teaching methods, assessment, validation and the impact of new technologies and it will continue to provide information on the latest trends and developments in this ever-expanding subject. The publications of papers are selected through double peer reviewed to ensure originality, relevance, and readability. The articles published in our journal can be accessed online.
Marketing Mix and Service Quality Effect on Customer Satisfaction and Loyalty...QUESTJOURNAL
ABSTRACT: This study aims to test and empirical analysis the marketing mix and service quality effect on customer satisfaction and customer loyalty, research was conducted in 26 branches in Sulawesi a population of about 16 212 customers of PT. HadjiKalla in Sulawesi who purchase Toyota cars for 2015 with a sample of 390 customers. The results of the analysis of structural equation modelusing AMOS version 20 provide evidence that marketing mix has a positive and significant effect on customer satisfaction and customer loyalty. Service quality is positive and significant effect on customer satisfaction, but insignificant effect on customer loyalty. Customer satisfaction has a positive and significant effect on customer loyalty. Marketing mix and service quality has a significant on customer loyalty as a mediated customer satisfaction. The practical implication of this study provide increased knowledge and understanding of the customer and the company's management in Sulawesi in increasing customer loyalty through marketing mix, service quality and customer satisfaction. Limitations of this study on a sample size using only the customers car brands Toyota and just carried on Sulawesi area that may limit generalizability of the research findings. Originality of this study provide the basis for the development configuration modeling using structural equation model and conceptual models that prove marketing mix and service quality on customer loyalty as a mediated customer satisfaction in previous research done separately. The mediating role of customer satisfaction is proven to increase customer loyalty to the highway.
The purpose of this study is to find out how service quality, brand image, and product quality
affect customer loyalty through customer satisfaction. This study is a census-based study, the object of research
used in this study were 100 respondents
This study aims to examine and analyze the influence of Product Quality, Place, Service Quality and
Promotion partially and or together on customer purchase decisions related to choosing regular savings and
business savings at Bank Mandiri, Gading Serpong, Tangerang Selatan. Research data is obtained by
conducting a survey of customers
Understanding Consumer Perception of Price-Quality- Value RelationshipIJARIIT
In India as the level of competition keep on increasing day by day for automobile market, it is essential for
every automobile company to understand customer insight in order to provide best value judgement. Thus, they need
to understand how consumer compares price-quality-value of an automobile. Therefore, the objectives of this
research is to study the relationships of perceived quality, perceived value and perceived price that will affect
consumers purchase decision towards cars. Survey using convenience sampling was done at Ludhiana city.
Questionnaires were distributed to 320 respondents at the sampling location. Finally a sample of 280 used for final
analyses. The study revealed a positive impact of perceived price over perceived quality; perceived quality over
perceived value and a negative impact of perceived price over perceived value. The results from this research provide
a platform for Ludhiana automobile makers to appreciate consumer value judgement and how it affects their
purchase decision. In order to ensure that the findings are illustrative and convincing, future research should
include more constructs like brand image of an automobile, customer experience, culture etc.
Factors Affecting On Customer Retention: A Case Study of Cellular Industry o...paperpublications3
Abstract: The aim of this study is to investigate the effect of price perception, customer satisfaction, brand image, switching barriers (switching cost, interpersonal relationship and attractiveness of alternative) and trust towards the Customer retention in the cellular industry of Pakistan. This study adds many other supporting materials especially for the literature review; a model is used by this study to find the effect of the factors on customer retention. The data was collected from the customers in Lahore who are subscribers one of the cellular company (Mobilink, U-Fone, Telenor, Warid, and Zong) of Pakistan. The data is analyzed with the help of the multiple regression analysis. Out of seven variables tested it is found that switching barriers (interpersonal relationship and switching cost), brand image, price perception, trust and customer satisfaction have the effect on customer retention. However, customer satisfaction has little to do to increase the customer retention. This study also provides evidence that the higher switching barrier of attractiveness of the alternative lower will be the customer retention. This current study has its own limitation since this research is only conducted in Lahore area. Therefore the finding of the study is unable to be generalized for the whole population of mobile users in Pakistan as the sample size is measured small. The findings can help the service providers to find the effect of customer satisfaction, price perception, trust, brand image and switching barriers towards the customer retention.
Keywords: customer satisfaction, brand image, price perception, trust, switching barriers, customer retention.
This study investigates the relationship among customer satisfaction, customer trust, switching cost, and
customer loyalty in mobile telecommunication service market of Pakistan. Built on the review of pertinent
literature a research framework is developed based on the mediation of customer trust and moderation of
switching cost on the relationship of customer satisfaction with customer loyalty. The data were collected
from 515 customers in mobile telecommunication service market of Pakistan through convenience
sampling. Correlation matrix and ordinary least squares regression analyses are used to determine the
relationship among the variables. The findings confirm the framework that customer trust partially
mediates the relationship of customer satisfaction with customer loyalty. Switching cost has no moderating
effect in determining the relationship of customer satisfaction with customer trust and customer loyalty in
mobile telecommunication service market of Pakistan. This study addresses the importance of customer
satisfaction, customer loyalty, customer trust, and switching cost for the mobile telecommunication service
firms. The findings suggest that the firms should enhance customer satisfaction in order to gain customer
trust and customer loyalty. The significant relationships between the variables suggest that the research
framework is applicable to the firms of mobile telecommunication service market of Pakistan. Further, this
is probably among the first studies which look at mobile telecommunication service market of Pakistan in
context of customer satisfaction, customer trust, customer loyalty, and switching cost. The most obvious
finding to emerge from this study is that customer satisfaction and customer trust are the key determinants
in predicting customer loyalty.
Customer experience in supermarkets and hypermarkets – A comparative studyiosrjce
IOSR Journal of Business and Management (IOSR-JBM) is a double blind peer reviewed International Journal that provides rapid publication (within a month) of articles in all areas of business and managemant and its applications. The journal welcomes publications of high quality papers on theoretical developments and practical applications inbusiness and management. Original research papers, state-of-the-art reviews, and high quality technical notes are invited for publications.
The Effect of Service Quality on Loyalty using Satisfaction as an Intervening...IJAEMSJORNAL
This research aims to discover and analyse the effect of service quality on loyalty of entrepreneurs in Bonded Zone using entrepreneurs’ satisfaction as the intervening variable. Research population is Bonded Stockpile Entrepreneurs in the Operational Area of Supervision and the Office of Customs and Excise Type Madya A Bekasi, particularly entrepreneurs in Bonded Zone. According to Slovin's formula, the number of respondents is 70. Data analysis is conducted using path analysis. Result of the research indicates that all proposed hypotheses are accepted and proven true.
The relationship between customer satisfaction and customer loyalty in the ba...Samaan Al-Msallam
Abstract
A large number of studies on customer satisfaction and customer loyalty have been conducted in marketing over
the years. Customer satisfaction is a crucial factor for bank success and it has the possibility to influence
customer loyalty. From a theoretical perspective it is very important to investigate which factors influence
customer satisfaction. This paper analyzes the basic factors which affects customer satisfaction towards services
of Bank. This study adopted empirical research design on the sample size of 401 respondents who were
customers of different banks in Syria. Data is collected through survey questionnaires related to customer
expectation ,price fairness , customer satisfaction and customer loyalty towards services of banks . Data is
analyzed by using AMOS 18. The research reviews the current academic marketing literature and tries to
identify antecedents of customer satisfaction and customer loyalty. The findings from this study also provide
important managerial implications.
Keywords: bank, customer satisfaction, customer loyalty.
The Influence of Service Quality and Price on Customer Satisfaction in the Us...ijtsrd
This research was conducted to determine Service Quality and Price on Consumer Satisfaction, this research uses quantitative methods with causal associative research types. In this study, the population is consumers who use online motorcycle taxis in Medan. The method of taking samples in this study was using an accidental sampling technique of 92 respondents. Data analysis techniques used validity test, reliability test, classic assumption test, multiple linear regression analysis, t test, F test and coefficient of determination R2 using SPSS version 22 application.The results of the t test for the service quality variable t count of 4.348 t table of 1.986 which means that service quality has an effect on customer satisfaction and price variable t count of 0.355 t table of 1.986 which means that price has no effect on customer satisfaction. F test variable service quality and price F count of 12.538 F table 3.10 indicates that service quality and price simultaneously affect consumer satisfaction. John Gilbert Lbn. Raja | Ayu Syaputri | Syamsuddin | Nurmalini "The Influence of Service Quality and Price on Customer Satisfaction in the Use of Ojek Online in Medan Tembung" Published in International Journal of Trend in Scientific Research and Development (ijtsrd), ISSN: 2456-6470, Volume-7 | Issue-2 , April 2023, URL: https://www.ijtsrd.com.com/papers/ijtsrd56185.pdf Paper URL: https://www.ijtsrd.com.com/management/consumer-behaviour/56185/the-influence-of-service-quality-and-price-on-customer-satisfaction-in-the-use-of-ojek-online-in-medan-tembung/john-gilbert-lbn-raja
International Journal of Business and Management Invention (IJBMI)inventionjournals
International Journal of Business and Management Invention (IJBMI) is an international journal intended for professionals and researchers in all fields of Business and Management. IJBMI publishes research articles and reviews within the whole field Business and Management, new teaching methods, assessment, validation and the impact of new technologies and it will continue to provide information on the latest trends and developments in this ever-expanding subject. The publications of papers are selected through double peer reviewed to ensure originality, relevance, and readability. The articles published in our journal can be accessed online
Delivering Experiential Markerting and Service Quality to Improve Customer Lo...ijtsrd
In an era of strict transport industry competition, many public transport operators offers many facilities and ease of travel. This brings the consumer has many choices in determining the public trasnportation used PT Kereta Api Indonesia Persero is one of the operators of public transportion perform many general improvements of the quality of service and provide a memorable experience to consumers with the aim of satisfying consumers so that ultimately consumers choose PT. KAI as a leading choice in travel. This research aims to know the influence of Experiential Marketing and Service Quality against Customer Loyalty through the Customer Satisfaction at PT. Kereta Api Indonesia Persero in Surabaya. This research uses a quantitative approach was conducted to find out the causal relationships. The population in this study was consumers PT. KAI and the sample of this research is the consumer who uses the train destination Surabaya to Yogyakarta. The sample in this research as much as 160 respondents taken through purposive sampling technique. The results of this research indicate that any significant proposed hypothesis. So Experiential Marketing and Service Quality against Customer Loyalty through the Customer Satisfaction at PT. Kereta Api Indonesia Persero in Surabaya has a significant effect. Andy Pratama Sulistyo "Delivering Experiential Markerting and Service Quality to Improve Customer Loyalty in Public Transportation" Published in International Journal of Trend in Scientific Research and Development (ijtsrd), ISSN: 2456-6470, Volume-4 | Issue-4 , June 2020, URL: https://www.ijtsrd.com/papers/ijtsrd30975.pdf Paper Url :https://www.ijtsrd.com/management/marketing/30975/delivering-experiential-markerting-and-service-quality-to-improve-customer-loyalty-in-public-transportation/andy-pratama-sulistyo
The Effects of Customer Expectation and Perceived Service Quality on Customer...Samaan Al-Msallam
ABSTRACT : The effect of the antecedents of satisfaction on customer satisfaction is an issue still under debate in the academic literature. Thus, the primary goal of this article is to analyze the relationship between two of the most important antecedents of customer satisfaction ( namely customer expectation and perceived service quality ) and customer satisfaction . Data were collected through a survey, including samples of 250 customers from the 5 Banks in Damascus, Syria . Spss is used to test the hypotheses. The finding show that customer expectation and perceived service quality have a positive effect on customer satisfaction . Bank managers must know how improvement in service quality influences customer satisfaction and what expectation levels they might consider to increase consumer satisfaction which ultimately retains valued customers. KEYWORDS : Customer Expectation , Perceived Service Quality, Customer Satisfaction.
The Effects of Customer Expectation and Perceived Service Quality on Custome...inventionjournals
International Journal of Business and Management Invention (IJBMI) is an international journal intended for professionals and researchers in all fields of Business and Management. IJBMI publishes research articles and reviews within the whole field Business and Management, new teaching methods, assessment, validation and the impact of new technologies and it will continue to provide information on the latest trends and developments in this ever-expanding subject. The publications of papers are selected through double peer reviewed to ensure originality, relevance, and readability. The articles published in our journal can be accessed online.
Chỉ số hài lòng của khách hàng (Customer Satisfaction Index – CSI) - Cơ sở lý...Jackie Nguyen
Việc thỏa mãn khách hàng trở thành một tài sản quý giá của doanh nghiệp trong nỗ lực nâng cao chất lượng dịch vụ; xây dựng lòng trung thành với khách hàng; khẳng định thương hiệu; nâng cao năng lực cạnh tranh của doanh nghiệp.
Sự hài lòng của khách hàng là một chủ đề phổ biến trong thực hành tiếp thị và nghiên cứu học thuật từ nghiên cứu ban đầu của Cardozo (1965) về nỗ lực, sự mong đợi và sự hài lòng của khách hàng.
Giese và Cote, 2000 - Tiếp tục nghiên cứu và có nhiều nỗ lực để đo lường và giải thích sự hài lòng của khách hàng, nhưng vẫn chưa nhận được nhiều sự đồng thuận về định nghĩa của nó.
Gundersen, Heide và Olsson, 1996 - Sự hài lòng của khách hàng thường được định nghĩa là một tiêu chuẩn đánh giá tiêu thụ bài viết liên quan đến một sản phẩm hoặc dịch vụ cụ thể.
Oliver, 1980 - Đây là kết quả của quá trình đánh giá tương phản với kỳ vọng mua trước với nhận thức về hiệu suất trong và sau trải nghiệm tiêu thụ (Oliver, 1980).v.v...
Để có được lý thuyết và mô hình chuẩn ứng dụng như hôm nay, đã trải qua rất nhiều thử nghiệp, nghiên cứu trên thế giới.
---
THANHPHAT TECHNOLOGY LTD | SMARTRETAIL
Hotline/ Zalo: (+84) 935 888 489
Email: sales@SmartRetail.vn
https://smartretail.vn/
https://smartretail.com.vn/
International Journal of Business and Management Invention (IJBMI)inventionjournals
International Journal of Business and Management Invention (IJBMI) is an international journal intended for professionals and researchers in all fields of Business and Management. IJBMI publishes research articles and reviews within the whole field Business and Management, new teaching methods, assessment, validation and the impact of new technologies and it will continue to provide information on the latest trends and developments in this ever-expanding subject. The publications of papers are selected through double peer reviewed to ensure originality, relevance, and readability. The articles published in our journal can be accessed online.
Impact of Gender on Customer Satisfaction for Service Quality: A Case Study o...deshwal852
Satisfaction of customers is an integral part for the success of the business. Customer satisfaction is based on perceived service quality. Service quality is a comparison of expectations with performance. Customer satisfaction is based on perceived service quality. Service quality is a crucial factor for the triumph of the business firm. This study is an attempt to examine the impact of gender on satisfaction level of customers
for service quality in hyper stores. All the relevant data has been collected through a sample survey of 70 customers purchasing goods from hyper stores in South West Delhi. Sample was drawn by convenient sampling. Retail Service Quality Scale was used as measurement instrument. It was developed by Dabholkar, Thrope and Rentz (1996). Likert’s five point scale was used to rate all the variables. A survey
was conducted to verify the hypothesis and research framework. Statistical techniques such as mean,
standard deviation and t- test were used. Major Findings exhibit that there is no significant difference between male and female customers for different variables of service quality in hyper stores.
International Journal of Business and Management Invention (IJBMI) is an international journal intended for professionals and researchers in all fields of Business and Management. IJBMI publishes research articles and reviews within the whole field Business and Management, new teaching methods, assessment, validation and the impact of new technologies and it will continue to provide information on the latest trends and developments in this ever-expanding subject. The publications of papers are selected through double peer reviewed to ensure originality, relevance, and readability. The articles published in our journal can be accessed online.
The Effect Service Quality to Customer Satisfaction and Customer Loyalty of A...IOSR Journals
Customer Loyalty is important for cultivated by the company, therefore the aim of this study to prove
how the effect of Service Quality and Customer Satisfaction in enhancing Customer Loyalty. Samples were
service users Railway Transport Argo Bromo Anggrek Jakarta Surabaya by using purposive side. Sample size of
300 respondents. Data analysis using Structural Equation Model (SEM). The results showed that Services
Quality significantly influence to customer satisfaction. Customer Satisfaction significant effect on Customer
Loyalty. Service Quality is not yet significant effect on Customer Loyalty, so that Customer Satisfaction is a
mediator of the relationship Service Quality on Customer Loyalty to PT Argo Bromo Anggrek Train Jakarta-
Surabaya. The implications that Customer Satisfaction is capable of mediating the quality of care in improving
Customer Loyalty.
International Journal of Business and Management Invention (IJBMI)inventionjournals
International Journal of Business and Management Invention (IJBMI) is an international journal intended for professionals and researchers in all fields of Business and Management. IJBMI publishes research articles and reviews within the whole field Business and Management, new teaching methods, assessment, validation and the impact of new technologies and it will continue to provide information on the latest trends and developments in this ever-expanding subject. The publications of papers are selected through double peer reviewed to ensure originality, relevance, and readability. The articles published in our journal can be accessed online
Brand Equity and Customer Satisfaction as the Mediation of Advertisement infl...IOSRJBM
This research includes explanatory research, samples are taken form Garuda Indonesia Airline international Passenger inbound and outbound flight conducted at several Indonesian International Airport Soekarno Hatta Jakarta, Ngurah Rai Denpasar, Airport Hongkong and Changi Airport Singapore, altogether there are 350 respondents. The Design of non probability sample selection is accidental sampling with the criteria : those who fly international route at least twice a year, Indonesian citizen (not foreigner), and they may also fly non Garuda flights as well, the exogenous variables are advertisement and service quality, the endogenous variables are brand equity and customer satisfaction. Analysis methoed using SEM-PLS and software SmartPLS. The result has several conclusion, First, Advertisement and service quality will increase brand equity, Service quality is very dominant to explain brand equity compared to advertisement, Second, Service quality and brand equity will increase customer satisfaction. Brand equity plays an importamt role to explain consumer’s satisfaction compared to service quality. Third, service quality, brand equity, and customer satisfaction will increase consumer’s loyality. The Loyality of the international passenger of Garuda Indonesia Airline will remain high if supported by strong brand equity and high consumer satisfaction, as a result from service quality granted and the effect of advertisement program which is carried out intensively. Consumer satisfacti
The study was been conceptualized to study the effect of retail service quality on the consumer decision making process for a brand selection. Therefore, to create a distinct position in the marketplace, retailers are focusing on retail service quality that gives a competitive advantage to the company. Exploratory factor analysis was run to understand the retail service quality factors in fashion retail market with relevance to the brand, Moustache. Six components were extracted through Varimax method and rotated component matrix, namely store presentation/display, convenient facilities, problem solving, temperature, store layout and personal interaction. For regression analysis, the hypothesis developed for the research were perceptual service quality of the fashion retail store influences the perceptual quality of the brand and different dimensions of retail service quality influences significantly the perceptual quality of the brand. Significant relationship between perceptual quality of the retail store and perceptual quality of the brand has been established. Cluster analysis was done first by hierarchical method to deduce number of clusters which can be formed, and then the data was further processed through Ward Method in K-Means Cluster Method. Four differentiating segments were concluded with discrete characteristics. The study also attempted to understand the influence of three factors, store outlet/format, assistance and exclusive range, on customer preference. Utility of all the eight options was calculated through conjoint analysis according to the preferences of the customers.
One of the problems in big cities are transportation.They solve this problem by providing mass transportation such bus or train. People use this facility to travel between surrounding cities or within the city. Jakarta recently has a new public transportation called TransJakarta which serving people travelingfrom nearby cities and in the city.In order to move or doing business between places people in Jakarta use TransJakarta This research aims to analyse ticket price, service quality and customer value toward customer satisfaction. We conducted a research by using questionnaires given to thepassangers and developed a model using a multiple regression to process the result from questionnaires. Samples were taken from The number of sample for this reseach was 130 customers taken from one bus stop which passengers traveled from BSD City to Grogol and Slipi. The results from partial testing showed that customer value andservice quality have effect on customer satisfaction while ticket price does not have effect on customer satisfaction.
Similar to Effect of customer value and quality of service on customer satisfaction (case study on (20)
The Role of Community Economic Empowerment to Social Capital and the Implicat...Iwan Kurniawan Subagja
This study to purpose the success of the community economic empowerment program (PNPM Independent
Rural) to social capital and its implications for the welfare of the community, especially the disadvantaged
community in Karawang Regency, West Java Province Indonesia. Selection of Karawang Regency with the
consideration of Karawang Regency has the largest number of pre-prosperous families in West Java Province
Indonesia.This research is explanatory with research population using PNMN Independent Rural profile data in
West Java Province 2013-2015 with 23 districts and 242 villages as well as village research samples with a
research analysis tool using Path Analysis with of LISREL.The results prove that there is a relationship between
community economic empowerment, social capital, and community welfare. Economic empowerment of society
has a positive effect directly on the welfare of society, social capital positively affects the welfare of society and
economic empowerment of society related directly and positive to society prosperity through social capital.
The influence of market orientation, learning orientation, and entrepreneuria...Iwan Kurniawan Subagja
Company performance is a success measurement which is conducted every determined time period. The Performance can be said
as the value of each activity that has been prepared and implemented to identify whether the strategy made in the implementation
has been right or false. This study proposed to examine the variables of market orientation, learning orientation and entrepreneurial
orientation to company performance through innovation. This study was conducted on Small-Medium Enterprises (UKM) Batik
industry of Cirebon with the number of respondents 182 Batik industry enterprises Cirebon. This research is explanatory with
simple random sampling technique and data analysis technique using Structural Equation Modeling (SEM) version 22. The result
of this research reveals four findings; first, market orientation, learning orientation and entrepreneurial orientation have positive
and significant impact on innovation; second, market orientation, learning orientation and entrepreneurial orientation have positive
and significant impact on firm performance; third, innovation has positive and significant impact on firm performance and market
orientation; fourth, learning orientation as well as Entrepreneurial orientation has a positive and significant impact on company
performance through innovation.
The Department of Commerce has determined the economy in the creative industry into 14 (fourteen) sectors: (1) advertising
services, (2) architecture, (3) art and antiques market, (4) craft, (5) design, (6) fashion, (7) video, film and photography, (8)
interactive games (9) music, (10) performing arts, (11) publishing and printing, (12) computer and software services, (13)
television and radio, (14) research and development. Mapping of creative industrial areas is done so that the process of guidance
and distribution of assistance from local and central government and the management of the creative industries from each regi on
focused so that the regions have characteristics in producing the creative industry and can compete in the current era of
globalization. Creative industry in Indonesia began to mushroom in 2007, but many people still do not understand what sectors are
included into the creative industry and its development. With so many people's lack of understanding of the creative industry, it
makes its own homework for the government to socialize the creative industries so that the government seeks to map the creative
industries in Indonesia. Though the creative industry is able to contribute greatly to the Gross Domestic Product (GDP) of an area
and create jobs.
This study aims to further understand the characteristics of creative industries, as well as to identify the constraints and
opportunities faced by creative industry players in Indonesia. To identify and analyze the creative industries used 4 quadrant
statistical methods Location Quadrant (LQ) and Dynamic Location Quotient (DLQ). This study uses secondary data of large and
medium industry statistics as well as small and micro industries in 2010-2013 at Provincial level obtained from the Central Bureau
of Statistics (BPS).
The results of this mapping study will provide a general overview of the creative industries sector that has competitiveness in
every region or province in Indonesia.
PENGARUH KUALITAS LAYANAN DAN KUALITAS PRODUK TERHADAP KEPUASAN PELANGGAN P...Iwan Kurniawan Subagja
Nowadays, the increasing need for transportation services has become a basic and major
requirement. One of the causes of the increasing need for transportation is the interest to carry out various
activities quickly and appropriately. This condition can be seen from the government's support for equitable
regional economic growth by opening all access using various transportation modes created. However, in
utilizing all these facilities, the public or users of transportation services often have limitations in ordering for
various things. Then arose several companies managing transportation services with various facilities either
through the services of land transportation, sea transportation, and air transportation services. In an effort to
serve the needs of these service users, companies use a variety of media and infrastructure that in turn aims to
maximize service and win the competition.
This study aims to analyze the effect of service quality and product quality on customer satisfaction PT.
Rahman Wisata Mandiri Jakarta simultaneously or partially. The number of samples was 42 respondents. The
sampling technique in this research is by using saturation sampling technique. The saturated sample is a
sample determination technique when all members of the population are used as a sample.
The results showed that there is both partial and simultaneous effect of service quality and product quality on
customer satisfaction of PT. Rahman Wisata Mandiri Jakarta.
The improvement in Indonesia's economy gradually is the result of the construction carried out
during this causes additional income and consumer spending patterns. Changes in spending patterns and
consumer spending was particularly noticeable for those who live in urban areas, especially large cities. The
long experience of managing a transport business to support the company's efforts to develop new
technologies and managing human resources, in order to stay ahead. From its headquarters in Jakarta, the
company has developed rapidly penetrated other business while maintaining customer service as a guide. The
long experience of managing a transport business to support the company's efforts to develop new
technologies and managing human resources, in order to stay ahead. From its headquarters in Jakarta, the
company has developed rapidly penetrated other business while maintaining customer service as a guide.
Competition taxis in big cities, especially Jakarta, was now so tight, so the service is more preferred. Hence
the need for a good strategy to win the competition and maintain market share. One was in the company of
Blue Bird Group doing business and marketing strategies to win the competition and maintain market share
taxi transportation in Indonesia. Research methodology in this case with the SWOT analysis, five Poter’s,
matrix’s space and marketing analysis. Methods of data collection is done by conducting research directly
related to the company in order to obtain the necessary data, that is by interview and observation. The result
of research is adding fleet, increasing coverage at the new location, especially at the level of municipalities,
improve service quality and level effesiensi operation, increase limousine division in several cities, improve
prifitabilitas company. Advantage of the company at PT Blue Bird was in corporate governance, natural
environmental management company, in the management of seasonal factors, the application of information
technology, the implementation of safety standards and management.
ANALISIS PENGARUH PERSEPSI OUTLET TERHADAP KREDIBILITAS TENAGA PENJUAL DALAM ...Iwan Kurniawan Subagja
The purpose of this research is to test the influences of salesman characteristic and relationship
quality of salesman on outlet trust perception of salesman to increase outlet loyalty. Using these variables,
the usage of these variables are able to solve the arising problem within PT. Antar Mitra Sembada Bekasi.
The samples size of this research is 100 outlets PT. Antar Mitra Sembada Bekasi. Using the Structural
Equation Modeling (SEM). The results show that the salesman characteristic and relationship quality of
salesman on outlet trust perception of salesman to increase outlet loyalty. The effect of salesman
characteristic on outlet trust perception of salesman are 0,26; The effect relationship quality of
salesman on outlet trust perception of salesman are 0,38; and The effect outlet trust perception of
salesman on outlet loyalty are 0,43.
A SERVICE QUALITY OF ISLAMIC MICROFINANCE IN INDONESIA: AN IMPORTANCE-PERFORM...Iwan Kurniawan Subagja
The rapid growth of financial system in Indonesia creates an intensive competition between Conventional and Islamic financial institutions. The study aims to evaluate the service quality of Islamic Microfinance Institution in Indonesia. The survey was carried out to acquire data from 136 respondents. Descriptive statistics and importance performance analysis (IPA) was used to analyze the data. The finding show that attributes plotted in quadrant “keep up the good work” are providing prompt service, and helpful response to customer requests, Ability in providing services to the customer as needed, prompt service on financial counselling, Ability of staff in giving proper explanation to the customer, Ability to keep the transaction process secure, and Shariah compliance banking products. Meanwhile, the attributes plotted in quadrant “concentrate here” are accessible of location of ATM, easy to access the location, ability to navigate customer to find what they intend, ability to maintain accuracy of bank statement, and ability in providing after sale services. To the best of author’s knowledge, it is the first study that measuring the service quality of Islamic microfinance from customer perspective using importance-performance approach.
ANALISIS FAKTOR-FAKTOR YANG MEMPENGARUHI MINAT BELI ULANG PRODUK SERTA DAMPA...Iwan Kurniawan Subagja
The moving of business peradigm which is full of competition, the company is required to be
always creative and innovative to get survive. So, in developing a product, the company must have a
qualified product, price leadership, and placed the position of the roduct in the market through promotion.The
research data is found through questionnaire from 140 respondents. Then the data got is analyzed using
Structural Equation Modeling (SEM) nalysis technique. To do this analysis technique, there are seven steps
that should be done, namelyextended model on the basic of theory, extended plot diagram, plot diagram
convertion into the equality, the choosing of input matrix and estimation technique, scoring identification of
problem, evaluate criteria goodness of fit and interpretation and modification of model. The proper full
model result got using SEM analysis technique are Chi Square = 146.876, probabilitas = 0.122, RMSEA =
0.033, GFI = 0.903, AGFI = 0.870, CMIN/DF = 1.147, TLI = 0.981, CFI = 0.984. And the hypothesis tested
is known that the product quality influenced toward repeat buying intention, promotion intensity influenced
toward repeat buying intention, perceived price influenced toward repeat buying intention, and repeat buying
intention influenced toward customer loyalty. Based on the research result, there are some managerial
implication which can be used as a review. To increase the repeat buying intention can be done by doing
promotion through arranged frequention, place and show time.
It's another new era of digital and marketers are faced with making big bets on their digital strategy. If you are looking at modernizing your tech stack to support your digital evolution, there are a few can't miss (often overlooked) areas that should be part of every conversation. We'll cover setting your vision, avoiding siloes, adding a democratized approach to data strategy, localization, creating critical governance requirements and more. Attendees will walk away with actions they can take into initiatives they are running today and consider for the future.
Short video marketing has sweeped the nation and is the fastest way to build an online brand on social media in 2024. In this session you will learn:- What is short video marketing- Which platforms work best for your business- Content strategies that are on brand for your business- How to sell organically without paying for ads.
The digital marketing industry is changing faster than ever and those who don’t adapt with the times are losing market share. Where should marketers be focusing their efforts? What strategies are the experts seeing get the best results? Get up-to-speed with the latest industry insights, trends and predictions for the future in this panel discussion with some leading digital marketing experts.
Digital Commerce Lecture for Advanced Digital & Social Media Strategy at UCLA...Valters Lauzums
E-commerce in 2024 is characterized by a dynamic blend of opportunities and significant challenges. Supply chain disruptions and inventory shortages are critical issues, leading to increased shipping delays and rising costs, which impact timely delivery and squeeze profit margins. Efficient logistics management is essential, yet it is often hampered by these external factors. Payment processing, while needing to ensure security and user convenience, grapples with preventing fraud and integrating diverse payment methods, adding another layer of complexity. Furthermore, fulfillment operations require a streamlined approach to handle volume spikes and maintain accuracy in order picking, packing, and shipping, all while meeting customers' heightened expectations for faster delivery times.
Amid these operational challenges, customer data has emerged as an important strategy. By focusing on personalization and enhancing customer experience from historical behavior, businesses can deliver improved website and brand experienced, better product recommendations, optimal promotions, and content to meet individual preferences. Better data analytics can also help in effectively creating marketing campaigns, improving customer retention, and driving product development and inventory management.
Innovative formats such as social commerce and live shopping are beginning to impact the digital commerce landscape, offering new ways to engage with customers and drive sales, and may provide opportunity for brands that have been priced out or seen a downturn with post-pandemic shopping behavior. Social commerce integrates shopping experiences directly into social media platforms, tapping into the massive user bases of these networks to increase reach and engagement. Live shopping, on the other hand, combines entertainment and real-time interaction, providing a dynamic platform for showcasing products and encouraging immediate purchases. These innovations not only enhance customer engagement but also provide valuable data for businesses to refine their strategies and deliver superior shopping experiences.
The e-commerce sector is evolving rapidly, and businesses that effectively manage operational challenges and implement innovative strategies are best positioned for long-term success.
Unleash the power of UK SEO with Brand Highlighters! Our guide delves into the unique search landscape of Britain, equipping you with targeted strategies to dominate UK search engine results. Discover local SEO tactics, keyword magic for UK audiences, and mobile optimization secrets. Get your website seen by the right people and propel your brand to the top of UK searches.
To learn more: https://brandhighlighters.co.uk/blog/top-seo-agencies-uk/
Digital marketing is the art and science of promoting products or services using digital channels to reach and engage with potential customers. It encompasses a wide range of online tactics and strategies aimed at increasing brand visibility, driving website traffic, generating leads, and ultimately, converting those leads into customers.
https://nidmindia.com/
Search Engine Marketing - Competitor and Keyword researchETMARK ACADEMY
Over 2 Trillion searches are made per day in Google search, which means there are more than 2 Trillion visits happening across the websites of the world wide web.
People search various questions, phrases or words. But some words and phrases are searched
more often than others.
For example, the words, ‘running shoes’ are searched more often than ‘best road running
shoes for men’
These words or phrases which people use to search on Google are called Keywords.
Some keywords are searched more often than others. Number of times a keyword is searched
for in a month is called keyword volume.
Some keywords have more relevant results than others. For the phrase “running shoes” we
get more than 80M relevant results, whereas for “best road running shoes for men” we get
only 8.
The former keyword ‘running shoes’ has way more competition from popular websites to
new and small blogs, whereas the latter keyword doesn’t have that much competition. This
search competition for a keyword is called search difficulty of a keyword or keyword
difficulty.
In other words, if the keyword difficulty is ‘low’ or ‘easy’, there won’t be any competition
and if you target such keywords on your site, you can easily rank on the front page of Google.
Some keywords are searched for, just to know or to learn some information about something,
that’s their search intention. For example, “What shoe size should I choose?” or “How to pick
the right shoe size?”
These keywords which are searched just to know about stuff are called informational
keywords. Typically people who are searching this type of keywords are top of a Conversion
funnel.
Conversion funnel is the journey that search visitors go through on their way to an email
subscription or a premium subscription to the services you offer or a purchase of products
you sell or recommend using your referral link.
For some buyers, research is the most important part when they have to buy a product.
Depending on that, their journey either widens or narrows down. These types of buyers are
Researchers and they spend more time with informational keywords.
Conversion is the action you want from your search visitors. Number of conversions that you
get for every 100 search visitors is called Conversion rate.
People who are at different stages of a conversion funnel use different types of keywords.
10 Video Ideas Any Business Can Make RIGHT NOW!
You'll never draw a blank again on what kind of video to make for your business. Go beyond the basic categories and truly reimagine a brand new advanced way to brainstorm video content creation. During this masterclass you'll be challenged to think creatively and outside of the box and view your videos through lenses you may have never thought of previously. It's guaranteed that you'll leave with more than 10 video ideas, but I like to under-promise and over-deliver. Don't miss this session.
Key Takeaways:
How to use the Video Matrix
How to use additional "Lenses"
Where to source original video ideas
Financial curveballs sent many American families reeling in 2023. Household budgets were squeezed by rising interest rates, surging prices on everyday goods, and a stagnating housing market. Consumers were feeling strapped. That sentiment, however, appears to be waning. The question is, to what extent?
To take the pulse of consumers’ feelings about their financial well-being ahead of a highly anticipated election, ThinkNow conducted a nationally representative quantitative survey. The survey highlights consumers’ hopes and anxieties as we move into 2024. Let's unpack the key findings to gain insights about where we stand.
For too many years marketing and sales have operated in silos...while in some forward thinking companies, the two organizations work together to drive new opportunity development and revenue. This session will explore the lessons learned in that beautiful dance that can occur when marketing and sales work together...to drive new opportunity development, account expansion and customer satisfaction.
No, this is not a conversation about MQLs and SQLs. Instead we will focus on a framework that allows the two organizations to drive company success together.
Mastering Local SEO for Service Businesses in the AI Era is tailored specifically for local service providers like plumbers, dentists, and others seeking to dominate their local search landscape. This session delves into leveraging AI advancements to enhance your online visibility and search rankings through the Content Factory model, designed for creating high-impact, SEO-driven content. Discover the Dollar-a-Day advertising strategy, a cost-effective approach to boost your local SEO efforts and attract more customers with minimal investment. Gain practical insights on optimizing your online presence to meet the specific needs of local service seekers, ensuring your business not only appears but stands out in local searches. This concise, action-oriented workshop is your roadmap to navigating the complexities of digital marketing in the AI age, driving more leads, conversions, and ultimately, success for your local service business.
Key Takeaways:
Embrace AI for Local SEO: Learn to harness the power of AI technologies to optimize your website and content for local search. Understand the pivotal role AI plays in analyzing search trends and consumer behavior, enabling you to tailor your SEO strategies to meet the specific demands of your target local audience. Leverage the Content Factory Model: Discover the step-by-step process of creating SEO-optimized content at scale. This approach ensures a steady stream of high-quality content that engages local customers and boosts your search rankings. Get an action guide on implementing this model, complete with templates and scheduling strategies to maintain a consistent online presence. Maximize ROI with Dollar-a-Day Advertising: Dive into the cost-effective Dollar-a-Day advertising strategy that amplifies your visibility in local searches without breaking the bank. Learn how to strategically allocate your budget across platforms to target potential local customers effectively. The session includes an action guide on setting up, monitoring, and optimizing your ad campaigns to ensure maximum impact with minimal investment.
A.I. (artificial intelligence) platforms are popping up all the time, and many of them can and should be used to help grow your brand, increase your sales and decrease your marketing costs.In this presentation:We will review some of the best AI platforms that are available for you to use.We will interact with some of the platforms in real-time, so attendees can see how they work.We will also look at some current brands that are using AI to help them create marketing messages, saving them time and money in the process. Lastly, we will discuss the pros and cons of using AI in marketing & branding and have a lively conversation that includes comments from the audience.
Key Takeaways:
Attendees will learn about LLM platforms, like ChatGPT, and how they work, with preset examples and real time interactions with the platform. Attendees will learn about other AI platforms that are creating graphic design elements at the push of a button...pre-set examples and real-time interactions.Attendees will discuss the pros & cons of AI in marketing + branding and share their perspectives with one another. Attendees will learn about the cost savings and the time savings associated with using AI, should they choose to.
When most people in the industry talk about online or digital reputation management, what they're really saying is Google search and PPC. And it's usually reactive, left dealing with the aftermath of negative information published somewhere online. That's outdated. It leaves executives, organizations and other high-profile individuals at a high risk of a digital reputation attack that spans channels and tactics. But the tools needed to safeguard against an attack are more cybersecurity-oriented than most marketing and communications professionals can manage. Business leaders Leaders grasp the importance; 83% of executives place reputation in their top five areas of risk, yet only 23% are confident in their ability to address it. To succeed in 2024 and beyond, you need to turn online reputation on its axis and think like an attacker.
Key Takeaways:
- New framework for examining and safeguarding an online reputation
- Tools and techniques to keep you a step ahead
- Practical examples that demonstrate when to act, how to act and how to recover
Turn Digital Reputation Threats into Offense Tactics - Daniel Lemin
Effect of customer value and quality of service on customer satisfaction (case study on
1. 28
International Journal of Advanced Scientific Research
ISSN: 2456-0421
Impact Factor: RJIF 5.32
www.allscientificjournal.com
Volume 2; Issue 5; September 2017; Page No. 28-39
Effect of customer value and quality of service on customer satisfaction (Case study on
consumers GO-JEK, Jakarta Indonesia)
Hendri Iskandar, Imam Wibowo, Iwan Kurniawan Subagja
Faculty of Economics, Krisnadwipayana University, Jakarta, Indonesia
Abstract
The need for transportation services increases due to the heavy traffic in Jakarta. Efficient transport services to congestion in
Jakarta, motorcycle taxi services online such as GO-JEK. This triggers every transportation company to increase customer value
and good service quality to get customer satisfaction in the field of transportation services.
This study aims to describe customer value and service quality to customer satisfaction with descriptive statistic analysis. The
study was conducted to 110 GO-JEK consumers in Jakarta. The sampling technique used was accidental sampling with analysis
tools SPPS 22.
The results show that customer value and service quality give impact to GO-JEK customer satisfaction in Jakarta.
Keywords: customer value, quality of service and customer satisfaction
Introduction
Along with the times, we are entering the era of globalization
and modernization. Increasingly sophisticated technology, all
kinds of information and the latest news can be easily
accessible to everyone through online media, electronic media
and print media. In the era of sophisticated competition is
increasingly tight and indirectly affect the business of a
company, where the company is required to understand
consumer behavior. Consumers themselves are the key to
making a profit in market share competition. Therefore, it is
very important for companies to offer and sell quality products
or services with good service to consumers, because this will
trigger customer satisfaction
Understanding of satisfaction is the level of one's feelings
after comparing perceived performance or results compared
with expectations (Susanto, 2010). The definition of
satisfaction is a sense of whether a person's feelings are
satisfactory or disappointing that resulted from a process
comparing the presence or appearance of a product desirable
to the expected values. Customer satisfaction is the feeling of
pleasure or disappointment of a person caused by the
performance or outcome of a perceived product, compared to
his expectations (Kotler and Keller, 2009: 49) [18]
.
Many factors influence consumers to obtain customer
satisfaction, including the price, the price is everything that
was provided by the customer to obtain the advantages offered
by the company marketing mix (Cannon et al, 2008: 176)
[3]
. Price plays a key determinant of customer satisfaction,
because consumers will feel satisfied if the price is appropriate
or not too high. Satisfaction in pricing should be buyers
oriented, when consumers buy a product or service, they trade
a value (value) to get another value (the benefit of owning or
using a product or service). If the consumer considers that the
price is higher than the value of the product or service, then
the consumer will likely not buy the product or service, and
vice versa if the consumer considers the price to be below the
value of the product, then most likely will buy the product.
Product quality is also one of the factors of customer
satisfaction. According to Kotler (2005: 49) [16]
, "The quality
of the product is the whole feature and of a product or service
on the ability to satisfy the stated / implied needs". Buyers will
buy the product if they feel fit, because the product must be
tailored to the desire or the needs of the buyer for successful
product marketing. In other words, product creation is better
oriented to the market desires or consumer tastes. According
to Kotler and Armstrong (2001: 346) [15]
customer satisfaction
is everything that can be offered to the market to get attention,
bought, used, or consumed that can satisfy the desire or needs.
Quality of service or service becomes an important factor to
attract consumers in getting customer satisfaction. Quality of
service is an effort to meet the needs and desires of consumers
and the accuracy of delivery in the balance of consumer
expectations, (Tjiptono, 2007) [31]
. Quality of service is very
important to attract consumers because the quality of service
to distinguish a company with other companies. The better the
services provided by a company, it will affect customer
satisfaction. Good or bad quality of service will affect the
purchase of the product or service itself, and will further affect
customer satisfaction.
Research conducted Karadeniz and Gözüyukri (2016) [14]
, the
results of research to develop the perceived quality of
service (perceived quality of services) offered by the banking
management is a must if they want to remain in the
competition, protect and increase their market share, and
become more attractive. In this study, the effect of the
perceived service quality (perceived service quality) to
customer satisfaction in the banking sector were
investigated. Research conducted by Ikasari, Suryoko and
Nurseto (2013) [12]
, the results showed that customer value and
service quality have positive and significant impact on
2. International Journal of Advanced Scientific Research
29
customer satisfaction, either partially or simultaneously. While
recent research conducted by Suryatiningsih (2013) [28]
, the
results showed that the quality of service and customer value
proven positive effect partially or simultaneously on customer
satisfaction.
In addition to the factors already mentioned, researchers also
focused this study on customer value variables that also plays
an important role in customer satisfaction where the company
must have good value to encourage buying interest in
consumers and its impact on customer satisfaction. Kotler
(2005: 103) [16]
defines customer value as the difference
between total customer value and total customer cost where
total customer value is a set of benefits expected by a
customer of a particular product or service and the total
customer cost is a set of costs expected by the consumer to
evaluate, acquire, use and dispose of products or
services. Basically customer value provides guidance on how
a company can acquire, develop and retain consumers.
This study describes customer value, service quality to
customer satisfaction PT.GO-JEK which is a social soul
company leading the revolution of motorcycle taxi
industry.GO-JEK cooperates with experienced motorcycle
riders in Jakarta, Bandung, Bali and Surabaya. PT.GO-JEK
Indonesia was established in 2011 as an innovative social
entrepreneurship to encourage changes in informal transport
sector in order to operate in a professional manner. In addition
to the shuttle services offered there are other products offered
in the form of applications such as GO-FOOD, GO-RIDE,
GO-MART, GO-SEND, GO-PULSE, GO-BOX, GO-CAR
and its new service is GO-CLEAN, GO -GLAM, GO-
MASSAGE, GO-AUTO, GO-MED, GO-BUSWAY, GO-TIX
and GO-SHOP.
Literature Review
i) Customer Value
According to Kotler (2005: 103) [16]
the value of the customer
is the difference between the total customer value and the total
customer cost in which the total customer value is a set of
benefits expected by the customer of a particular product or
service and the total customer cost is the set of costs expected
by the consumer issued to evaluate, acquire, use and dispose
of products or services. Anderson, et al, states that customer
value is perceived worth in monetary units or a series of
economic benefits, technical, service, and social exchange for
a price that is paid for a product, taking into account the
supply and price of the suppliers available (Tjiptono, 2006:
296) [30]
. Gale and Wood (2006: 297) [8]
formulates customer
value as perceived quality in the market and adjusted
for relative price of the company's products. Vanessa (2007:
65) [7]
, states that the value of the customer or the customer
perceived value that customer perception of the value at which
the company should consider the value in developing products
and services that correspond to what the customer
expects. Kotler and Keller (2009: 14) [18]
states that customer
value is a combination of quality, service, price of a product
offering.
Of the five definitions above can be deduced that basically the
value of customers provide clues how the company can
obtain, develop and retain customers. Thus the value of
customers in the company must develop their skills in
understanding the customer. For that, it is necessary for them
to know how the dimensions of customer value, customer
characteristics, and customer value management focus.
Types of Customer Value
1. Rational value (Rational value), products (product) and
price (price).
2. Emotional value (Emotional value), the value of
equity (equity value), the value of experience (experience
value), and the value of energy (energy value).
(Scott Robinette and Claire Brand, 2001: 22) [23]
.
Customer Value Characteristics
1. The proponent (initiator) of the first people realize their
desires or needs unmet.
2. Influencers (influencers) who provide information about
how the wishes or needs can be met.
3. Decision makers (decider) persons who ultimately choose
the alternative that will satisfy the desires or needs.
4. The buyer (buyer) the buyer of the product.
5. The customer or user (consumer) product users.
6. Assessors (evaluators) persons who provide feedback
about the ability of the products or services selected to
give satisfaction.
Customer Value Indicators
1. Emotional value is a feeling that is felt or experienced by
customers or feelings expected when they transact with an
organization and its employees
2. Social value is a value held by a society, about what is
considered good and what is considered bad by society.
3. Quality / performance value is a utility derived from the
product due to short-term and long-term cost reduction.
4. Price / value of money is a utility derived from a
perception of the expected performance of a product or
service. (Sweeney, 2005: 298) [29]
.
ii) Quality of Service
Parasuraman, et al. (2011: 3) said that the quality of service is
the basis for the marketing of services, because the core
product marketed is a performance (quality), and the
performance is purchased by customers, therefore the quality
of service performance is the basis for marketing
services. According to Parasuraman et al (2009: 16) "service
quality is a measure of how well the service level delivered
matches the customer expectation. Delivery quality service
means conforming to customer expectations on a consistent
basis. " That is, service quality is a measure of how services
are distributed in accordance with customer
expectations. Submission of service quality means alignment
of customer expectations into something consistent. In the
opinion of Parasuraman, et al, (2006: 19) Quality of service is
a comparison between perceived service (perception)
consumers with the quality of service that consumers
expect. According to Zeithaml, et al, (2005: 113) the service
quality of a product or service would be realized if the
expectations of consumers in accordance with the
performance of a given service provider. Definition of service
quality can be interpreted as an effort to meet the needs and
3. International Journal of Advanced Scientific Research
30
desires of consumers and the accuracy of delivery in
counterbalance consumer expectations (Tjiptono, 2007) [31]
.
From the definitions of service quality above can be
concluded that the quality of service is all forms of activities
undertaken by the company to meet consumer
expectations. Services in this case is defined as a service or
a service delivered by the service owner in the form of
convenience, speed, relationships, abilities and hospitality
shown by the attitude and nature in providing services for
customer satisfaction.
Types of Service Quality
1. Timeliness of service, including time to wait during
transaction and payment process.
2. Accuracy of service, is minimize errors in service and
transaction.
3. Courtesy and hospitality when providing service.
4. Ease of service, such as the availability of human
resources to help serve consumers, as well as support
facilities such as computers to find availability of a
product.
5. Consumer crash, such as location, parking lot, comfortable
waiting room, hygiene aspect, availability of information,
and so forth.
Characteristics of Service Quality
1. Customer participation in service process; the presence of
the customer as a participant in the service process
requires an attention to the design of the facility. Such
conditions are not found in traditional manufacturing
companies.
2. Genesis at the same time (simultaneity); the fact that the
service is made to be used simultaneously, so that the
service is not stored. The inability to store these services
precludes the use of traditional manufacturing strategies in
storage to anticipate fluctuations in demand.
3. Direct services and consumables used (service perishabilit
service is a fast-running commodity. This can be seen on
the seats of the discharged aircraft, the non-fit of the
hospital room or the hotel. In each case has caused a loss
of opportunity.
4. Intangibles (intangibility); service is a product of thought
in the form of ideas and concepts. Therefore, service
innovation cannot be patented. To sustain the benefits of
the new service concept, companies must expand rapidly
and precede competitors.
5. Various (heterogeneity); the combination of the intangible
nature of service and the customer as a participant in the
delivery of service systems resulted in a diverse range of
services from consumers to consumers. (Fitzsimmons and
Fitzsimmons, 2006: 21).
Quality of Service Indicators
1. Reliability (reliability), is the ability and reliability to
provide a reliable service.
2. Direct evidence (tangibles), a form of physical
infrastructure service quality offices, computerized
administration, a lounge area, where information.
3. Responsiveness (responsiveness), is the ability to assist
and provide services quickly and accurately, as well as
responsive to the desires of consumers.
4. Guarantee (assurance), the ability and the friendliness and
courtesy of employees in ensuring consumer confidence.
5. Empathy (empathy), a firm but caring attitude from
employees to consumers. (Parasuraman, 2001: 148-149)
[20]
.
iii) Customer Satisfaction
Westbrook and Reilly argue that customer satisfaction is an
emotional response to experiences related to a particular
product or service purchased, retail outlets, or even behavioral
patterns (such as shopping behavior and buying behaviors) as
well as the overall market (Tjiptono, 2006: 349) [30]
. Customer
satisfaction is a central concept in the discourse of business
and management (Tjiptono, 2008: 55) [31]
. Customer
satisfaction is the feeling of pleasure or disappointment of a
person caused by the performance or outcome of a perceived
product, compared to his expectations (Kotler and Keller,
2009: 49) [18]
. Zeithaml and Bitner (2008: 110) [34]
define
customer satisfaction as a customer response to the perceived
misalignment between expectations and actual performance of
services. Customer satisfaction according to Kotler et
al, (2008: 169) [18]
is the level of one's feelings after
comparing the performance (or results) that he perceived
compared to expectations.
It can be concluded that customer satisfaction is a customer
perception that expectations have been met or
exceeded. Customer satisfaction can be achieved if a product
or service meets or exceeds customer expectations, and
customers will feel satisfied. However, customers also do not
necessarily reject the services provided by the company, the
consumer has a tolerance limit on the services provided by the
company. The closer the consumer expectations for the
expected service the greater the likelihood of achieving
satisfaction.
Types of Customer satisfaction.
1. Functional Satisfaction, is the satisfaction obtained from
the function or usage of a product.
2. Psychological satisfaction, is the satisfaction derived from
attributes that are intangible.
Characteristics of Customer satisfaction.
1. Loyal to a product, consumers are satisfied tend loyal
where they would buy again from the same manufacturer.
2. Communication by word of mouth that is positive,
communication by word of mouth (word of
mouth communication) are positive that recommendation
to prospective customers and say good things about the
product and company.
3. The company becomes a major consideration when buying
another brand when consumers want to buy another
product, then the company which has given him
satisfaction will be a major consideration.
Indicators of Customer satisfaction
1. Quality products, is that consumers will be satisfied if the
assessment showed that the quality of products that they
use.
2. Quality of care or services, is mainly for the service
4. International Journal of Advanced Scientific Research
31
industry, consumers will feel satisfied if they get good
service or as expected.
3. Emotion, consumers will feel proud and gain confidence
that other people would be amazed to him when using
products with certain brands that tend to have a higher
level of satisfaction. Satisfaction obtained not because of
the quality of the product but the social value that makes
consumers become satisfied with certain brands.
4. Price, a product that has the same quality but set a
relatively cheap price would give a higher value to their
customers.
5. Costs, consumers who do not need to spend additional
costs or do not need to waste time to get a product or
service tend to be satisfied with the product or service.
(Lupiyoadi, 2005: 158) [19]
.
Research Methods
Population and Sample
Population is a collection of individuals or research objects
that have characteristics or characteristics set (Cooper and
Emory, 2005) [5]
. Population used in this research is consumer
from PT. GO-JEK Indonesia, in East Jakarta area as many as
110 consumers. The sampling technique using accidental
sampling, namely: non-probability sampling technique in
which subjects have been selected for their convenient
accessibility and proximity to the researchers.
Method of Collecting Data
According to Nur and Bambang (2005) [13]
, secondary data is
research data obtained by researchers indirectly through
intermediary media (obtained and recorded by other
parties). Data obtained through relevant company data,
materials or literature and other literature related to the issues
discussed.
According to Nur and Bambang (2005) [13]
, primary data is the
source of data collected directly from the original source (not
through intermediate media). In this study, data collection
techniques using primary data. The field study through three
data collection techniques commonly used in the study of
primary data, namely:
Questionnaire is a data collection technique that is done by
giving a set of questions or written statement to the respondent
to be answered (Sugiyono, 2010: 199) [26]
. Researchers
distributed questionnaires to respondents is consumers of
PT.GO-JEK Indonesia. A closed question or statement. The
scale used in measuring is the scale of the answers given using
the four-scale scoring system (Likert). Researchers use a scale
of four scores because to dispel doubts so that respondents are
not confused in answering the questionnaire. To measure the
opinion is used four-digit scale of the answer is very agree
given a score of 4, the answer agreed given a score of 3, the
answer is less agree given score 2 and the answer is not agree
to score 1.
Test Instruments
a) Validity Test
Test Validity aims to check whether the contents of the
questionnaire is appropriate to measure what is wanted to be
measured and adequately understood by all respondents
indicated by the small percentage of respondents' answers that
are not too deviate from the answers of other
respondents. According Sugiyono (2008: 115), the validity
can be done by correlating between items score instrument in
a factor and correlate between factor scores with total score. If
the correlation of each factor is positive and the magnitude of
0.3 and above then the factor is a strong variable.
The basis for decision making is:
1. If r is a positive result, and the count r> r critical (0, 3),
then the variable is valid.
2. If r is a positive result, and the count r <r critical (0, 3),
then the variable is not valid.
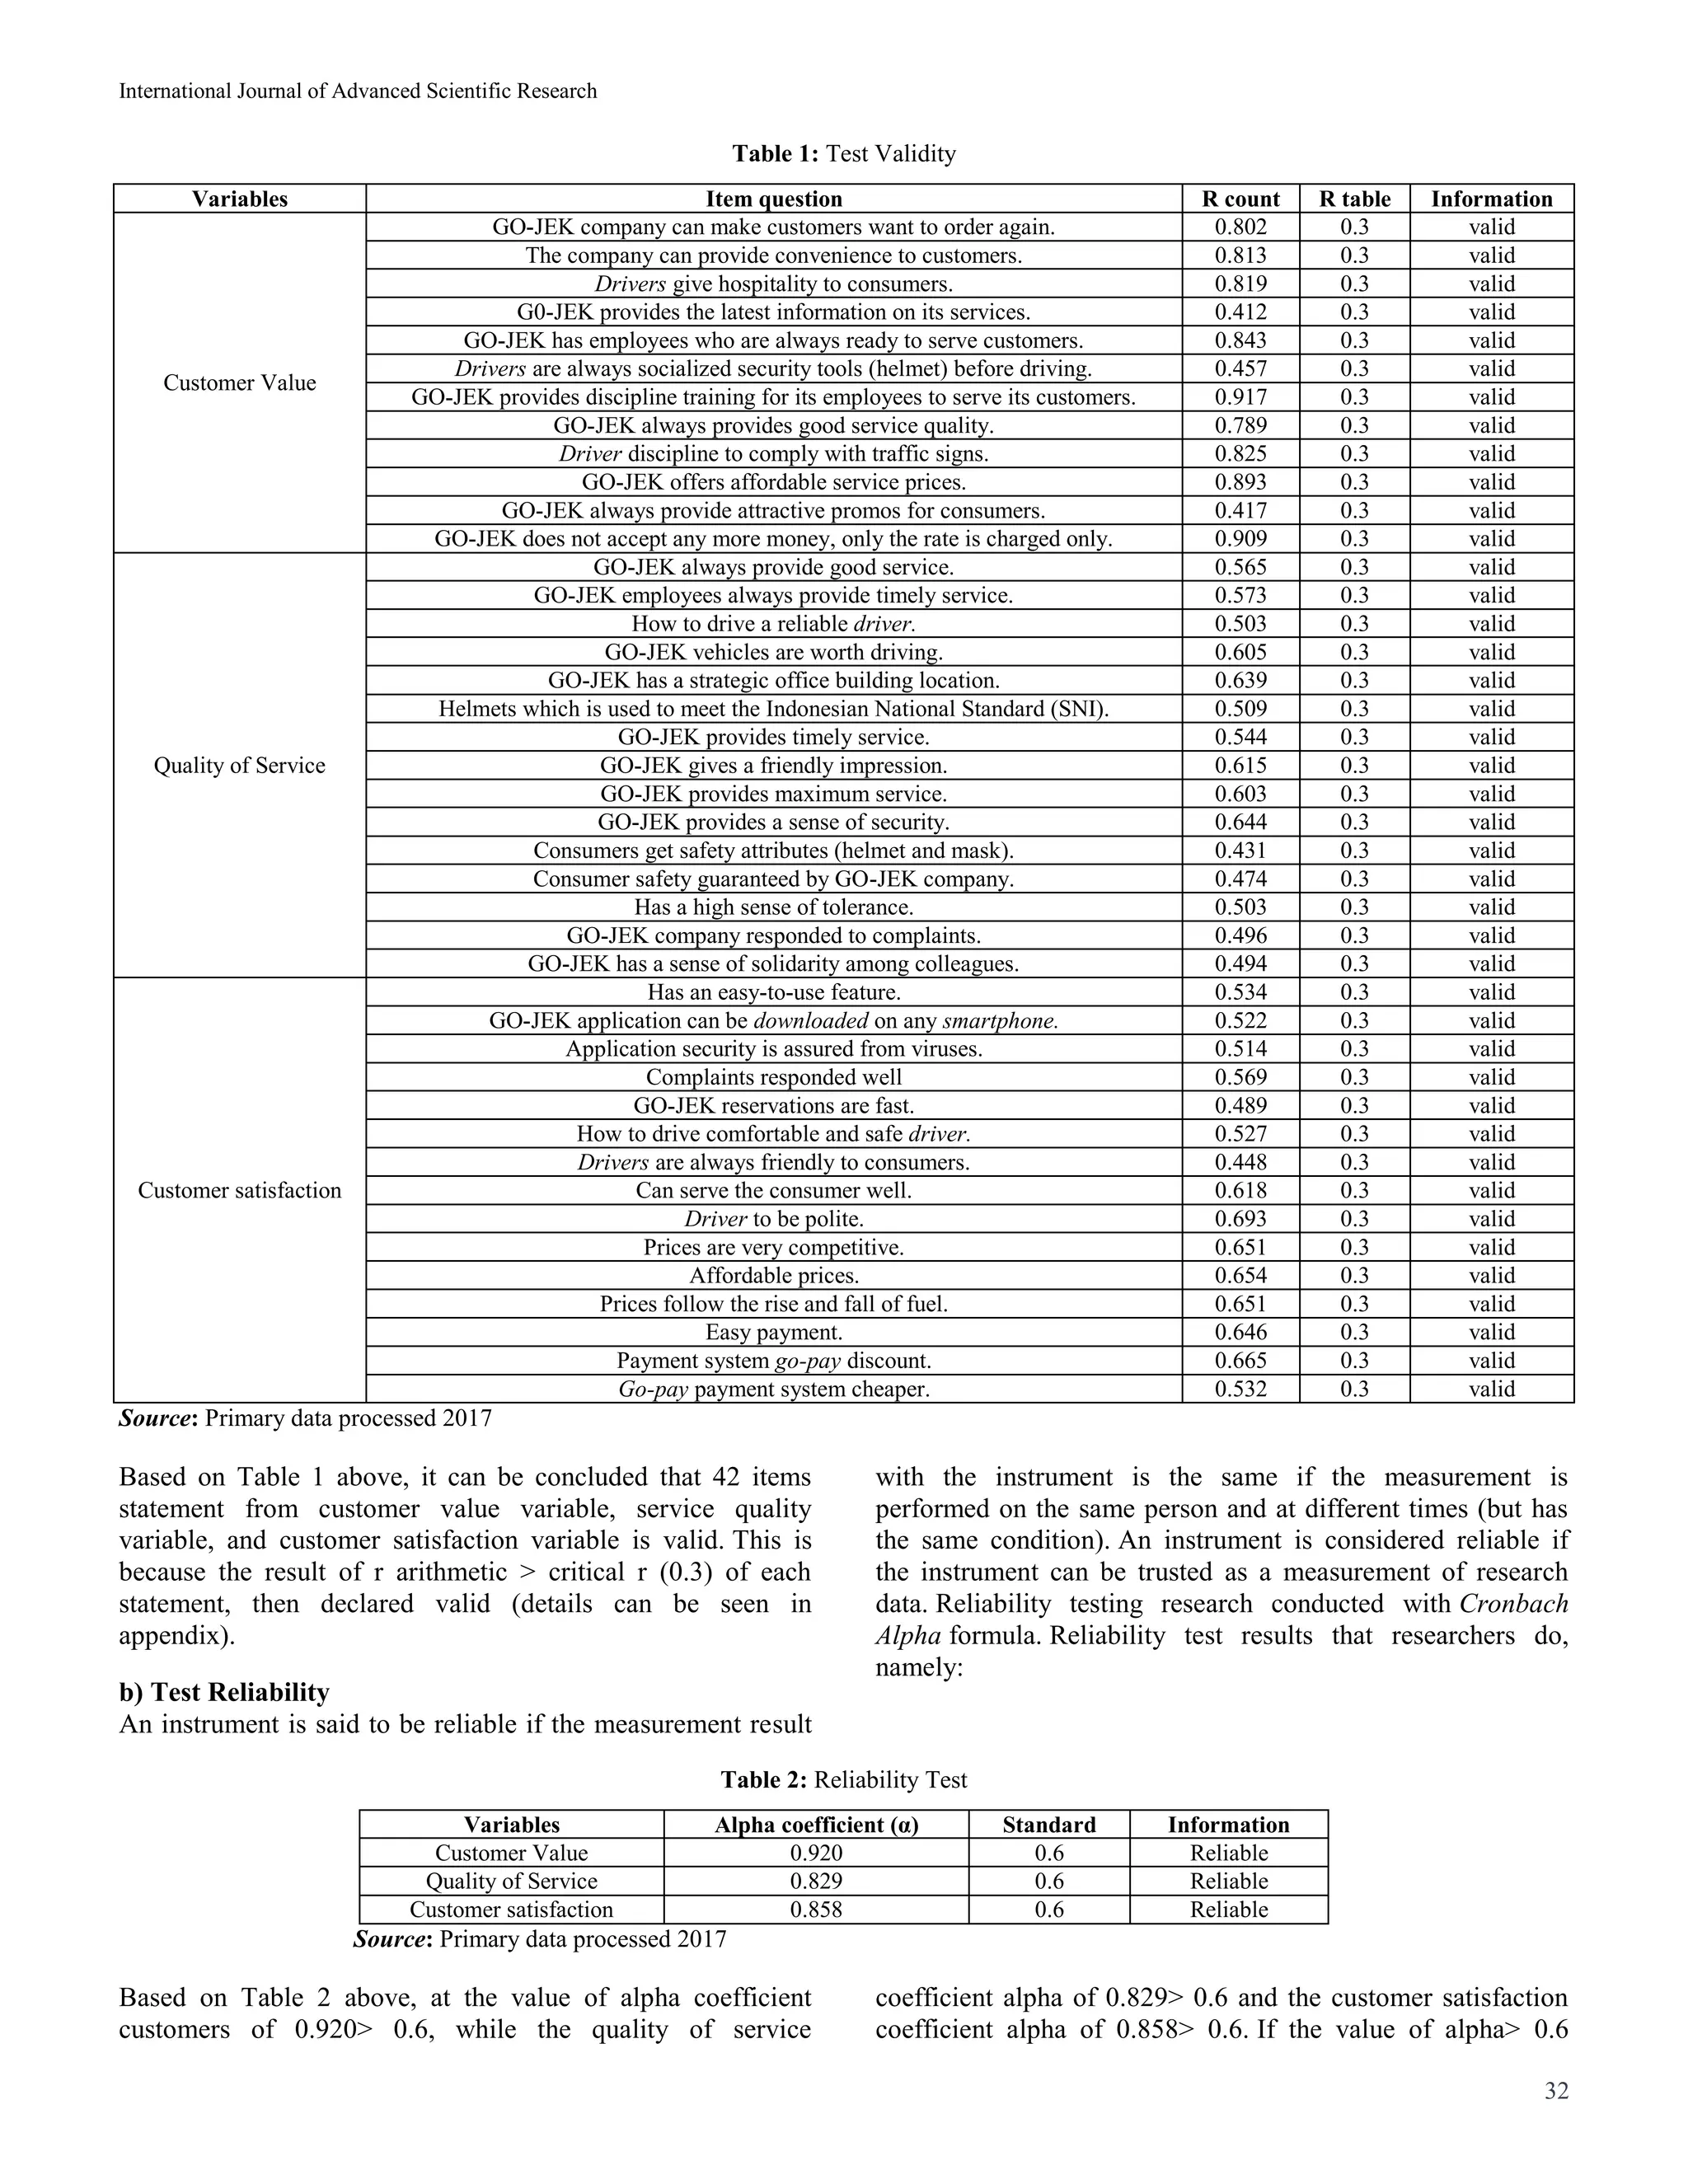
b) Test Reliability
According to Santoso (2002: 200) [24]
reliability refers to the
consistency and stability of the value of certain measurement
scale. Reliability concentrates on measurement accuracy
issues and results. This study uses a reliability test
with Cronbach Alpha coefficient (α). Reliability test using
Cronbach's Alpha method, an instrument is said to be reliable
if the alpha value greater than 0.6.
Santoso's decision making base (2004: 276) [25]
is:
1. If r is positive alpha and alpha r> 0, 6, then the variable
reliable.
2. If r is positive alpha and alpha r <0, 6, then the variable is
not reliable.
Data Analysis Technique
Analysis technique in this research by using multiple linear
regression to analyze existing data. Multiple linear regression
is used because it is capable to test a series of hypotheses that
have been formulated together where there is more than one
dependent variable that is interrelated and test the feasibility
of a model with research data. The ability to test this jointly
formulated hypothesis is very important in this study, since
the model in this study is a model of a relationship that
requires simultaneous testing. It is also expected to conclude
the feasibility of the research model proposed in this study. In
one study, the possibility of problems in regression analysis is
quite frequent in matching predictive models into a model
entered into a series of data.
Results and Discussion
i) Instrument Test Results
a) Validity test
Validity is the level of reliability and the measuring tool
used. Instrument said to be valid means showing the
measuring tool used to get the data is valid or can be used to
measure what should be measured (Sugiyono, 2008:
137). Thus, a valid instrument is an instrument that is really
appropriate to measure what to measure. The following test
results validity:
5. International Journal of Advanced Scientific Research
32
Table 1: Test Validity
Variables Item question R count R table Information
Customer Value
GO-JEK company can make customers want to order again. 0.802 0.3 valid
The company can provide convenience to customers. 0.813 0.3 valid
Drivers give hospitality to consumers. 0.819 0.3 valid
G0-JEK provides the latest information on its services. 0.412 0.3 valid
GO-JEK has employees who are always ready to serve customers. 0.843 0.3 valid
Drivers are always socialized security tools (helmet) before driving. 0.457 0.3 valid
GO-JEK provides discipline training for its employees to serve its customers. 0.917 0.3 valid
GO-JEK always provides good service quality. 0.789 0.3 valid
Driver discipline to comply with traffic signs. 0.825 0.3 valid
GO-JEK offers affordable service prices. 0.893 0.3 valid
GO-JEK always provide attractive promos for consumers. 0.417 0.3 valid
GO-JEK does not accept any more money, only the rate is charged only. 0.909 0.3 valid
Quality of Service
GO-JEK always provide good service. 0.565 0.3 valid
GO-JEK employees always provide timely service. 0.573 0.3 valid
How to drive a reliable driver. 0.503 0.3 valid
GO-JEK vehicles are worth driving. 0.605 0.3 valid
GO-JEK has a strategic office building location. 0.639 0.3 valid
Helmets which is used to meet the Indonesian National Standard (SNI). 0.509 0.3 valid
GO-JEK provides timely service. 0.544 0.3 valid
GO-JEK gives a friendly impression. 0.615 0.3 valid
GO-JEK provides maximum service. 0.603 0.3 valid
GO-JEK provides a sense of security. 0.644 0.3 valid
Consumers get safety attributes (helmet and mask). 0.431 0.3 valid
Consumer safety guaranteed by GO-JEK company. 0.474 0.3 valid
Has a high sense of tolerance. 0.503 0.3 valid
GO-JEK company responded to complaints. 0.496 0.3 valid
GO-JEK has a sense of solidarity among colleagues. 0.494 0.3 valid
Customer satisfaction
Has an easy-to-use feature. 0.534 0.3 valid
GO-JEK application can be downloaded on any smartphone. 0.522 0.3 valid
Application security is assured from viruses. 0.514 0.3 valid
Complaints responded well 0.569 0.3 valid
GO-JEK reservations are fast. 0.489 0.3 valid
How to drive comfortable and safe driver. 0.527 0.3 valid
Drivers are always friendly to consumers. 0.448 0.3 valid
Can serve the consumer well. 0.618 0.3 valid
Driver to be polite. 0.693 0.3 valid
Prices are very competitive. 0.651 0.3 valid
Affordable prices. 0.654 0.3 valid
Prices follow the rise and fall of fuel. 0.651 0.3 valid
Easy payment. 0.646 0.3 valid
Payment system go-pay discount. 0.665 0.3 valid
Go-pay payment system cheaper. 0.532 0.3 valid
Source: Primary data processed 2017
Based on Table 1 above, it can be concluded that 42 items
statement from customer value variable, service quality
variable, and customer satisfaction variable is valid. This is
because the result of r arithmetic > critical r (0.3) of each
statement, then declared valid (details can be seen in
appendix).
b) Test Reliability
An instrument is said to be reliable if the measurement result
with the instrument is the same if the measurement is
performed on the same person and at different times (but has
the same condition). An instrument is considered reliable if
the instrument can be trusted as a measurement of research
data. Reliability testing research conducted with Cronbach
Alpha formula. Reliability test results that researchers do,
namely:
Table 2: Reliability Test
Variables Alpha coefficient (α) Standard Information
Customer Value 0.920 0.6 Reliable
Quality of Service 0.829 0.6 Reliable
Customer satisfaction 0.858 0.6 Reliable
Source: Primary data processed 2017
Based on Table 2 above, at the value of alpha coefficient
customers of 0.920> 0.6, while the quality of service
coefficient alpha of 0.829> 0.6 and the customer satisfaction
coefficient alpha of 0.858> 0.6. If the value of alpha> 0.6
6. International Journal of Advanced Scientific Research
33
means sufficient reliability. Thus, it can be concluded that all
variables are reliable.
ii) Result Description Respondents
In the description of respondents researchers describe the
gender of respondents, age of respondents and the number of
respondents work, as follows:
a) Description of Respondents by Sex
The sexes used as respondents regarding consumer interest
using GO-JEK transport services are as follows:
Table 3: Sex of Respondents
No Gender F %
1 Man 36 42
2 women 50 58
amount 86 100
Source: Primary data processed 2017
Based on Table 3 above, the respondent's description of male
sex is 36 or 42%, while the respondent to female gender is 50
or 58%, of total amount 86 or 100%. So, on female
respondents who mostly use GO-JEK transportation services
as much as 50 or 58%.
b) Description of Respondents by Age
To know more clearly about the age of respondents who use
GO-JEK transportation services from the ages of 20-30, 31-
40, 41-50, and 51-60 can be seen in the following table:
Table 4: Respondents Age
No Age F %
1 21-30 Years 52 60
2 31-40 Years 12 14
3 41-50 Years 14 16
4 51-60 Years 8 10
amount 86 100
Source: Primary data processed 2017.
Based on Table 4 above age, users of GO-JEK aged 21-30
years were 52 or 60%, for ages 31-40 years of 12 or 14%,
while at age 41-50 years as many as 14 or 16%, and those last
at the age of 51-60 years has a frequency of 8 or 10%, with a
total of 86 or 100%. Thus, at the age of the respondents, it can
be concluded that GO-JEK users at 21-30 years of age
dominate by using GO-JEK transportation service with a
percentage of 52 or 60%.
c) Description of Respondents by Number of Jobs.
In this research there are several types of respondent's work
such as student, student, civil servant, private company
employee, entrepreneur, and others which can be seen in table
as follows:
Table 5: Number of Respondents Work
No Work F %
1 Student 7 8
2 College student 41 48
3 Civil servants 10 12
4 Employees of private companies 9 10
5 entrepreneur 15 17
6 Etc 4 5
amount 86 100
Source: Primary data processed 2017
Based on Table 5 the number of student respondents of GO-
JEK users is 7 or 8%, 41 or 48% of students, civil servants of
10 or 12%, while private sector employees of 9 or 10%,
entrepreneurs of 15 or 17%, and others of 4 or 5%. Thus, the
largest number of GO-JEK users are students who use more
dominant transportation services with a frequency of 41 or
48%.
iii) Results Description Variable Research
In Table researchers describe all representations of each
variable scale scoring system that uses four (Likert), namely:
a) Customer Value
Table 6: Description of Customer Value Variable
Item Statement
Assessment
Average
SS % S % KS % TS %
Value Emotional (Emotional Value). 3.12
GO-JEK company can make customers want to order again. 22 25% 57 66% 6 7% 1 1% 3.16
The company can provide convenience to customers. 22 25% 57 66% 6 7% 1 1% 3.16
Drivers give hospitality to consumers. 19 22% 55 64% 9 10% 3 3% 3.05
Social value (Social Value). 3.07
GO-JEK provides the latest information about its services. 21 24% 55 64% 7 8% 3 3% 3.09
GO-JEK has employees who are always ready to serve customers. 20 23% 54 63% 11 13% 1 1% 3.08
Drivers are always socialized security tools (helmet) before driving. 21 24% 54 63% 6 7% 5 6% 3.06
Quality / Performance Value (Quality / Performance Value). 3.08
GO-JEK provides discipline training for its employees to serve its customers. 21 24% 55 64% 9 10% 1 1% 3.12
GO-JEK always provide good service quality. 19 22% 57 66% 7 8% 3 3% 3.07
Driver discipline to comply with traffic signs. 19 22% 55 64% 9 10% 3 3% 3.05
Price / Value of Money (Price / Value of Money). 3.11
GO-JEK offers affordable service prices. 22 25% 54 63% 9 10% 1 1% 3.13
GO-JEK always provides an interesting promo for customers. 24 28% 50 58% 9 10% 3 3% 3.10
GO-JEK do not receive more money, only tariffs imposed only. 20 23% 57 66% 8 9% 1 1% 3.12
Customer value 3:09
Sources: Primary data is processed in 2017
7. International Journal of Advanced Scientific Research
34
1) Value Emotional (Emotional Value).
Emotional value is an indicator of customer value as measured
by the three point statement, the company GO-JEK can make
customers want to order more, the company can provide
convenience to customers and drivers providing hospitality to
customers. The average value of the emotional value of 3:12,
this suggests GO-JEK customers tend to strongly agree that
the emotional value form of customer value.
Item first statement saying the company GO-JEK can make
customers want to order more, of the 86 respondents who
stated strongly agree as many as 22 respondents or 25%, 57
respondents or 66% agree, 6 respondents or 7% expressed less
agreed, and 1 or 1% of respondents disagree. The average
value of 3:16 means customers GO-JEK states tend to strongly
agree that the company GO-JEK can make customers want to
order again.
Grain second statement stating that the company can provide
convenience to customers, from 86 respondents who stated
strongly agree as many as 22 respondents or 25%, 57
respondents or 66% agree, 6 respondents or 7% expressed less
agreed, and first responder or 1% disagree. The average value
of 3:16 means customers GO-JEK states tend to strongly agree
that the company can provide convenience to customers.
Grain third statement stating that the driver gives hospitality
to customers from 86 respondents who stated strongly agree as
many as 19 respondents or 12%, 55 respondents or 64% agree,
9 respondents or 10% said less agree, and 3 respondents or 3%
stated disagree. The average value of 3:05 means customers
GO-JEK states tend to strongly agree that the drivers give
hospitality to customers.
2) Social value (Social Value).
Emotional value is an indicator of customer value as measured
by the three point statement, the G0-JEK provide updated
information on His ministry, the GO-JEK has always alert
employees serve customers and drivers always socialized
security tools (helmet) before driving. The average value of
the social value of 3:07, this suggests GO-JEK customers tend
to strongly agree that social values form of customer value.
Item first statement stating that the G0-JEK provide updated
information on His ministry, of the 86 respondents who stated
strongly agree as many as 21 respondents or 24%, 55
respondents or 64% agree, 7 respondents or 8% expressed less
agreed, and 3 respondents or 3% disagree. The average value
of 3:09 means customers GO-JEK states tend to strongly agree
that the G0-JEK provide the latest information on His ministry
Grain second statement stating that the GO-JEK have
employees who are always swiftly serve customers, from 86
respondents who stated strongly agree as many as 20
respondents or 23%, 54 respondents or 63% agreed, 11
respondents or 13% said less agree, and 1 or 1% of
respondents disagree. The average value of 3:08 means
customers GO-JEK states tend to strongly agree that GO-JEK
has always alert employees serve customers.
Grain third statement stating that the driver always socialized
security tools (helmet) before driving, from 86 respondents
who stated strongly agree as many as 21 respondents or 24%,
54 respondents or 63% agree, 6 respondents or 7% expressed
less agreed, and 5 or 6% of respondents disagree. The average
value of 3:06 means customers GO-JEK states tend to strongly
agree that the driver always socialized security tools (helmet)
before driving.
3) Quality / Performance Value (Quality / Performance
Value).
Quality / performance value is an indicator of customer value
as measured by the three point statement, the GO-JEK provide
discipline training for its employees to serve customers. GO-
JEK quality always provide good service and driver discipline
to obey traffic signs. The average value of quality /
performance value of 3:08, this suggests GO-JEK customers
tend to strongly agree that the quality / performance value
form of customer value.
Item first statement stating that the GO-JEK provide training
discipline for employees to serve customers, from 86
respondents who stated strongly agree as many as 21
respondents or 24%, 55 respondents or 64% agree, 9
respondents or 10% said less agreed, and 1 respondent or 1%
disagree. The average value of 3:12 means customers GO-JEK
states tend to strongly agree that GO-JEK provide discipline
training for its employees to serve customers.
Grain second statement stating that the GO-JEK always
provide the quality of service is good, from 86 respondents
who stated strongly agree as many as 19 respondents or 22%,
57 respondents or 66% agree, 7 respondents or 8% expressed
less agreed, and 3 respondents or 3% disagree. The average
value of 3:07 means customers GO-JEK states tend to strongly
agree that GO-JEK always provide good quality services.
Grain third statement stating that the driver discipline in
obeying traffic signs, from 86 respondents who stated strongly
agree as many as 19 respondents or 22%, 55 respondents or
64% agree, 9 respondents or 10% said less agree, and 3
respondents or 3% disagree. The average value of 3:05 means
customers GO-JEK states tend to strongly agree
that driver discipline to comply with traffic signs.
4) Price / Value of Money (Price / Value of Money).
Price / value for money is an indicator of customer value as
measured by the three point statement, the GO-JEK offer
price, which is affordable, GO-JEK always provide promos
that interest customers and GO-JEK do not receive more
money, only tariffs imposed only. The average value of the
price / value of money amounting to 3.11, this indicates GO-
JEK customers tend to strongly agree that the price / value
form of customer value.
Item first statement stating that the GO-JEK offer price, which
is affordable, from 86 respondents who stated strongly agree
as many as 22 respondents or 25%, 54 respondents or 63%
agree, 9 respondents or 10% said less agree, and first
responder or 1% disagree. The average value of 3:13 means
customers GO-JEK states tend to strongly agree that GO-JEK
offer services that are affordable prices.
Grain second statement stating that the GO-JEK always
provide promos that interest customers, from 86 respondents
who stated strongly agree as many as 24 respondents or 28%,
50 respondents or 68% agree, 9 respondents or 10% said less
agree, and 3 or 3% of respondents disagree. The average value
of US $ 3.10 means customers GO-JEK states tend to strongly
agree that GO-JEK always provides an interesting promo for
customers.
8. International Journal of Advanced Scientific Research
35
Grain third statement stating that the GO-JEK do not receive
more money, only the rates charged, from 86 respondents who
stated strongly agree as many as 20 respondents or 23%, 57
respondents or 66% agree, 8 respondents or 9% said less agree
and 1 or 1% of respondents disagree. The average value of
3:12 means customers GO-JEK states tend to strongly agree
that GO-JEK do not receive more money, only tariffs imposed
only.
Based on the description above, the average value of the
variable customer value of 3:09, which means customers G0-
JEK agree that the customer value created by value indicators
of emotional (emotional value), social values (social value),
quality / performance value (quality / performance value), and
the price / value of money (price / value of money).
Based on the indicators and the biggest statement contained in
the emotional value indicators (emotional value), namely that
the GO-JEK enterprise customers can make customers want to
order again and the company can provide convenience to
customers.
b) Quality of Service
Table 7: Description of Variable Quality of Service
Item Statement
Appraisal
Average
SS % S % KS % TS %
Reliability (Reliability) 2.84
GO-JEK always provide good service. 16 19% 48 56% 17 20% 5 6% 2.87
GO-JEK employees always provide timely service. 19 22% 45 52% 17 20% 5 6% 2.91
How to drive the driver can rely on. 4 5% 59 69% 19 22% 4 5% 2.73
Physical Evidence (Tangibles) 2.81
GO-JEK decent vehicle to drive. 7 8% 61 71% 17 20% 1 1% 2.86
GO-JEK has the strategic location of the office building. 7 8% 59 69% 16 19% 4 5% 2.80
Helmets used meet the Indonesian National Standard (SNI). 5 6% 61 71% 16 19% 4 5% 2.78
Responsiveness (Responsiveness) 2.77
GO-JEK provide timely service. 7 8% 58 67% 17 20% 4 5% 2.79
GO-JEK give a friendly impression. 12 14% 51 59% 15 17% 8 9% 2.78
GO-JEK provide maximum service. 11 13% 50 58% 18 21% 7 8% 2.76
Assurance (Assurance) 2.81
GO-JEK give a sense of security. 12 14% 51 59% 15 17% 8 9% 2.78
Consumers get the attributes of safety (helmet and face mask). 13 15% 48 56% 21 24% 4 5% 2.81
Consumer safety is guaranteed by the company GO-JEK. 16 19% 46 53% 19 22% 5 6% 2.85
Empathy (Empathy) 2.84
Have a high tolerance. 13 15% 54 63% 12 14% 7 8% 2.85
GO-JEK company respond complaint. 13 15% 54 63% 12 14% 7 8% 2.85
GO-JEK have a sense of solidarity among co-workers. 13 15% 54 63% 11 13% 8 9% 2.84
Quality of Service 2.81
Sources: Primary data is processed in 2017.
1) Reliability (Reliability)
Reliability is an indicator of the quality of service is measured
through three point statement, the GO-JEK always provide
good service, GO-JEK employees always provide timely
service and how to drive the driver can rely on. The average
value of the reliability of 2.84, demonstrating the GO-JEK
customers tend to agree that the reliability of shaping the
quality of service.
Item first statement stating that the GO-JEK always provide
good service, from 86 respondents who stated strongly agree
as many as 16 respondents or 19%, 48 respondents or 56%
agreed, 17 respondents or 20% said less agree, and 5
respondents or 6% disagree. The average value of 2.87 means
that customers GO-JEK states tend to agree that GO-JEK
always provide good service.
Grain second statement that employees GO-JEK always
provide timely service, from 86 respondents who stated
strongly agree as many as 19 respondents or 22%, 45
respondents or 52% agreed, 17 respondents or 20% said less
agree, and 5 respondents or 6% disagree. The average value of
2.91 means that customers GO-JEK states tend to agree that
employees of GO-JEK always provide timely service.
Grain third statement stating that how to drive the driver can
be relied upon, from 86 respondents who stated strongly agree
as many as 4 respondents or 5%, 59 respondents or 69%
agreed, 19 respondents or 22% said less agree, and 4
respondents or 5% stated disagree. The average value of 2:37
means customers GO-JEK states tend to agree that the way to
drive the driver can rely on.
2) Physical Evidence (Tangibles).
Physical evidence is an indicator of the quality of service is
measured through three point statement, the GO-JEK decent
vehicle to drive, GO-JEK has the strategic location of the
office building and helmets used meet the Indonesian National
Standard (SNI). The average value of physical evidence at
2.81, demonstrating the GO-JEK customers tend to agree that
the physical evidence establish quality of service.
Item first statement stating that the vehicle GO-JEK decent to
drive, of the 86 respondents who stated strongly agree as
many as seven respondents or 8%, 61 respondents or 71%
agreed, 17 respondents or 20% said less agree, and first
responder or 1 % disagree. The average value of 2.86 means
that customers GO-JEK states tend to agree that the GO-JEK
decent vehicle to drive.
Grain second statement stating that the GO-JEK has locations
9. International Journal of Advanced Scientific Research
36
office buildings are located, from 86 respondents who stated
strongly agree as many as seven respondents or 8%, 59
respondents or 69% agreed, 16 respondents or 19% did not
agree, and 4 respondents or 5% disagree. The average value of
2.80 means that customers GO-JEK states tend to agree that
GO-JEK has the strategic location of the office building.
Grain third statement stating that the helmets used meet the
national standard of Indonesia (SNI), from 86 respondents
who stated strongly agree as many as five respondents, or 6%,
61 respondents or 71% agreed, 16 respondents or 19% did not
agree, and 4 or 5% of respondents disagree. The average value
of 2.78 means that customers GO-JEK states tend to agree that
the helmet used meet the Indonesian National Standard (SNI).
3) Responsiveness (Responsiveness)
Responsiveness is an indicator of the quality of service is
measured through three point statement, the GO-JEK provide
timely service, GO-JEK give the impression of a friendly
and GO-JEK provide maximum service. The average value of
the responsiveness of 2.77, demonstrating the GO-JEK
customers tend to agree that the responsiveness form the
quality of service.
Item first statement stating that the GO-JEK provide timely
service, from 86 respondents who stated strongly agree as
many as seven respondents or 8%, 58 respondents or 67%
agreed, 17 respondents or 20% said less agree, and 4
respondents or 5 % disagree. The average value of 2.79 means
that customers GO-JEK states tend to agree that GO-JEK
provide timely service.
Grain second statement stating that the GO-JEK give the
impression of friendly, of the 86 respondents who stated
strongly agree as many as 12 respondents or 14%, 51
respondents or 59% agreed, 15 respondents or 17% said less
agree, and 8 respondents or 9% disagree. The average value of
2.78 means that customers GO-JEK states tend to agree that
GO-JEK give a friendly impression.
Grain third statement stating that the GO-JEK provide
maximum services, from 86 respondents who stated strongly
agree as many as 11 respondents or 13%, 50 respondents or
58% agreed, 18 respondents or 21% said less agree, and 7
respondents or 8% disagree. The average value of 2.76 means
that customers GO-JEK states tend to agree that GO-JEK
provide maximum service.
4) Assurance (Assurance).
Assurance is an indicator of the quality of service is measured
through three point statement, the GO-JEK provide safety,
consumers get the attributes of safety (helmet and mask)
and consumer safety is guaranteed by the company GO-
JEK. The average value of the responsiveness of 2.81,
demonstrating the GO-JEK customers tend to agree that the
guarantee form the quality of service.
Item first statement stating that the GO-JEK give a sense of
security, of the 86 respondents who stated strongly agree as
many as 12 respondents or 14%, 51 respondents or 59%
agreed, 15 respondents or 17% said less agree, and 8
respondents or 9% disagree. The average value of 2.78 means
that customers GO-JEK states tend to agree that GO-JEK give
a sense of security.
Grain second statement stating that the consumer gets the
attributes of safety (helmet and mask), from 86 respondents
who stated strongly agree as many as 13 respondents or 15%,
48 respondents or 56% agreed, 21 respondents or 24% said
less agree, and 4 respondents or 5% disagree. The average
value of 2.81 means that customers GO-JEK states tend to
agree that the consumers get the attributes of safety (helmet
and face mask).
Grain third statement stating that consumer safety is
guaranteed by the company GO-JEK, from 86 respondents
who stated strongly agree as many as 16 respondents or 19%,
46 respondents or 53% agreed, 19 respondents or 22% said
less agree, and 5 respondents or 6% disagree. The average
value of 2.85 means that customers GO-JEK states tend to
agree that the safety of the consumer is guaranteed by the
company GO-JEK.
5) Empathy (Empathy).
Empathy is an indicator of the quality of service is measured
through three point statement, which has a high tolerance, the
company GO-JEK want to respond to complaints and GO-
JEK have a sense of solidarity among co-workers. The
average value of empathy 2.84, it indicates the GO-JEK
customers tend to agree that empathy shape the quality of
service.
Item first statement stating that tolerating a high of 86
respondents stated strongly agree as many as 13 respondents
or 15%, 54 respondents or 63% agreed, 12 respondents or
14% said less agree, and 7 respondents or 8% stated
disagree. The average value of 2.85 means that customers GO-
JEK states tend to agree that it has a high tolerance.
Grain second statement saying the company GO-JEK want to
respond to complaints, from 86 respondents who stated
strongly agree as many as 13 respondents or 15%, 54
respondents or 63% agreed, 12 respondents or 14% said less
agree, and 7 respondents or 8% disagree. The average value of
2.85 means that customers GO-JEK states tend to agree that
the company GO-JEK want to respond to complaints.
Grain third statement stating that the GO-JEK have a sense of
solidarity among co-workers, from 86 respondents who stated
strongly agree as many as 13 respondents or 15%, 54
respondents or 63% agreed, 11 respondents or 13% said less
agree, and 8 respondents or 9% disagree. The average value of
2.84 means that customers GO-JEK states tend to agree that
GO-JEK have a sense of solidarity among co-workers.
Based on the description above, the average value of the
variable quality of service amounted to 2.81, which means
customers G0-JEK tend to agree that the quality of service
established by the indicators of reliability (reliability),
physical evidence (tangibles), responsiveness (responsiveness)
assurance (assurance), and empathy (empathy).
Based on the indicators and statement of the largest found on
indicators of reliability (reliability ) and empathy (empathy),
which states that employees of GO-JEK always provide
timely service and have a sense of tolerance is high, and the
company GO-JEK want to respond to complaints and have a
sense of solidarity among colleagues work.
10. International Journal of Advanced Scientific Research
37
c) Customer satisfaction
Table 8: Variable Description Customer satisfaction
Item Statement
Appraisal
Average
SS % S % KS % TS %
Product quality. 3:05
Has features that are easy to use. 21 24% 51 59% 11 13% 3 3% 3:05
GO-JEK application can be downloaded on smartphones of any kind. 21 24% 49 57% 13 15% 3 3% 3.02
Application security is assured of a virus. 24 28% 46 53% 14 16% 2 2% 3:07
Quality of care or services. 2.82
Complaints addressed properly. 23 27% 44 51% 17 20% 2 2% 3.02
GO-JEK booking fast. 9 10% 48 56% 29 34% 0 0% 2.77
How to drive the driver comfortably and securely. 6 7% 51 59% 26 30% 3 3% 2.70
Emotions. 2.72
Drivers are always friendly to consumers. 8 9% 50 58% 28 33% 0 0% 2.77
Serve customers well. 7 8% 51 59% 27 31% 1 1% 2.74
Driver to be polite. 6 7% 47 55% 32 37% 1 1% 2.67
Price. 2.69
The prices are very competitive. 7 8% 45 52% 32 37% 2 2% 2.66
Affordable prices. 6 7% 46 53% 32 37% 2 2% 2.65
Prices followed the rise and fall of fuel. 10 12% 48 56% 26 30% 2 2% 2.77
Cost. 2.74
Easy payment. 9 10% 49 57% 26 30% 2 2% 2.76
Payment system go-pay discount. 10 12% 47 55% 27 31% 2 2% 2.76
Payment system go-pay cheaper. 8 9% 48 56% 27 31% 3 3% 2.71
Customer satisfaction 2.80
Sources: Primary data is processed in 2017
1) Product quality
The quality of products is an indicator of customer satisfaction
as measured by the three point statement, which has
convenient features, GO-JEK application can be downloaded
on smartphones of any kind and application security is assured
of a virus. The average value of the product quality 3:05, this
indicates GO-JEK customers tend to strongly agree that the
quality of the products shaping customer satisfaction.
Item first statement which states that has features that are easy
to use, out of 86 respondents stated strongly agree as many as
21 respondents or 24%, 51 respondents or 59% agreed, 11
respondents or 13% said less agree, and 3 respondents or 3%
stated disagree. The average value of 3:05 means customers
GO-JEK states tend to strongly agree that it has features that
are easy to use.
Grain second statement stating that the application GO-JEK
can be downloaded on smartphones any, of the 86 respondents
who stated strongly agree as many as 21 respondents or 24%,
49 respondents or 57% agreed, 13 respondents or 15% said
less agree, and 3 or 3% of respondents disagree. The average
value of 3:02 means customers GO-JEK states tend to strongly
agree that GO-JEK application can be downloaded on
smartphones of any kind.
Grain third statement stating that application security is
assured of a virus, of the 86 respondents who stated strongly
agree as many as 24 respondents or 28%, 46 respondents or
53% agreed, 14 respondents or 16% said less agree, and 2
respondents or 2% stated disagree. The average value of 3:07
means customers GO-JEK states tend to strongly agree that
safety is assured application of the virus.
2) Quality of Service or Services
Quality of care or service is an indicator of customer
satisfaction as measured by the three point statement, the
complaint addressed properly, GO-JEK booking quickly
and how to drive the drivers comfortable and safe. The
average value of the quality of service or service is 2.82, it
indicates the GO-JEK customers tend to agree that the quality
of service or service form customer satisfaction.
Item first statement stating that the complaint addressed
properly, from 86 respondents who stated strongly agree as
many as 23 respondents or 27%, 44 respondents or 51%
agreed, 17 respondents or 20% said less agree, and 2
respondents or 2% expressed agree. The average value of 3:02
means customers GO-JEK states tend to strongly agree that
the complaint addressed properly.
Grain second statement stating that the reservation GO-JEK
fast, from 86 respondents who stated strongly agree as many
as 9 respondents or 10%, 48 respondents or 56% agreed, 29
respondents or 34% said less agree, and 0 respondents or 0%
stated disagree. The average value of 2.77 means that
customers GO-JEK states tend to agree that GO-JEK booking
fast.
Grain third statement stating that how to drive the
driver comfortably and securely, from 86 respondents who
stated strongly agree as many as six respondents or 7%, 51
respondents or 59% agreed, 26 respondents or 30% said less
agree, and 3 respondents or 3% disagree. The average value of
2.70 means that customers GO-JEK states tend to agree that
the way of driving the driver comfortably and securely.
3) Emotions
Emotion is an indicator of customer satisfaction as measured
by the three point statement, the driver always friendly to
consumers, serve customers well and the drivers polite. The
average value of 2.72 emotions, this suggests respondents are
less likely to agree that emotions form of customer
satisfaction.
11. International Journal of Advanced Scientific Research
38
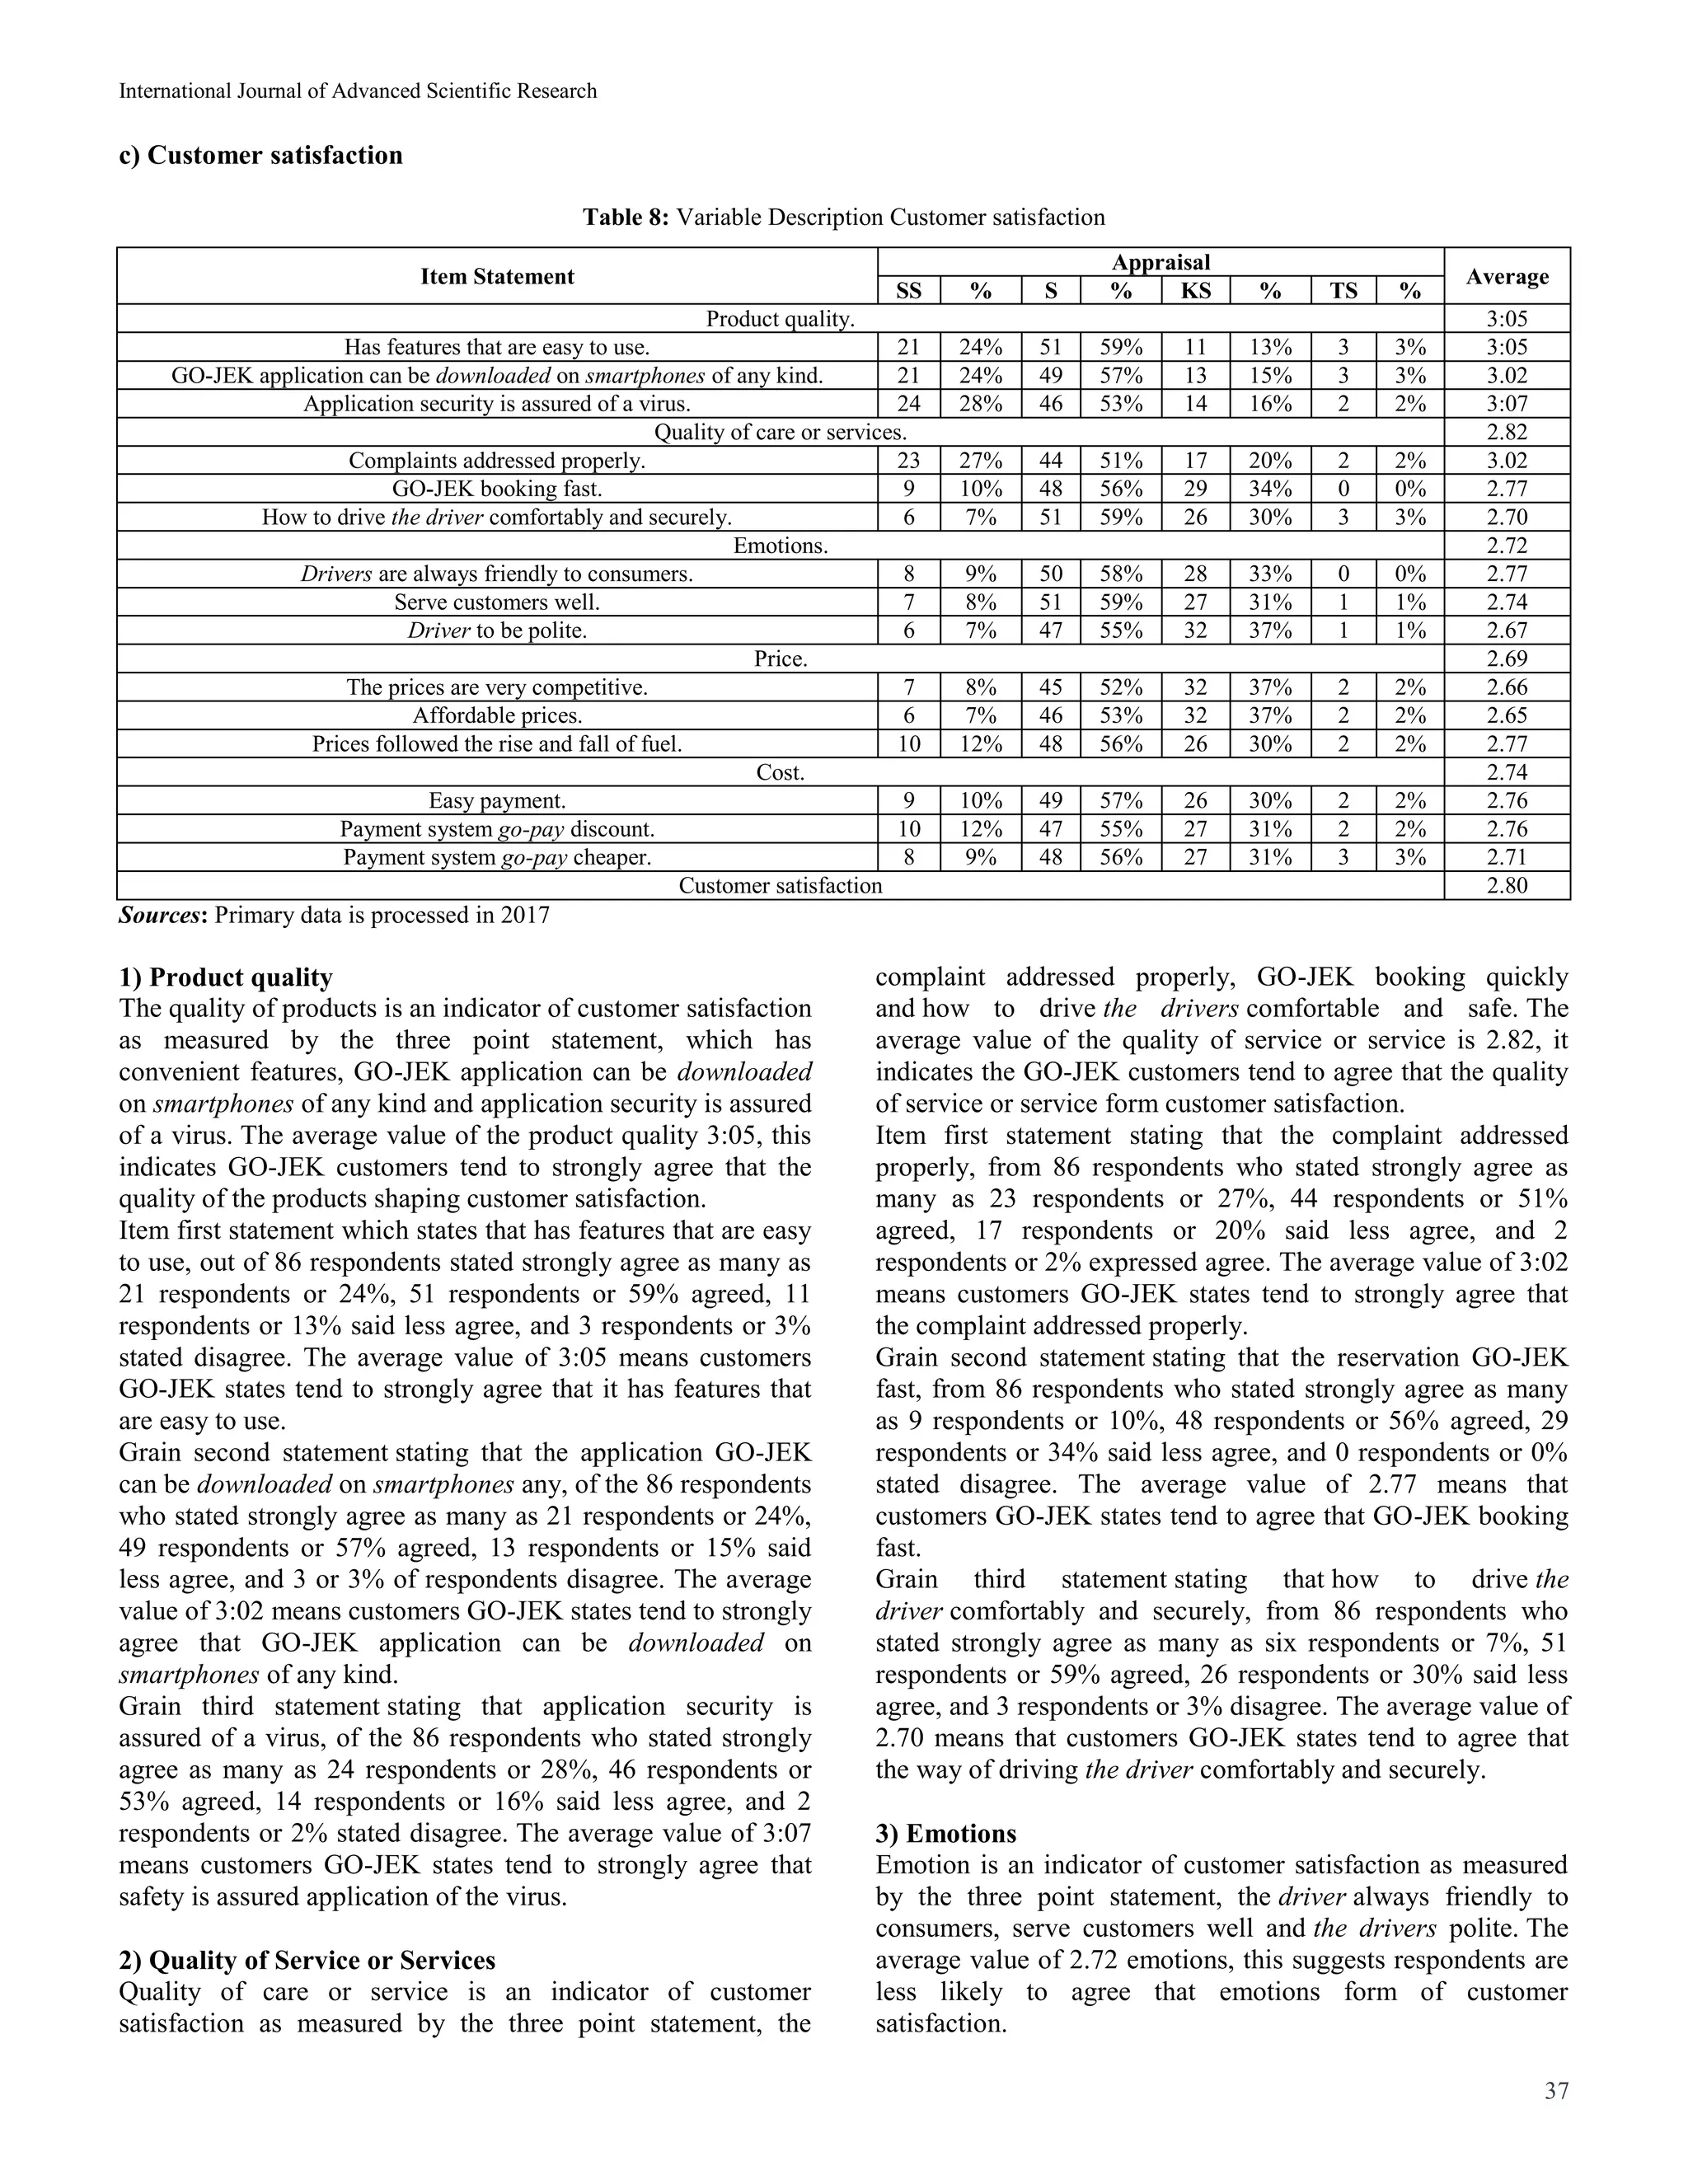
Item first statement stating that the driver is always friendly to
consumers, from 86 respondents who stated strongly agree as
many as 8 respondents or 9%, 50 respondents or 58% agreed,
28 respondents or 33% said less agree, and 0 respondents or
0% stated disagree. The average value of 2.77 means that
customers GO-JEK states tend to agree that the drivers are
always friendly to consumers.
Grain second statement which states that could serve
customers well, from 86 respondents who stated strongly
agree as many as seven respondents or 8%, 51 respondents or
59% agreed, 27 respondents or 31% said that less agree, and
first responder or 1% stated disagree. The average value of
2.74 means that customers GO-JEK states tend to agree that it
can serve customers well.
Grain third statement stating that the driver was polite, of 86
respondents stated strongly agree as many as six respondents
or 7%, 47 respondents or 55% agreed, 32 respondents or 37%
said less agree, and first responder or 1% did not agree, The
average value of 2.67 means that customers GO-JEK states
tend to agree that drivers behave.
4) Price
Price is an indicator of customer satisfaction as measured by
the three point statement, the price is very competitive,
affordable prices and the price follows the rise and fall of
fuel. The value of the average price of 2.69, suggesting
respondents are less likely to agree that the price is forming
customer satisfaction.
Item first statement stating that the price is very competitive,
from 86 respondents who stated strongly agree as many as
seven respondents or 8%, 45 respondents or 52% agreed, 32
respondents or 37% said less agree, and 2 respondents or 2%
disagree, The average value of 2.66 means that customers GO-
JEK states tend to agree that the price is very competitive.
Grain second statement stating that the price is affordable,
from 86 respondents who stated strongly agree as many as six
respondents or 7%, 46 respondents or 53% agreed, 32
respondents or 37% said less agree, and 2 respondents or 2%
disagree. The average value of 2.65 means that customers GO-
JEK states tend to agree that the price is affordable.
Grain third statement stating that the price follows the rise and
fall of fuel, of 86 respondents stated strongly agree as many as
10 respondents or 12%, 48 respondents or 56% agreed, 26
respondents or 30% said less agree, and 2 respondents or 2%
disagree. The average value of 2.77 means that customers GO-
JEK states tend to agree that the price follows the rise and fall
of fuel.
5) Cost
Cost is another indicator of customer satisfaction as measured
by the three point statement, the easy payment, payment
system go-pay many discount and payment system go-
pay cheaper. The value of the average cost of 2.74, suggesting
respondents are less likely to agree that the cost form of
customer satisfaction.
Item first statement which states that the payment is easy, of
86 respondents stated strongly agree as many as 9 respondents
or 10%, 49 respondents or 57% agreed, 26 respondents or
30% said less agree, and 2 respondents or 2% disagree. The
average value of 2.76 means that customers GO-JEK states
tend to agree that the payment easier.
Grain second statement stating that the payment system is a
go-pay a lot of discounts, from 86 respondents who stated
strongly agree as many as 10 respondents or 12%, 47
respondents or 55% agreed, 27 respondents or 31% said that
less agree, and 2 respondents or 2 % disagree. The average
value of 2.76 means that customers GO-JEK states tend to
agree that the payment system is a go-pay discount.
Grain third statement stating that the payment system is a go-
pay less, of the 86 respondents who stated strongly agree as
many as 8 respondents or 9%, 48 respondents or 56% agreed,
27 respondents or 31% said that less agree, and 3 respondents
or 3 % disagree. The average value of 2.71 means that
customers GO-JEK states tend to agree that the payment
system is a go-pay cheaper.
Based on the indicators and the biggest statement contained in
the customer satisfaction indicators of 2.80 means G0-JEK
customers tend to agree that customer satisfaction is formed
by an indicator of product quality, service quality or service,
emotion, pricing, and fees. Based on the indicators and the
biggest statement contained in the product quality indicators
of 3:07 means that consumers are likely to strongly agree that
safety is assured application of the virus.
Conclusions and Recommendations
Basically, the better the customer value and service quality,
the better the customer satisfaction achieved at the company
PT.GO-JEK. This finding is consistent with previous
theoretical views of researchers about the factors that affect
customer satisfaction, where variable customer value and
service quality significantly influence customer satisfaction.
The results also support previous findings that do Karadeniz
and Gözüyukri (2016) [14]
, Ikasari, Suryoko and Nurseto
(2013) [12]
, and Suryatiningsih (2013) [28]
.
This finding is consistent with previous theoretical views of
researchers who claim that customers value a significant effect
on customer satisfaction. The results also support previous
findings that do Karadeniz and Gözüyukri (2016) [14]
, Ikasari,
Suryoko and Nurseto (2013) [12]
, and Suryatiningsih (2013) [28]
.
This finding is also consistent with theoretical views of
researchers terdahlu stating that the quality of service
significantly influence customer satisfaction. The results also
support previous findings that do Karadeniz and Gözüyukri
(2016) [14]
, Ikasari, Suryoko and Nurseto (2013) [12]
, and
Suryatiningsih (2013) [28]
.
In connection with the research that has been done, then the
advice that can be given is as follows:
1. For researchers: Further research is needed on the factors
that affect customer satisfaction in order to more
accurately in addition to variable customer value and
quality of service. This study is necessary to explore other
factors that can affect to the improvement of customer
satisfaction as a factor of service, comfort, safety and other
factors.
2. For Readers: As a reference for the reader, the guideline
for comparison in the same study as well as add insight to
the reader.
3. For the Company: The results of this study can be used
as consideration for the company GO-JEK in an effort to
increase customer value and service quality on customer
12. International Journal of Advanced Scientific Research
39
satisfaction and thus creating a performance in line with
expectations of companies and consumers.
The social value gives ratings lowest in customer value, to
improve the assessment on social values is expected that the
GO-JEK provide updated information on His ministry,
furthermore expected that the GO-JEK have employees who
are always swiftly serve customers and the
expected driver always socialized security tools (helmet)
before drive.
Responsiveness give the lowest ratings on the quality of
service, to improve the assessment of responsiveness is
expected that the GO-JEK provide timely service, furthermore
expected that the GO-JEK give the impression of a friendly
and GO-JEK expected to provide maximum service.
Price gives the lowest ratings on customer satisfaction, to
improve the assessment on the expected price that is very
competitive prices, furthermore expected that affordable
prices and are expected to follow the rise and fall of the price
of fuel.
References
1. Agus Widarjono. Ekonometrika: Pengantar dan
aplikasinya, Ekonosia, Jakarta, 2013.
2. Anderson Eugene W, Claes Fornell, dan Donald R.
Lehmann Customer Satisfaction, Market Share, and
Profitabiliy: Finding from Sweden”, Journal of Marketing.
2006; 58:53-66.
3. Cannon Joseph P, William D. Perreault Jr. dan Jerome
McCarthy. Alih Bahasa: Diana Angelica dan Ria Cahyani.
Pemasaran Dasar-Dasar: Pendekatan Manajerial Global.
Buku 2. Edisi 16. Salemba Empat. Jakarta, 2008.
4. Consuelo G, Sevilla dkk. Pengantar Metode Penelitian.
Jakarta: UI-Press, 2013.
5. Cooper Donald R, dan William Emory C. Metode
Penelitian Bisnis. Alih Bahasa: Widyono Soetjipto dan
Uka Wikarya. Jilid 2. Edisi Kelima. Jakarta: Erlangga,
2004.
6. Fitzsimmons JA. dan Fitzsimmons MJ. Service
Management for Competitive Advantage, McGraw-Hill,
Inc: New York, 2006.
7. Gaffar Vanessa. CRM dan MPR Hotel. Bandung:
Alfabeta, 2007.
8. Gale BT, Wood RC. Managing Customer Value: Creating
Quality and Service that Customer Can See. New York:
The Free Press, 2006.
9. Gay LR, dan Diehl PL. Research Methods for Business
and. Management. MacMillan Publishing Company: New
York, 2006.
10. Ghozali Imam. Aplikasi Analisis Multivariate dengan
Program SPSS. Badan Penerbit Universitas Diponegoro:
Semarang, 2007.
11. Griffin Jill. Customer Loyalty: Menumbuhkan dan
Mempertahankan Kesetiaan Pelanggan. Jakarta: Penerbit
Erlangga, 2013.
12. Ikasari Suryoko dan Nurseto. Pengaruh Nilai Pelanggan
Dan Kualitas Pelayanan Terhadap Kepuasan Pelanggan,
Studi Kasus Pada Penumpang Ka Kaligung Mas Di
Stasiun Poncol Semarang, 2013.
13. Indriantoro Nur, Bambang Supomo. Metodologi Penelitian
Bisnis untuk Akuntansi dan Manajemen, Edisi Pertama.
Yogyakarta: BPFE Yogyakarta, 2005.
14. Karadeniz dan Gözüyukri. The Effect of Perceived Service
Quality in Banking Sector on Customer Satisfaction, 2016.
15. Kotler Philip, Amstrong Gary. Prinsip-prinsip Pemasaran
(Principles of Marketing), Edisi Bahasa Indonesia, Jilid I.
Jakarta: Penerbit Erlangga, 2001.
16. Kotler Philip. Manajemen Pemasaran. PT. Indeks
kelompok Gramedia: Jakarta, 2005.
17. Kotler Philip. Manajemen Pemasaran, Edisi Millenium,
Benyamin Molan (Terjemahan), Prehalindo, Jakarta, 2008.
18. Kotler Philip, dan Keller K. Manajemen Pemasaran. Edisi
Ke 12. PT Indeks: Jakarta, 2009.
19. Lupiyoadi Rambat. Manajemen Pemasaran Jasa: Teori
dan Praktik. PT. Salemba Emban Patria: Jakarta, 2005.
20. Parasuraman A, et al. Serviqual: A Multiple-Item Scale for
Measuring Consumer Perception of Service Quality.
Journal of Retailing. 2001; 64:12-40.
21. Priyatno Duwi. Teknik Mudah Dan Cepat Melakukan
Analisis Data Penelitian Dengan SPSS, Yogyakarta: Gava
Media, 2010.
22. Purnama Nursya’bani. Manajemen Kualitas: Perspektif
Global. Ekonisia: Yogyakarta, 2006.
23. Robinette Scott, dan Claire Brand. Emotional Marketing:
The Hall Mark Way of Winning Customers for Life. New
York, MC Graw Hill International, 2001.
24. Santoso S. Buku Latihan SPSS Statistik Parametrik.
Jakarta: PT Elex Media Komputindo, 2002.
25. Santoso S. Statistik Deskriptif. Yogyakarta: Andi, 2004.
26. Sugiyono. Metodologi Penelitian Bisnis. Cetakan Kelima
Belas. Alfabeta: Bandung, 2010.
27. Sukmawati Kartika. Pengaruh Kualitas Layanan, Harga
dan Kepuasan Pelanggan Terhadap Loyalitas Pelanggan
Jasa Transportasi Kereta Api Eksekutif”, Jurnal
Manajemen FE, Universitas Gunadharma, 2011.
28. Suryatiningsih. Analisis Pengaruh Kualitas Pelayanan Dan
Niilai Pelanggan Terhadap Kepuasan Nasabah (Studi
Kasus Pada Bank Sumsel Babel, 2013.
29. Sweeney, Julian C. Custumer Perceived Value: The
Development of A Multiple Item Scale. Journal of
Retailing, 2005.
30. Tjiptono Fandy. Strategi Pemasaran. Edisi Ketiga. Andi:
Yogyakarta, 2008.
31. Tjiptono Fandy. Pemasaran Jasa. Bayumedia: Malang,
2007.
32. Vanessa Gaffar. Manajemen Bisnis. Alfabeta: Bandung,
2007.
33. Westbrook RA, Reilly MD. Value-value disparity: An
alternative to the disconfirmation of expectations theory of
customer satisfaction”, In Bagozzi, R.P. and A.M. Tybout
(eds), Advances in Cunsumer Research 10. Ann Arbour,
M1: Association for Consumer Research. 2006, 84-91.
34. Zeithaml VA, Bitner MJ. Service Marketing, Integrating
Customer Focus Across the Firm, International Edition,
Second Edition, McGraw-Hill Higher Education, USA,
2008.