Prof. Dr. Hapzi Ali, CMA
Universitas Mercu Buana (Mercu Buana University), Jakarta Indonesia
Bidang Ilmu: Marketing & Business Management, Research Method, MIS, Good Corporate Governance
www.mercubuana.ac.id.
email: hapzi.ali@gmail.com, hapzi.ali@mercubuana.ac.id
7. hapzi ali, et al., 2016, mercu buana univversity,ijer scopusHapzi Ali
Prof. Dr. Hapzi Ali, CMA
Universitas Mercu Buana (Mercu Buana University), Jakarta Indonesia
Bidang Ilmu: Marketing & Business Management, Research Method, MIS, Good Corporate Governance
www.mercubuana.ac.id.
email: hapzi.ali@gmail.com, hapzi.ali@mercubuana.ac.id
factors affecting to willingness to wait in Queues in Sri lankan supermarketskdore
Customer satisfaction is the measure of how the needs and responses are collaborated and delivered to excel customer expectation
Research Problem
How do the factors affecting to the waiting time of the customers in queues influence the customer satisfaction in Sri Lankan Retail Supermarket Industry?
Research Objectives
To Identify the real factors affecting to the waiting time of the customers in the queues in Sri Lankan Retail Supermarkets and how those factors effect to customers’ willingness to stay in the queues.
Influence of Location and Quality of Service on Customer Satisfaction at PT. ...ijtsrd
This study aims to determine “The effect of location and service quality on customer satisfaction at PT. Transmart Carrefour Plaza Medan Fairâ€. This type of research uses explanatory research explanatory research . The population in this study are customers who come and shop at PT. Transmart Carrefour Plaza Medan Fair. The number of research samples used in this study was 60 people, the sampling technique used in this study was simple random sampling. Collecting data using a questionnaire with a Likert scale which has five alternative answers and distributed to respondents.The results of this study indicate that the location has a positive and significant effect on customer satisfaction because the t value is 4.269 t table 1.672 and a significant value is 0.000 0.05. significant 0.000 0.05. Location and service quality together have a positive and significant effect on customer satisfaction with a calculated F value of 20.619 F table 3.16 and a significant value of 0.000 0.05. From the results of the analysis, the adjusted R Square value of 0.399 means that the location and quality of service can simultaneously contribute as much as 39.9 while the remaining 60.1 is a variable not observed in this study. Nurlelawati Manurung | HD. Melva Sitanggang | Lasman Eddy Bachtiar "Influence of Location and Quality of Service on Customer Satisfaction at PT. Transmart Carrefour Plaza Medan Fair" Published in International Journal of Trend in Scientific Research and Development (ijtsrd), ISSN: 2456-6470, Volume-5 | Issue-6 , October 2021, URL: https://www.ijtsrd.com/papers/ijtsrd46412.pdf Paper URL : https://www.ijtsrd.com/management/consumer-behaviour/46412/influence-of-location-and-quality-of-service-on-customer-satisfaction-at-pt-transmart-carrefour-plaza-medan-fair/nurlelawati-manurung
Effect of Quality of Service and Location on Satisfaction Customer at Pt. Per...YogeshIJTSRD
This study uses qualitative research methods that contain numbers. The population in this study is all customers who shop at PT. Pertamina Retail Bright Store HM. Yamin Medan. Sampling using a kusioner spread with a likert scale that has 5 alternative answers. And analyzed using multiple linear regressions and coefficients of R2 determination with SPSS software for windows version 16. The results showed the following 1 Service Quality has a positive and significant effect on Customer Satisfaction at PT. Pertamina Retail Bright Store HM. Yamin Medan, 2 Location has a positive effect, but not significant to Customer Satisfaction at PT. Pertamina Retail Bright Store HM. Yamin Medan, 3 There is a positive and significant influence between the quality of service and location on customer satisfaction at PT. Pertamina Retail Bright Store HM. Yamin Medan with coefficient of coefficient of collation R of 0.393 and coefficient of determination R2 of 0.155 this means that 15.5 of customer satisfaction is in PT. Pertamina Retail Bright Store HM. Yamin Medan, influenced by the quality of service and location, while the other 84.5 is determined by other variables not described in this study. Kepler Sianturi | Rezkiyana | Riomas Sinurat "Effect of Quality of Service and Location on Satisfaction Customer at Pt. Pertamina Retail Bright Store Hm. Yamin Medan" Published in International Journal of Trend in Scientific Research and Development (ijtsrd), ISSN: 2456-6470, Volume-5 | Issue-4 , June 2021, URL: https://www.ijtsrd.compapers/ijtsrd41240.pdf Paper URL: https://www.ijtsrd.comother-scientific-research-area/other/41240/effect-of-quality-of-service-and-location-on-satisfaction-customer-at-pt-pertamina-retail-bright-store-hm-yamin-medan/kepler-sianturi
Effect of customer value and quality of service on customer satisfaction (cas...Iwan Kurniawan Subagja
The need for transportation services increases due to the heavy traffic in Jakarta. Efficient transport services to congestion in
Jakarta, motorcycle taxi services online such as GO-JEK. This triggers every transportation company to increase customer value
and good service quality to get customer satisfaction in the field of transportation services.
This study aims to describe customer value and service quality to customer satisfaction with descriptive statistic analysis. The
study was conducted to 110 GO-JEK consumers in Jakarta. The sampling technique used was accidental sampling with analysis
tools SPPS 22.
The results show that customer value and service quality give impact to GO-JEK customer satisfaction in Jakarta.
Customers’ Satisfaction on Agro-Chemical Products: An Evaluation with Referen...Mohammed Al-Amin
This study sought to determine customer satisfaction in the pesticide industry in Bangladesh with a focus on agro dealers in Kushtia, Jashore & Natore territory. It was guided by the following research objectives: to determine the level of customer satisfaction in the pesticide of Auto Crop Care Ltd (ACCL); and, to identify factors that contribute to customer satisfaction in the pesticide products of ACCL, The study used the descriptive survey design. The target of study consisted of all 50 registered agro dealers in Kushtia, Jashore & Natore areas
Service quality and customer satisfaction related to Insurance industrykdore
Early researchers focused mostly on Banking, healthcare, retail, education etc
What is the existing situation of Service Quality in Sri Lankan Life Insurance Industry?
Does Service Quality affect on Customer Satisfaction in Life Insurance Industry?
What are the most important Services Quality dimensions which affect on Customer Satisfaction in Life Insurance Industry?
The Effect of Service Quality on Loyalty using Satisfaction as an Intervening...IJAEMSJORNAL
This research aims to discover and analyse the effect of service quality on loyalty of entrepreneurs in Bonded Zone using entrepreneurs’ satisfaction as the intervening variable. Research population is Bonded Stockpile Entrepreneurs in the Operational Area of Supervision and the Office of Customs and Excise Type Madya A Bekasi, particularly entrepreneurs in Bonded Zone. According to Slovin's formula, the number of respondents is 70. Data analysis is conducted using path analysis. Result of the research indicates that all proposed hypotheses are accepted and proven true.
FACTORS AFFECTING THE SERVICES QUALITY AND REPURCHASE INTENTIONIAEME Publication
This study aim is to examine the factors effecting the consumer satisfaction and
repurchase intention. The population is consumer from all 22 branches of One Mart
mini market in Bengkulu Province. Samples are 200 respondents. Data were collected
using a five-point Likert scale. The data analysis tool used is Structural Equation
Model (SEM) using AMOS 22 software. The research shows the following results.
First, service quality does not affect on customer satisfaction. Second, good service
quality affects on customer value. Third, good customer value affect on customer
satisfaction. Fourth, customer satisfaction does not affect on repurchase intention.
Fifth, good customer satisfaction affects on brand choices. Sixth, a good brand choice
affect on consumer repurchase.
A study on service quality assessment in state bank of travancoreBella Meraki
This research is an empirical assessment of service quality in State Bank of Travancore. Service Quality is the degree of excellence in the service performance. It is the degree and direction of discrepancy of service quality. The difference between the service expectations and service perceptions of customers is what is termed as service quality gap.
The study has been aimed at diagnosing the quality of service rendered by identifying the service quality gap in the regional branch of State Bank of Travancore in Thiruvananthapuram district and making necessary suggestions.
The data for the study has been collected on the basis of simple random sampling method through a questionnaire prepared for the purpose of being filled in at interviews with customers. The data collected has been classified on the basis of age, gender, occupation, annual income and educational background for the purpose of analysis. The data collected was tabulated with care and thereafter analyzed suitably. The analysis has been done on the basis of STATISTICAL & RANK CORRELATION instrument. The basic assumption of it is that the customers evaluate a firm’s service quality by comparing their five perceptions and expectations. The scaling in SERVICE QUALITY is based on the five dimensions of service quality namely tangibility, reliability, responsiveness, assurance and empathy.
The results of this study also offer support for the intuitive notion that improving service quality can increase the competitiveness of the organization. The report has been presented on the basis of the analysis made and suitable suggestion have been recommended.
Marketing Mix and Service Quality Effect on Customer Satisfaction and Loyalty...QUESTJOURNAL
ABSTRACT: This study aims to test and empirical analysis the marketing mix and service quality effect on customer satisfaction and customer loyalty, research was conducted in 26 branches in Sulawesi a population of about 16 212 customers of PT. HadjiKalla in Sulawesi who purchase Toyota cars for 2015 with a sample of 390 customers. The results of the analysis of structural equation modelusing AMOS version 20 provide evidence that marketing mix has a positive and significant effect on customer satisfaction and customer loyalty. Service quality is positive and significant effect on customer satisfaction, but insignificant effect on customer loyalty. Customer satisfaction has a positive and significant effect on customer loyalty. Marketing mix and service quality has a significant on customer loyalty as a mediated customer satisfaction. The practical implication of this study provide increased knowledge and understanding of the customer and the company's management in Sulawesi in increasing customer loyalty through marketing mix, service quality and customer satisfaction. Limitations of this study on a sample size using only the customers car brands Toyota and just carried on Sulawesi area that may limit generalizability of the research findings. Originality of this study provide the basis for the development configuration modeling using structural equation model and conceptual models that prove marketing mix and service quality on customer loyalty as a mediated customer satisfaction in previous research done separately. The mediating role of customer satisfaction is proven to increase customer loyalty to the highway.
The purpose of this study is to find out how service quality, brand image, and product quality
affect customer loyalty through customer satisfaction. This study is a census-based study, the object of research
used in this study were 100 respondents
Effect Of Quality Services On Customer Satisfaction And Loyalty (Theoritical...inventionjournals
International Journal of Business and Management Invention (IJBMI) is an international journal intended for professionals and researchers in all fields of Business and Management. IJBMI publishes research articles and reviews within the whole field Business and Management, new teaching methods, assessment, validation and the impact of new technologies and it will continue to provide information on the latest trends and developments in this ever-expanding subject. The publications of papers are selected through double peer reviewed to ensure originality, relevance, and readability. The articles published in our journal can be accessed online.
Build Customer Loyalty with CRM and Brand Image (Case Study on Giant Citra Raya)IOSRJBM
Giant Customer Citra Raya Tangerang over the last five years (2011-2015), had a significant decrease. The decrease is due to customers by many factors including the quality of kerelasian with customers (CRM) is not good and the products or services on offer does not corresponds to the expectations of customers, so the Brand Image decreased. The sampling method non-probability sampling (samples are not random). The sampling technique accidental sampling (how unintentional), where researchers have the freedom to choose who sampled according to the requirements of the existing population. The research method is a survey method. Customers population average of 2,070,823 / 12/30 = 5752 per day, with a sample of 152 respondents Slovin method. Method of quantitative analysis by means of multiple linear regression analysis followed by analysis test of determination (R Square), testing the hypothesis partially (t test) and simultaneous (test F) the error tolerance level of 5 percent. The results of the research that CRM and Brand Image positive and significant impact on the Customer Loyalty, either partially or simultaneously. Cusomer Loyalty can be built with CRM and brand image, the better CRM and Brand Image in perceived by customers the more loyal customers at Giant Citra Raya. CRM and Brand Image can explain Customer Loyalty at 71.8 percent was 28.1 percent in perngaruhi sebsar other variables.
International Journal of Business and Management Invention (IJBMI)inventionjournals
International Journal of Business and Management Invention (IJBMI) is an international journal intended for professionals and researchers in all fields of Business and Management. IJBMI publishes research articles and reviews within the whole field Business and Management, new teaching methods, assessment, validation and the impact of new technologies and it will continue to provide information on the latest trends and developments in this ever-expanding subject. The publications of papers are selected through double peer reviewed to ensure originality, relevance, and readability. The articles published in our journal can be accessed online
Effect of Product Quality and Service Quality toward Customer Satisfaction Ca...ijtsrd
This research was conducted aimed at 1 Knowing the quality of products at Uncle K Restaurants, 2 Knowing the quality of services at Uncle Restaurants, 3 Knowing the influence of product quality on customer satisfaction at Uncle K Restaurants, 4 Knowing the influence of service quality on customer satisfaction at Uncle K Restaurant, 5 Knowing simultaneously simultaneously the influence of product quality and service quality on customer satisfaction at Uncle K. Restaurant. This research is a quantitative descriptive method that uses numbers, starting from data collection, interpretation of the data, and the appearance of the results. The population in this study was consumers of Uncle K Restaurant during the study. The size of the research sample taken as many as 80 people is determined by the sample technique used in this study, namely, random sampling simple random sample sampling technique is named so because in taking the sample, researchers mix the subjects in the population so that all subjects were considered the same and data were collected using a Likert scale questionnaire that had 5 alternative answers. The results of this study indicate that 1 Product quality has a positive effect on customer satisfaction at Uncle K Restaurant, 2 Service quality has a positive effect on customer satisfaction at Uncle K Restaurant, 3 There is a positive influence between product quality and service quality to customer satisfaction in Uncle K Report with a correlation coefficient R of 0.728 and a coefficient of determination R 2 of 0.529. This means that 52.9 of customer satisfaction in Uncle K Restaurant are influenced by product quality and service quality, while the other 47.1 is determined. Robinson Nainggolan | Marasi Rustiani Hotmaida | Arisman Parhusip "Effect of Product Quality and Service Quality toward Customer Satisfaction (Case Study at K UNCLE Restaurant at PT. Benua Penta Global)" Published in International Journal of Trend in Scientific Research and Development (ijtsrd), ISSN: 2456-6470, Volume-3 | Issue-6 , October 2019, URL: https://www.ijtsrd.com/papers/ijtsrd29303.pdf Paper URL: https://www.ijtsrd.com/management/randd-management/29303/effect-of-product-quality-and-service-quality-toward-customer-satisfaction--case-study-at-k-uncle-restaurant-at-pt-benua-penta-global/robinson-nainggolan
Effect of Satisfaction on Customer Loyalty in Bimbel Tiki Taka Bekasi IndonesiaIJAEMSJORNAL
This study aims to determine whether there is influence on customer loyalty limb bimbelTiki Taka Harapan Indah Bekasi and how much influence on loyalty customers.The research was conducted at the Tiki Taka Harapan Indah Bekasi. The method used is the library reseach and field reseach data collection using questionnaires with a population of 45 people from the total number of parents enrolled students, obtained a sample of 31 people. The result of linear regression test is a = 20,55, b = 0,57, y = 20,55 + 0,57x. The result of correlation coefficient is r = 0.57. The percentage of influence satisfaction on customer loyalty amounted to 32.49% while the rest of 67.51% influenced by other factors not involved in this study.Test t count 3.74 and t table for n = 31 with degrees of freedom (dk) is n-2 = 29 with error rate 5% (0.05) is 2.045. From the above value is known that t arithmetic 3.74> of t table 2.045 then Ha accepted and Ho rejected. It means that based on data research results then there is Influence between satisfaction with customer loyalty at BimbelTiki Taka Harapan Indah Bekasi.
The Effect Service Quality to Customer Satisfaction and Customer Loyalty of A...IOSR Journals
Customer Loyalty is important for cultivated by the company, therefore the aim of this study to prove
how the effect of Service Quality and Customer Satisfaction in enhancing Customer Loyalty. Samples were
service users Railway Transport Argo Bromo Anggrek Jakarta Surabaya by using purposive side. Sample size of
300 respondents. Data analysis using Structural Equation Model (SEM). The results showed that Services
Quality significantly influence to customer satisfaction. Customer Satisfaction significant effect on Customer
Loyalty. Service Quality is not yet significant effect on Customer Loyalty, so that Customer Satisfaction is a
mediator of the relationship Service Quality on Customer Loyalty to PT Argo Bromo Anggrek Train Jakarta-
Surabaya. The implications that Customer Satisfaction is capable of mediating the quality of care in improving
Customer Loyalty.
Impact of Service Quality on the Customer Satisfaction: Case study at Online ...AI Publications
As it’s known business rely on the customers it means the profitability of any company change depending on customer demand. Due to that, it’s necessary to treat customer as the king of the market. In another meaning, Customer satisfaction is very important issue to company’s product which it measures the level of probability between company’s product and customer belief in which the happier customer with quality and types of products more products and more profit will occur. The purpose of this project was to determine the Impact of technical and functional service quality on the customer satisfaction and loyalty. Though conducting a survey number of results was collected, and the results belong to their view about different types of platform which they used for online meeting and academic stuff. Different nationality participates in this project including (Kurdish, Turkish, Arabic, Turkmen, Indian, Pakistan, Uzbek, Nigerian and British) with having different position such as head of the faculty, instructor, academic staff, head of the department and etc. in number of universities in Kurdistan region of Iraq. As it’s shown in chapter three Excel software was used to calculate collected data through (co-variance, correlation and regression analysis) methods. And Based on the result fulfillment, privacy issues were affected the customer satisfaction and loyalty.
The Effect Of Complaint Handling Towards Customers Satisfaction, Trust And Lo...theijes
The International Journal of Engineering & Science is aimed at providing a platform for researchers, engineers, scientists, or educators to publish their original research results, to exchange new ideas, to disseminate information in innovative designs, engineering experiences and technological skills. It is also the Journal's objective to promote engineering and technology education. All papers submitted to the Journal will be blind peer-reviewed. Only original articles will be published.
The Influence of Service Quality and Price on Customer Satisfaction in the Us...ijtsrd
This research was conducted to determine Service Quality and Price on Consumer Satisfaction, this research uses quantitative methods with causal associative research types. In this study, the population is consumers who use online motorcycle taxis in Medan. The method of taking samples in this study was using an accidental sampling technique of 92 respondents. Data analysis techniques used validity test, reliability test, classic assumption test, multiple linear regression analysis, t test, F test and coefficient of determination R2 using SPSS version 22 application.The results of the t test for the service quality variable t count of 4.348 t table of 1.986 which means that service quality has an effect on customer satisfaction and price variable t count of 0.355 t table of 1.986 which means that price has no effect on customer satisfaction. F test variable service quality and price F count of 12.538 F table 3.10 indicates that service quality and price simultaneously affect consumer satisfaction. John Gilbert Lbn. Raja | Ayu Syaputri | Syamsuddin | Nurmalini "The Influence of Service Quality and Price on Customer Satisfaction in the Use of Ojek Online in Medan Tembung" Published in International Journal of Trend in Scientific Research and Development (ijtsrd), ISSN: 2456-6470, Volume-7 | Issue-2 , April 2023, URL: https://www.ijtsrd.com.com/papers/ijtsrd56185.pdf Paper URL: https://www.ijtsrd.com.com/management/consumer-behaviour/56185/the-influence-of-service-quality-and-price-on-customer-satisfaction-in-the-use-of-ojek-online-in-medan-tembung/john-gilbert-lbn-raja
Chỉ số hài lòng của khách hàng (Customer Satisfaction Index – CSI) - Cơ sở lý...Jackie Nguyen
Việc thỏa mãn khách hàng trở thành một tài sản quý giá của doanh nghiệp trong nỗ lực nâng cao chất lượng dịch vụ; xây dựng lòng trung thành với khách hàng; khẳng định thương hiệu; nâng cao năng lực cạnh tranh của doanh nghiệp.
Sự hài lòng của khách hàng là một chủ đề phổ biến trong thực hành tiếp thị và nghiên cứu học thuật từ nghiên cứu ban đầu của Cardozo (1965) về nỗ lực, sự mong đợi và sự hài lòng của khách hàng.
Giese và Cote, 2000 - Tiếp tục nghiên cứu và có nhiều nỗ lực để đo lường và giải thích sự hài lòng của khách hàng, nhưng vẫn chưa nhận được nhiều sự đồng thuận về định nghĩa của nó.
Gundersen, Heide và Olsson, 1996 - Sự hài lòng của khách hàng thường được định nghĩa là một tiêu chuẩn đánh giá tiêu thụ bài viết liên quan đến một sản phẩm hoặc dịch vụ cụ thể.
Oliver, 1980 - Đây là kết quả của quá trình đánh giá tương phản với kỳ vọng mua trước với nhận thức về hiệu suất trong và sau trải nghiệm tiêu thụ (Oliver, 1980).v.v...
Để có được lý thuyết và mô hình chuẩn ứng dụng như hôm nay, đã trải qua rất nhiều thử nghiệp, nghiên cứu trên thế giới.
---
THANHPHAT TECHNOLOGY LTD | SMARTRETAIL
Hotline/ Zalo: (+84) 935 888 489
Email: sales@SmartRetail.vn
https://smartretail.vn/
https://smartretail.com.vn/
The Effects of Customer Expectation and Perceived Service Quality on Customer...Samaan Al-Msallam
ABSTRACT : The effect of the antecedents of satisfaction on customer satisfaction is an issue still under debate in the academic literature. Thus, the primary goal of this article is to analyze the relationship between two of the most important antecedents of customer satisfaction ( namely customer expectation and perceived service quality ) and customer satisfaction . Data were collected through a survey, including samples of 250 customers from the 5 Banks in Damascus, Syria . Spss is used to test the hypotheses. The finding show that customer expectation and perceived service quality have a positive effect on customer satisfaction . Bank managers must know how improvement in service quality influences customer satisfaction and what expectation levels they might consider to increase consumer satisfaction which ultimately retains valued customers. KEYWORDS : Customer Expectation , Perceived Service Quality, Customer Satisfaction.
The Effects of Customer Expectation and Perceived Service Quality on Custome...inventionjournals
International Journal of Business and Management Invention (IJBMI) is an international journal intended for professionals and researchers in all fields of Business and Management. IJBMI publishes research articles and reviews within the whole field Business and Management, new teaching methods, assessment, validation and the impact of new technologies and it will continue to provide information on the latest trends and developments in this ever-expanding subject. The publications of papers are selected through double peer reviewed to ensure originality, relevance, and readability. The articles published in our journal can be accessed online.
Similar to 6. hapzi ali, et al., 2016, mercu buana univversity,iosr jbb (20)
Most small businesses struggle to see marketing results. In this session, we will eliminate any confusion about what to do next, solving your marketing problems so your business can thrive. You’ll learn how to create a foundational marketing OS (operating system) based on neuroscience and backed by real-world results. You’ll be taught how to develop deep customer connections, and how to have your CRM dynamically segment and sell at any stage in the customer’s journey. By the end of the session, you’ll remove confusion and chaos and replace it with clarity and confidence for long-term marketing success.
Key Takeaways:
• Uncover the power of a foundational marketing system that dynamically communicates with prospects and customers on autopilot.
• Harness neuroscience and Tribal Alignment to transform your communication strategies, turning potential clients into fans and those fans into loyal customers.
• Discover the art of automated segmentation, pinpointing your most lucrative customers and identifying the optimal moments for successful conversions.
• Streamline your business with a content production plan that eliminates guesswork, wasted time, and money.
Digital marketing is the art and science of promoting products or services using digital channels to reach and engage with potential customers. It encompasses a wide range of online tactics and strategies aimed at increasing brand visibility, driving website traffic, generating leads, and ultimately, converting those leads into customers.
https://nidmindia.com/
Mastering Local SEO for Service Businesses in the AI Era is tailored specifically for local service providers like plumbers, dentists, and others seeking to dominate their local search landscape. This session delves into leveraging AI advancements to enhance your online visibility and search rankings through the Content Factory model, designed for creating high-impact, SEO-driven content. Discover the Dollar-a-Day advertising strategy, a cost-effective approach to boost your local SEO efforts and attract more customers with minimal investment. Gain practical insights on optimizing your online presence to meet the specific needs of local service seekers, ensuring your business not only appears but stands out in local searches. This concise, action-oriented workshop is your roadmap to navigating the complexities of digital marketing in the AI age, driving more leads, conversions, and ultimately, success for your local service business.
Key Takeaways:
Embrace AI for Local SEO: Learn to harness the power of AI technologies to optimize your website and content for local search. Understand the pivotal role AI plays in analyzing search trends and consumer behavior, enabling you to tailor your SEO strategies to meet the specific demands of your target local audience. Leverage the Content Factory Model: Discover the step-by-step process of creating SEO-optimized content at scale. This approach ensures a steady stream of high-quality content that engages local customers and boosts your search rankings. Get an action guide on implementing this model, complete with templates and scheduling strategies to maintain a consistent online presence. Maximize ROI with Dollar-a-Day Advertising: Dive into the cost-effective Dollar-a-Day advertising strategy that amplifies your visibility in local searches without breaking the bank. Learn how to strategically allocate your budget across platforms to target potential local customers effectively. The session includes an action guide on setting up, monitoring, and optimizing your ad campaigns to ensure maximum impact with minimal investment.
Unleash the power of UK SEO with Brand Highlighters! Our guide delves into the unique search landscape of Britain, equipping you with targeted strategies to dominate UK search engine results. Discover local SEO tactics, keyword magic for UK audiences, and mobile optimization secrets. Get your website seen by the right people and propel your brand to the top of UK searches.
To learn more: https://brandhighlighters.co.uk/blog/top-seo-agencies-uk/
Monthly Social Media News Update May 2024Andy Lambert
TL;DR. These are the three themes that stood out to us over the course of last month.
1️⃣ Social media is becoming increasingly significant for brand discovery. Marketers are now understanding the impact of social and budgets are shifting accordingly.
2️⃣ Instagram’s new algorithm and latest guidance will help us maintain organic growth. Instagram continues to evolve, but Reels remains the most crucial tool for growth.
3️⃣ Collaboration will help us unlock growth. Who we work with will define how fast we grow. Meta continues to evolve their Creator Marketplace and now TikTok are beginning to push ‘collabs’ more too.
SEO as the Backbone of Digital MarketingFelipe Bazon
In this talk Felipe Bazon will share how him and his team at Hedgehog Digital share our journey of making C-Levels alike, specially CMOS realize that SEO is the backbone of digital marketing by showing how SEO can contribute to brand awareness, reputation and authority and above all how to use SEO to create more robust global marketing strategies.
The session includes a brief history of the evolution of search before diving into the roles technology, content, and links play in developing a powerful SEO strategy in a world of Generative AI and social search. Discover how to optimize for TikTok searches, Google's Gemini, and Search Generative Experience while developing a powerful arsenal of tools and templates to help maximize the effectiveness of your SEO initiatives.
Key Takeaways:
Understand how search engines work
Be able to find out where your users search
Know what is required for each discipline of SEO
Feel confident creating an SEO Plan
Confidently measure SEO performance
Digital Money Maker Club – von Gunnar Kessler digital.focsh890
Title One is a comprehensive examination of the impact of digital technologies on
modern society. In a world where technology continues to advance rapidly, this article delves into the nuances and complexities of the digital age, exploring Its implications across various sectors and aspects of life.
In this presentation, Danny Leibrandt explains the impact of AI on SEO and what Google has been doing about it. Learn how to take your SEO game to the next level and win over Google with his new strategy anyone can use. Get actionable steps to rank your name, your business, and your clients on Google - the right way.
Key Takeaways:
1. Real content is king
2. Find ways to show EEAT
3. Repurpose across all platforms
The What, Why & How of 3D and AR in Digital CommercePushON Ltd
Vladimir Mulhem has over 20 years of experience in commercialising cutting edge creative technology across construction, marketing and retail.
Previously the founder and Tech and Innovation Director of Creative Content Works working with the likes of Next, John Lewis and JD Sport, he now helps retailers, brands and agencies solve challenges of applying the emerging technologies 3D, AR, VR and Gen AI to real-world problems.
In this webinar, Vladimir will be covering the following topics:
Applications of 3D and AR in Digital Commerce,
Benefits of 3D and AR,
Tools to create, manage and publish 3D and AR in Digital Commerce.
How to Run Landing Page Tests On and Off Paid Social PlatformsVWO
Join us for an exclusive webinar featuring Mariate, Alexandra and Nima where we will unveil a comprehensive blueprint for crafting a successful paid media strategy focused on landing page testing.With escalating costs in paid advertising, understanding how to maximize each visitor’s experience is crucial for retention and conversion.
This session will dive into the methodologies for executing and analyzing landing page tests within paid social channels, offering a blend of theoretical knowledge and practical insights.
The Pearmill team will guide you through the nuances of setting up and managing landing page experiments on paid social platforms. You will learn about the critical rules to follow, the structure of effective tests, optimal conversion duration and budget allocation.
The session will also cover data analysis techniques and criteria for graduating landing pages.
In the second part of the webinar, Pearmill will explore the use of A/B testing platforms. Discover common pitfalls to avoid in A/B testing and gain insights into analyzing A/B tests results effectively.
5 big bets to drive growth in 2024 without one additional marketing dollar AND how to adapt to the biggest shifting eCommerce trend- AI.
1) Romance Your Customers - Retention
2) ‘Alternative’ Lead Gen - Advocacy
3) The Beautiful Basics - Conversion Rate Optimization
4) Land that Bottom Line - Profitability
5) Roll the Dice - New Business Models
Come learn how YOU can Animate and Illuminate the World with Generative AI's Explosive Power. Come sit in the driver's seat and learn to harness this great technology.
Coca Cola Branding Strategy and strategic marketing plan
6. hapzi ali, et al., 2016, mercu buana univversity,iosr jbb
1. IOSR Journal of Business and Management (IOSR-JBM)
e-ISSN: 2278-487X, p-ISSN: 2319-7668. Volume 18, Issue 10. Ver. VII (October. 2016), PP 40-48
www.iosrjournals.org
DOI: 10.9790/487X-1810074048 www.iosrjournals.org 40 | Page
Analysis of Servqual And Product Quality Effects on Customer
Satisfaction In Retail (A Field Research In Giant Citra Raya)
Riki Kristomi Agung Wibowo1
, Hapzi Ali2
, Rani Purwanti Kemalasari3
1
Division Manager Giant Citra Raya DAIRY FARM, Tangerang Indonesia
2
Profesor of Management Mercubuana University, Jakarta Indonesia
3
Lecturer of Mercubuana University, Jakarta Indonesia
Abstract: As the growth of supermarket outlets is rapidly increasing, making the customers have more need to
satisfaction. This research is to analysistthe effect ofservice quality and product quality oncustomer satisfaction.
This research object is Giant Tangerang Citra Raya (PT. Hero Supermarket TBK/Dairy Farm. co). Research
problems refers to business phenomenon in Giant Citra Raya: what increasing customers satisfaction. A model
has been built, and three research hypothesis has been formulated. Overall research respondents are
subscribers Giant Tangerang Citra Raya (PT. Hero Supermarket Tbk) in Tangerang . The sampling method
used was accidental sampling of the entire customer of Giant Citra Raya is eligible. The number of sampling
formula in this study used Slovin formula, with 152 respondents.Data analysis utilizes Path Analysis with SPSS.
Result of this research shows the service quality and quality of product of influential positive on customer
satisfaction.
Keywords: quality, service, product, customer satisfaction.
I. Introduction
Hectic business competition in the retail sector, forcing retailers continue to innovate and imitate each
other in seizing the customer to win the competition. Imitate each other to make each retail concept similar
again become indistinguishable.
High competition, also cause customers face more alternative products, prices and quality vary, so
customers will always find the values most highly regarded of some products (Kotler, 2005). Low quality (both
services and products) will cause dissatisfaction in customers, such as retail, not just customers who shop at the
retail but also have an impact on others. Because customers are disappointed to be told at least to the 15 others.
The impact, potential customers would impose his choice to competitors (Lupiyoadi and Hamdani, 2006).
Efforts to improve service quality system, it would be much more effective for business continuity.
In general, it is said that if customers are satisfied with the products or services offered, they then may
re-purchase and add to their purchase (Kotler, 2008). "Customer satisfaction will occur when the value and
customer service provided in retailing experience meet or exceed customer expectations (Aeron Setiawan and
John Sondra Kunto, 2013: 1)". Then a satisfied customer may tell the others about their mutual experiences, thus
generating the information by word of mouth is positive, thereby increasing the company's market share. (Yes
Ozkaya and Selda E 2014).
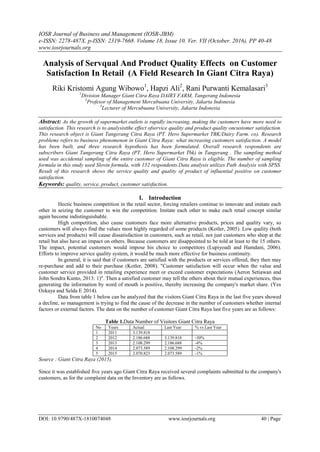
Data from table 1 below can be analyzed that the visitors Giant Citra Raya in the last five years showed
a decline, so management is trying to find the cause of the decrease in the number of customers whether internal
factors or external factors. The data on the number of customer Giant Citra Raya last five years are as follows:
Table 1.Data Number of Visitors Giant Citra Raya
No Years Actual Last Year % vs Last Year
1 2011 3.139.818
2 2012 2.186.688 3.139.818 -30%
3 2013 2.108.299 2.186.688 -4%
4 2014 2.073.589 2.108.299 -2%
5 2015 2.070.823 2.073.589 -1%
Source : Giant Citra Raya (2015).
Since it was established five years ago Giant Citra Raya received several complaints submitted to the company's
customers, as for the complaint data on the Inventory are as follows.
2. Analysis of Servqual And Product Quality Effects on Customer Satisfaction In Retail ( A Field ..
DOI: 10.9790/487X-1810074048 www.iosrjournals.org 41 | Page
Table2. List of Customer Complaints
No Division Complaint
1 Service 1. Lack of personnel, so that when customers need information to be looking for a first officer.
2. The cashier provided insufficient, so customers have to queue at the time to pay.
3. Cashier less friendly.
2 Product 1. Certain products are often out of stock so that customers who specifically want to buy these
products to feel disappointed.
2. Lack of variety of products, so customers difficult to compare.
3. The fresh products are sold sometimes less fresh even unseemly.
Source :Observ in Giant Citra Raya (2015).
The company's decision to take remedial action services and products systematically is an umbrella
decisive in following up on consumer complaints of a failure that could ultimately satisfy the consumer.
Customer satisfaction is not only valuable in good economic times, but also in bad economic times.
The study was conducted with the aim to: 1) analyze the effect of service quality on customer satisfaction; 2) to
analyze the effect of product quality to customer satisfaction; and 3) to analyze the influence of the quality of
service and product quality to customer satisfaction, both directly and indirectly simultaneously.
Literature Review And Hypothesis
Service quality: reflect all dimensions of deals that generate benefits for customers. In the context of
the quality of services, also according to Kotler and Keller (2008; 156), there are several dimensions of quality
as the reference, which are: 1) Responsiveness (responsiveness), the ability to help customers and availability to
serve customers well; 2) Reliability (reliability), the ability to perform the promised services in accordance with
immediate, accurate and satisfactory; 3) Empathy (empathy), which is a sense of caring to give individual
attention to customers, understand customer needs, as well as easy to be contacted; and 4) Assurance
(collateral), namely knowledge, courtesy of its officers and trustworthy so that customers are free from risk;
Tangibles (direct evidence), which includes the physical facilities, equipment for employee communications.
Product Quality: According to Mullins, et. al (2005: 422) if the company wants to maintain its
competitive advantage in the market, companies must understand what aspect of the dimensions used by
consumers to distinguish the products sold by the company with competitors' products. In the retail quality of
products is divided into product quality, product packaging, sales, and availability / product variation.
Dimensional quality of the product itself consists of:
1) Performance, related to the basic operating characteristics of a product.
2) Durability, which means how long or life of the product concerned to survive before the product must be
replaced. The greater the frequency of use of consumer to the product, the greater the durability of the
product.
3) Conformity to specifications, namely the extent to which the basic operating characteristics of a product
meets certain specifications of the consumer or not the discovery of defects in the product.
4) Features, are the characteristics of products designed to enhance the functionality of the product or increase
consumer interest towards the product.
5) Reliabilty, is the probability that the product will work satisfactorily or not in a given time period. The
smaller the chance of damage to the produce may be unreliable.
6) Aesthetics, dealing with how the product appearance can be seen from the look, taste, smell, and the shape
of the product.
7) Perceived quality, often said to be an outcome of the use of measurements carried out indirectly because
there is a possibility that consumers do not understand or lack of information on the product concerned.
Thus, consumer perceptions of products derived from the price, brand, advertising, reputation, country of
origin, in ritell availability.
Customer satisfaction: Oliver (2010: 129) states that the key to retaining customers is customer
satisfaction, customer satisfaction where the dimensions are: 1) Expectations, the customer is satisfied only if
the fact they are buying products that already meet or exceed the expectation / expectations of them. A good
product is a product that is able to meet the expectations / expectations of its customers, so that customers will
have a positive experience after purchasing the product; 2) Subjective Disconfirmation, the customer is satisfied
if there are no matters or reasons related products that incompatibility is subjective; 3) Performance Outcomes,
the customer is satisfied with the overall performance of the products he purchased and get the optimal benefits
in accordance with what he wants.
Based on previous studies, can pull relationship between variables affect service quality to customer
satisfaction is partially based on research Krishna, et ,. al (2010: 8), affect product quality to customer
satisfaction is partially based on research Ehigie (2006), quality of service together influential product quality to
customer satisfaction based research Kursunluoglu (2007). Figure frameworks like Figure 1 below.
3. Analysis of Servqual And Product Quality Effects on Customer Satisfaction In Retail ( A Field ..
DOI: 10.9790/487X-1810074048 www.iosrjournals.org 42 | Page
Figure 1: Framework
The research hypotheses are: 1) Quality of service influence on customer satisfaction; 2) Quality of
service a positive effect on customer satisfaction; and 3) the quality of service and product quality positively
affects customer satisfaction.
II. Methods
This research uses explanatory research design. The sampling method used is a non-probability sample
or not random. The sampling technique in this research is using accidental sampling (how unintentional) where
researchers have the freedom to choose who encountered which can be sampled as per the requirements of the
existing population. The method used in this study is a survey method.
The population in this study is the Giant Customer Citra Raya average 2,070,823 / 12/30 = 5752 per
day. The samples used a proper sampling method in order to obtain a representative sample and to describe the
state of the population to the fullest. Therefore, the sample collection technique is done with accidental sampling
to determine customers who become members of the sample. The size or the number of samples in this study are
determined based on the theory developed by Slovin, Umar (2008: 141) with the formula sukuran sample of 152
respondents. Path analysis tools Analysis with SPSS version 2:33.
Path analysis is one tool of analysis developed by Sewall Wright (Dillon and Goldstein, 1984). Wright
developed a method to determine the direct and indirect effect of a variable, where there are variables that
influence (exogenous variables) and variables that influenced (endogenous variables), Hapzi Ali and Nandan
Limakrisna (2013: 137).
Prior to the analysis instrument to test the questionnaire with validity and realibiltas and classical
assumptions of indicators, dimensions and variables of the study.
III. Result & Discussion
Validity and reliability test
Before instrument questionnaire given to respondents in advance in the validity and realibitas. Validity
by analyzing count r (coefficient) and r table. If r count> r table of the questionnaire conclude valid and can
continue to the next analysis.
Table 3. Validity Service Quality (X1)
Service Quality (X1) Koefisien Validity rTable Conclusion
X1.11 0.684 0.159 Valid
X1.12 0.472 0.159 Valid
X1.13 0.487 0.159 Valid
X1.14 0.458 0.159 Valid
X1.21 0.454 0.159 Valid
X1.22 0.501 0.159 Valid
X1.23 0.488 0.159 Valid
X1.24 0.459 0.159 Valid
X1.25 0.457 0.159 Valid
4. Analysis of Servqual And Product Quality Effects on Customer Satisfaction In Retail ( A Field ..
DOI: 10.9790/487X-1810074048 www.iosrjournals.org 43 | Page
X1.31 0.564 0.159 Valid
X1.32 0.616 0.159 Valid
X1.33 0.656 0.159 Valid
X1.34 0.702 0.159 Valid
X1.35 0.623 0.159 Valid
X1.41 0.709 0.159 Valid
X1.42 0.631 0.159 Valid
X1.43 0.588 0.159 Valid
X1.44 0.589 0.159 Valid
X1.51 0.518 0.159 Valid
X1.52 0.595 0.159 Valid
X1.53 0.553 0.159 Valid
X1.54 0.431 0.159 Valid
Source: Results of the questionnaire data processing, 2015
Based on Table 3 above it can be seen that the entire item questionnaire to the variable quality of
service altogether has rhitung> rtabel, (rhitung> 0159) so that the whole item questionnaire on price perception
variable declared invalid. The results of the validation test calculations for variable product quality obtained the
following results:
Table4.Validity Product Quality (X2)
Product Quality (X2) KoefisienValidity rTable Conclusion
X2.1 0.831 0.159 Valid
X2.2 0.661 0.159 Valid
X2.3 0.684 0.159 Valid
X2.4 0.639 0.159 Valid
X2.5 0.758 0.159 Valid
X2.6 0.732 0.159 Valid
X2.7 0.840 0.159 Valid
Source: Results of the questionnaire data processing, 2015
Based on Table 4 above it can be seen that the entire item questionnaire to the variable quality of the products
entirely have rhitung> rtabel, (rhitung> 0159) so that the whole item questionnaire on product quality variable
declared invalid.
The results of the validation test calculations for Customer Satisfaction variables obtained the following results
Table5. Validity Customer Satisfaction (Y)
Customer Satisfaction (Y) Koefisien Validity rTable Conclusion
Y1 0.799 0.159 Valid
Y2 0.841 0.159 Valid
Y3 0.754 0.159 Valid
Source: Results of the questionnaire data processing, 2015
Based on the above table 5 it can be seen that the entire item questionnaire for the whole price
perception variables have rhitung> rtabel, (rhitung> 0159) so that the whole item questionnaire on the
perception variables declared invalid value.
Table 6.UjiReliabilitas
Variabel Cronbach’s Alpha N of Item
Service Quality (X1) 0.893 22
Product Quality (X2) 0.860 7
Customer Satisfaction (Y) 0.716 3
Source: Results of the questionnaire data processing, 2015
Based on Table 6 above we can see that all the dependent variables as well as the intervening variable
and independent variable has a value of Cronbach's alpha> 0.6 for all variables that are reliable and can be used
for measurements in the context of data collection.
Classical assumption
Normality test.Before conducting further analysis to determine whether the data were normally distributed data
must be necessary to test for normality using the scatterplot and Kolmogorov-Smirnov test.
5. Analysis of Servqual And Product Quality Effects on Customer Satisfaction In Retail ( A Field ..
DOI: 10.9790/487X-1810074048 www.iosrjournals.org 44 | Page
Source: Output SPSS 23.0 for windows
Figure 2.Normal P-Plot Customer Satisfaction
From Figure 2 it can be seen that all the data follow or be around diagonal (expected normal) so that all the data
that is normally distributed. Thus these data meet the assumption of normal or normality following the line so
that the regression model proposed feasible to use.
Table 7.Kolmogorov-Smirnov test
One-Sample Kolmogorov-Smirnov Test
Standardized
Residual
N 152
Normal Parametersa,b
Mean ,0000000
Std. Deviation ,99335541
Most Extreme Differences Absolute ,053
Positive ,034
Negative -,053
Test Statistic ,053
Asymp. Sig. (2-tailed) ,200c,d
a. Test distribution is Normal.
b. Calculated from data.
c. Lilliefors Significance Correction.
d. This is a lower bound of the true significance.
Source: Output SPSS 23.0 for windows
Table 7 above using the Kolmogorov-Smirnov test, the results of tests conducted found angkaAsymp sig> 0.05
(5%) so the normal distribution of data distribution and data are good for further analysis.
Multicolinearity Test. Multicolinearity is an event that inform Whether independent variable has
similarity with other independent variable in-one models. Multicolinearity can be observed from varience
Inflation Factor (VIP) and Tolerance (TOL).
Table 8.Coefficient collinearity
Coefficients
Model Collinearity Statistics
Tolerance VIF
1 (Constant)
Service Quality .266 3.756
Product Quality .266 3.756
Dependent Variable: Customer Satisfaction
Based on multi collinearity test table we can see that VIF and TOL mean each independent variable has VIF no
more than 10 (VIF<10) and TOL > 0,1. Thus we can conclude that structure path analysis model is free of
multicollinearity assumption.
Research result
The results of such a study table 9 below with variable coefficient of quality of service (X1) and product quality
above X2 is (Pyx1 = 0526 and Pyx2 = 0.362) and the correlation between variables X1 and X2 are the 0857
served as figure 3 below
6. Analysis of Servqual And Product Quality Effects on Customer Satisfaction In Retail ( A Field ..
DOI: 10.9790/487X-1810074048 www.iosrjournals.org 45 | Page
Table 9. Coefficients regression
Coefficient
Model Unstandardized Coefficients Standardized Coefficients T Sig.
B Std. Error Beta
1 (Constant) ,342 ,178 1,927 ,056
Service Quality ,606 ,094 ,526 6,428 ,000
Product Quality ,324 ,073 ,362 4,428 ,000
a. Dependent Variable: Customer Satisfaction
Sumber: Output SPSS 23.0 for windows
Source: Result from the data, 2015
Figure 3. Path Analysis Structure
Determination analysis (R2
).
The R value of 0.857 in Table 8 below shows the double correlation (quality of service and product
quality) with loyalitasinvestor. Taking into account the variations in the value of R Square of 0.735 which
indicates the magnitude of the role or contribution of the variable quality of service and product quality to
explain the variables of customer satisfaction for 73.5 percent and the remaining 26.5 percent is influenced by
other variables.
Table 8. Modelsummary
Model Summary
Model R R Square Adjusted R Square Std. Error of the Estimate
1 ,857a
,735 ,732 ,25591
a. Predictors: (Constant), Product Quality, Service Quality
Source: Output SPSS 23.0 for windows
Effect of Partial (t test) and Simultaneous Effect (Test F)
Assessment of the effect of partial aims to examine whether each of the independent variables
significantly influence the dependent variable partially with α = 0.05 and also the acceptance or rejection of the
hypothesis. Partial test (t test) to answer a hypothetical one and two of this study.
Table 9. Result t test (Parcial)
No. Variabel Bebas t hitung Sig. t
1 Service Quality (X1) 6,428 0.000
2 Product Quality(X2) 4,428 0.000
Source : Estimasi Regresi Result
From Table 9 above the figures obtained t count variable X1 for 6,428, because t count> t table (6,428>
1,683), then Ho is rejected and H1 accepted, meaning partially significant effect service quality to customer
satisfaction. In addition, also for the test based on significance testing, can be seen from the output of
significance of 0.000, due to number more significance level of <0.05 (0.000 <0.05), it can be concluded that the
quality of service affects signifilan to customer satisfaction, so the first hypothesis is accepted.
Furthermore, in Table 9 above figures obtained t calculate the variable quality of the product (X2) is
4.428, because t count> t table (4.428> 1,683), then Ho is rejected, meaning a partial no influence product
quality to customer satisfaction. In addition, also for the test based on significance testing, can be seen from the
output of significance of 0.000, due to the significance level figures much of <0.05 (0.000 <0.05), it can be
concluded that the quality of the products a significant effect on customer satisfaction, thus the second
hypothesis is accepted.
To answer the third hypothesis THAT the quality of service and product quality influence on customer
satisfaction simultaneously can be seen from Table 10 below.
7. Analysis of Servqual And Product Quality Effects on Customer Satisfaction In Retail ( A Field ..
DOI: 10.9790/487X-1810074048 www.iosrjournals.org 46 | Page
Table10. Result F Simultan Test
ANOVA
Model Sum of Squares Df Mean Square F Sig.
1 Regression 27,095 2 13,548 206,868 ,000b
Residual 9,758 149 ,065
Total 36,853 151
a. Dependent Variable: Customer Satisfaction
b. Predictors: (Constant), Product Quality, Service Quality
Source: Output SPSS 23.0 for windows
From table 10 above (ANOVA table) obtained Fhitung 206 868 greater than Ftable 3:10 (206 868>
3.10) and a significant value of 0.000 is less than 5 percent (0.000 <0.05). Then the null hypothesis (H0) is
rejected and the hypothesis alternative (H1) is accepted, meaning that there is significant influence variable
quality of service (X1) and the quality of the product (X2) to the satisfaction of the customer (Y) together
(simultaneously) at Giant Citra Raya (PT . Hero Supermarket Tbk) in Tangerang. Thus the third hypothesis is
accepted.
Aside from the influence can simultaneously also in the analysis of the influence of lanngsung and indirect
results of the process such as table 11 below:
Table 11. Recapitulation Effect of Direct and Indirect
Variable Direct Indirect Sub Total Total
X1 X2
Service Quality (X1) 27,67% 16,32% 43,98% 43,98%
Product Quality (X2) 13,1% 16,32% 29,42% 29,42%
Total effect X1, X2 73.4%
Total Effect of other variables 26,59%
Source: Data processed for the purposes of research, in 2015
The total value of the influence of Quality of Service (X1) and Product Quality (X2) on customer
satisfaction (y) both directly and indirectly is sebsar 73.4 percent. This value is equal to the value of R-square of
73.5 percent 0.1 only differ due to rounding as in table 8 Anova above. This process aims to determine the effect
of direct and indirect between independent variables. Not that variable X1 or X2 be intervening variable but
only to test the value of R square is equal to the total direct and indirect influence.
1. Quality of Service effect on Customer Satisfaction
Quality of service is positive and significant impact on customer satisfaction. The quality of service
that better reflects all dimensions of deals that generate benefits for customers. In the context of service quality
according to Kotler and Keller (2008; 156), the dimensions of service quality are: 1) Responsiveness; 2)
Reliability; 3) Empathy; and 4) Assurance. The key to retaining customers is customer satisfaction, Oliver
(2010: 129), where the dimensions of customer satisfaction are: 1) Expectations; 2) Subjective
Disconfirmationd; and 3) Performance Outcomes.
If the company wants to maintain its competitive advantage in the market, companies need to
understand aspects of the quality of service expected by the consumer to differentiate the company's products
are sold to a competitor's product, Mullins, et. al (2005: 422).
The results of this study supported research conducted Emel (2007), patricia hudelstone (2009) and act
saif malik (2012) that there are significant positive and significant correlation between quality of service and
customer satisfaction. Besides, strengthened also by the findings that the quality of service is positive and
significant impact on customer satisfaction partially, Hapzi Ali, Nanda Limakrisna & Djamalluddin Said (2016).
2. Product Quality effect on Customer Satisfaction
Product quality and significant positive effect on customer satisfaction. In the retail quality of products
is divided into product quality, product packaging, sales, and availability / product variation. Dimensional
quality of the product itself consists of: 1) Performance; 2) Durability: 3) conformance to specifications; 4)
Features (features); 5) reliabilty; 6) Aesthetics; 7) Perceived quality. Customer satisfaction is the key to
retaining customers Oliver (2010: 129), where the dimensions of customer satisfaction are: 1) Expectations; 2)
Subjective Disconfirmationd; and 3) Performance Outcomes.
The results are consistent with research Emel (2007), patricia Huddlestone (2009) and Bijana (2011),
where the quality of the products berpengaruhi positive and significant impact on customer satisfaction.
8. Analysis of Servqual And Product Quality Effects on Customer Satisfaction In Retail ( A Field ..
DOI: 10.9790/487X-1810074048 www.iosrjournals.org 47 | Page
3. Quality of Service and Quality of Products effect on customer satisfaction simultaneously, and both
direct and indirect
The quality of service and product quality simutan positive and significant impact on customer
satisfaction. The quality of service that better reflects all dimensions of deals that generate benefits for
customers. In the context of service quality according to Kotler and Keller (2008; 156), the dimensions of
service quality are: 1) Responsiveness; 2) Reliability; 3) Empathy; and 4) Assurance. The key to retaining
customers is customer satisfaction, Oliver (2010: 129).
Product quality and significant positive effect on customer satisfaction. In the retail quality of products
is divided into product quality, product packaging, sales, and availability / product variation. Dimensional
quality of the product itself consists of: 1) Performance; 2) Durability: 3) conformance to specifications; 4)
Features (features); 5) reliabilty; 6) Aesthetics; 7) Perceived quality. Customer satisfaction is the key to
retaining customers Oliver (2010: 129), where the dimensions of customer satisfaction are: 1) Expectations; 2)
Subjective Disconfirmation; and 3) Performance Outcomes.
Results research is consistent with research Emel (2007), patricia Huddlestone (2009) and Bijana (2011
that there are significant jointly and positive between quality of service and product quality to customer
satisfaction. Quality of service is influenced neither by product quality to the customer satisfaction based on
research results from table 10 above, and vice versa. in addition, strengthened also by the findings that the
quality of service is positive and significant impact on customer satisfaction partially, Hapzi Ali, Nanda
Limakrisna & Djamalluddin Said (2016).
IV. Conclusion
Conclusions: 1) Quality of service is positive and significant impact on customer satisfaction Giant. This is
justified by the results of the analysis are able to contribute positively. So well known that there is a positive
result for the effect, directly or indirectly, with the dimensions of reliability becomes the dominant factor in
influencing customer satisfaction; 2) The effect on the product quality customer satisfaction Giant. This is
justified by the results of the analysis are able to contribute positively. Other results showed that the quality of
products directly and indirectly positive effect on customer satisfaction, with the dimensions of the performance
of the product is a dominant factor in influencing customer satisfaction Giant; and 3) quality of service and
product quality together or simultaneously influence customer satisfaction Giant Citra Raya. This is justified by
the results of the analysis are able to contribute positively and have a strong correlation.
Suggestions: 1) To improve customer satisfaction, Giant Citra Raya must consider the best service as promised
and ensure that customers purchase can be used optimally and in line with expectations (staff must sort the good
before the goods on display) and 2) On research further, researchers can conduct research with marketing
variables other than the variables that have been studied, also with data analysis method to another, so that later
obtained the findings of a new and more accurate results that can add to or supplement the results of previous
research , Finally, hopefully the data and this information can help similar companies in increasing sales.
References
[1] Ahmed, Zohaib, Muhammad Rizwan, Mukhtar Ahmad. (2014). “Effect of brand trust and customer satisfaction on brand loyalty in
Bahawalpur”. Journal of Sociological Research. Vol. 5, No.1 pp:306-326.
[2] Akbar, M, dan Parvez, N. (2009). ”Impact of Service Quality, Trust, and Customer Satisfaction on Customer Loyalty”. ABAC
Journal, Vol 29 (1), pp: 24-38
[3] American Journal of Industrial and Business Management, Vol. 2, pp: 217-229.
[4] Angelova, Biljana, Jusuf Zekiri. (2011).“Measuring Customer Satisfaction with Service Quality Using American Customer
Satisfaction Model (ACSI Model)”. International Journal of Academic in Business and Social Sciences Vol.1,No,3, p232.
[5] Berry, L., Zeithaml, V., Parasuraman, A (2008) The Service-, Quality Puzzle. Business Horizons.
[6] Doll W.J. dan Torkzadeh, G. & Weidong, Xia. (1994). A Confirmatory Factor Analysis of the End-User Computing Satisfaction
Instrument. MIS Quarterly. Vol. 18, No.4, pp:453-461
[7] Enel, Selda, Betül Özkaya. (2014). “Customer Satisfaction and Brand Loyalty in the Context of Retail Stores”. Asian Social Science
by Canadian Center. Vol. 10, No, 14, pp:52-66.
[8] Griffin, Jill. (2005). Customer Loyalty, Menumbuhkan dan MempertahankanKesetiaan Pelanggan. Erlangga. Jakarta.
[9] Hair, Anderson, dan Thatam Black. (1995). Multivariate Data Analysis with Reading. Prentice Hall, London.
[10] Hapzi Ali, H., Nandan, N.L., (2013). Metodologi Penelitian. Edisi 1, Cet. 1, Deepublish, Yogyakarta.
[11] Hapzi Ali, AdjiDjojo (2012), “Information Technology service performance and client’s relationship to increase banking image and
its influence on deposits customer banks loyalty (a survey of Banking in Jambi). Journal Archives Des Sciences Switzerland
(Geneva), ISSN : 1661464x, International Science Index /ISI-THOMSON Indexed Journal (2010 Impact Factor : 0.474), Page.
538-55.
[12] Hapzi Ali, Nanda Limakrisna, Said Djamalluddin (2016), Model of customer satisfaction :the empirical study at BRI in Jambi.
International Journal of Applied Business and Economic Research (IJABER) www.serialsjournal.com,ISSN : 0972-9380, Terindex
Scopus 0.100 (Q4), Vol. 13,No. 3, New Delhi India, Page: 707-719
[13] Huddleston, Patricia, Judith, Rachel Mattick and So Jung Lee. (2009). “Customer Satisfaction in Food Retailing: Comparing
Specialty and conventional Grocery Stores”.International Journal of Retail & Distribution Management. Vol. 37, No, 1, pp 63-80.
[14] Irawan, Handi. (2009). “10 Prinsip Kepuasan Pelanggan”. Jakarta : PT. Elex Media Komputindo.
9. Analysis of Servqual And Product Quality Effects on Customer Satisfaction In Retail ( A Field ..
DOI: 10.9790/487X-1810074048 www.iosrjournals.org 48 | Page
[15] Kheng, Lo Liang, O Mahamad, Ramayah. (2010). “The Impact of Service Quality on Customers Loyalty : A Study of Banks in
Penang”. International Journal of Marketing Studies. Vol. 2, No,2, pp:57-66.
[16] Kotler, P., & Garry Armstrong, (2012). Prinsip-prinsip Pemasaran. Edisi 12, Jilid 2, Erlangga, Jakarta.
[17] Kotler, P., & Keller, K.L., (2008). Marketing Management (13th edition). Prentice-Hall International, Inc., NJ.
[18] Krisna, (2010). Service Quality and its Effect on Customer Satisfaction in Retailing. Vol. 16, No,2, pp:231-243.
[19] Kursunluoglu, Emel. (2007). “Customer Service Effects on Customer Satisfaction and Customer Loyalty: A Field Research in
Shopping Centers in Izmir City – Turkey”. International Journal of Business and Social Science. Vol.2,No.17, p52.
[20] Lovelock, Christoper, Jochen Wirtz dan Jacky Mussry. (2012). Pemasaran Jasa Manusia, Teknologi, Strategi. Jilid I. Edisi ke tujuh.
Erlangga. Jakarta
[21] Lupiyoadi, Hamdani. (2006). “Manajemen Pemasaran Jasa, Edisi Kedua Jakarta” Penerbit Salemba Empat.
[22] Malhotra, Naresh K., dan Birks, David F. (2009). Marketing Research An Applied Approach. Second Edition. Prentice Hall.
Harlow.
[23] Munusamy, Jayaraman, Shankar Chelliah, Hor Wai Mun. (2010). “Service Quality Delivery and Its Impact on Customer
Satisfaction in the Banking Sector in Malaysia”. International Journal of Innovation, Management and Technology. Vol.1,No,4,
pp:398-404.
[24] Naik, Krishna, Swapna Bhargavi Gantasala, Gantasala Prabhakar. (2010). “New York Institute of Technology Sixth circle/Service
Quality (Servqual) and its Effect on Customer Satisfaction in Retailing”. European Journal of Social Sciences. Vol.16,No,2, pp:231-
243.
[25] Riduwan, dan Engkos A (2013), “Cara menggunakan dan memaknai Path Analysis”, Alfabeta Bandung, ISBN 978-979-8433-13-9
[26] Saif, Ulah Malik. (2012). “Customer Satisfaction, Perceived Service Quality and Mediating Role of Perceived Value”. Vol.4, No.
1, pp:68-76.
[27] Taylor, Shirley F, Harvir S Bansal, dan P. Gregory Irving. (2004). “Three Component Model of Customer Commitment to Service
Providers”. Journal of The Academy Marketing Science. Vol. 32, No. 3, pp: 234-250.